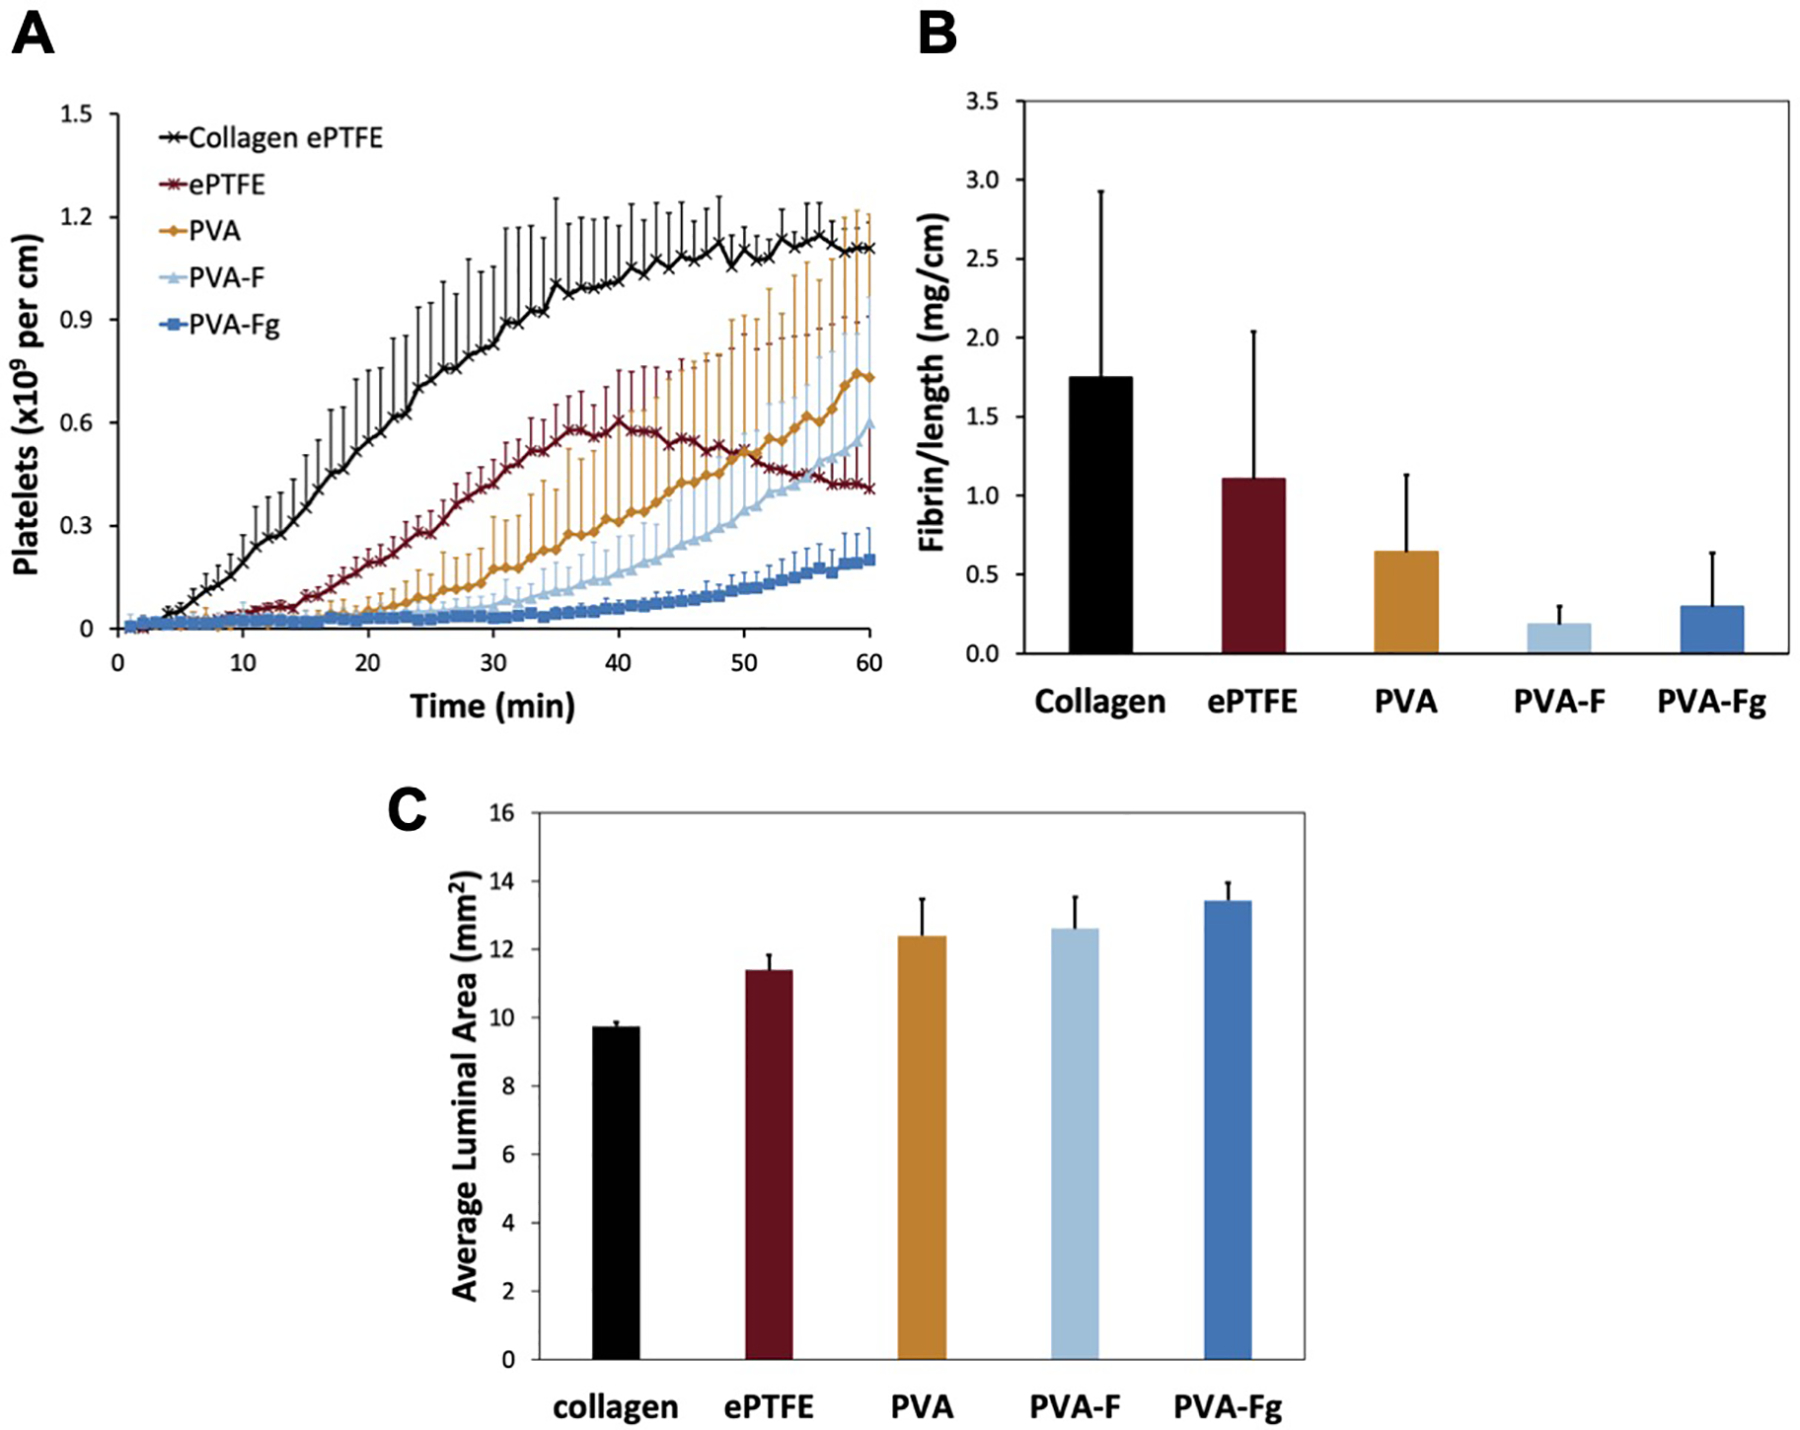
Figure 6.

Ex-vivo shunt study. Platelet accumulation (A), fibrin accumulation (B) and average luminal patent area (C) data are displayed as mean ± SD for all samples. Collagen and ePTFE controls are shown for comparison but were not included in the statistical comparison due to low sample size. No significant differences were observed between the various PVA samples for the platelet (p=0.0523), fibrin (p=0.201 for the 1-way ANOVA), or patent area (p=0.109 for the 1-way ANOVA) data.
