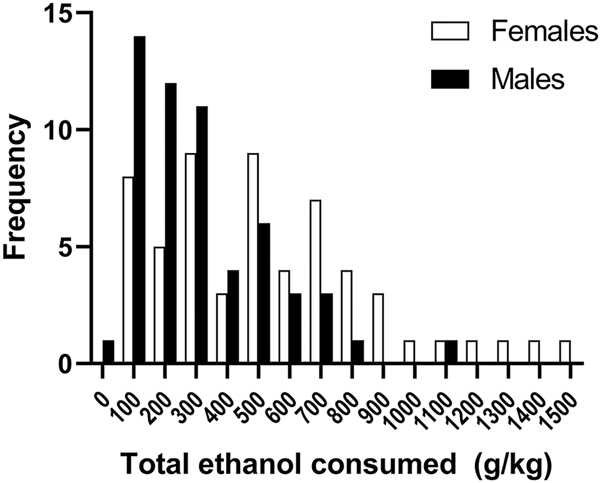
Figure 5. There was considerable individual animal variation in total amount of ethanol consumed during the 3-month drinking period, with females consuming more than males.
Frequency distributions for females and males representing the number of mice with levels of ethanol intake summed across 3 months. The range of values was 41 – 1508 g/kg (537 ± 45 g/kg for females; 313 ± 30 g/kg for males). N=58 for females; N=56 for males

