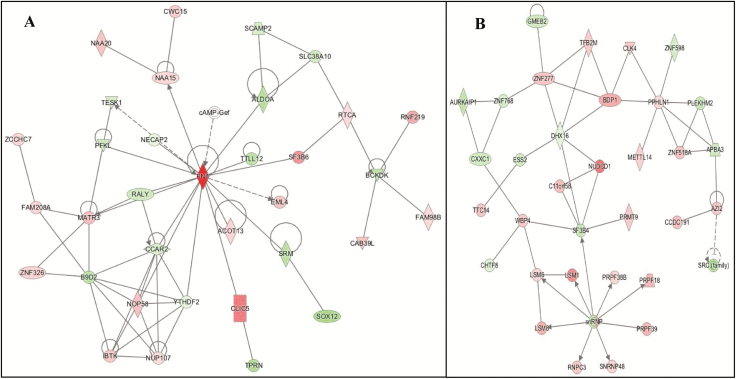
Figure 3.
The networks identified by IPA for PTSDwEDS versus PTSDw/outEDS: (A) Network 3—Carbohydrate Metabolism and (B) Network 4—RNA Posttranscriptional Modification. Green indicates that the gene is downregulated and red indicates that the gene is upregulated, with increased color saturation representing more extreme measurement in the dataset. Solid lines represent interactions, nontargeting interactions, or correlations between chemicals, proteins, or RNA. Arrowed lines represent activation, causation, expression, localization, membership, modification, molecular cleavage, phosphorylation, protein–DNA interactions, protein–TNA interaction, regulation of binding, transcription. Shapes represent molecule type (double circle = complex/group; square = cytokine; diamond = enzyme; inverted triangle = kinase; triangle = phosphatase; oval = transcription regulator; trapezoid = transporter; circle = other).

