

Abstract
Background
Cachexia is a major cause of morbidity in pancreatic ductal adenocarcinoma (PDAC) patients. Our purpose was to understand the impact of PDAC‐induced cachexia on brain metabolism in PDAC xenograft studies, to gain new insights into the causes of cachexia‐induced morbidity. Changes in mouse and human plasma metabolites were characterized to identify underlying causes of brain metabolic changes.
Methods
We quantified metabolites, detected with high‐resolution 1H magnetic resonance spectroscopy, in the brain and plasma of normal mice (n = 10) and mice bearing cachexia (n = 10) or non‐cachexia (n = 9) inducing PDAC xenografts as well as in human plasma obtained from normal individuals (n = 24) and from individuals with benign pancreatic disease (n = 20) and PDAC (n = 20). Statistical significance was defined as a P value ≤0.05.
Results
The brain metabolic signature of cachexia‐inducing PDAC was characterized by a significant depletion of choline of −27% and −21% as well as increases of glutamine of 13% and 9% and formate of 21% and 14%, relative to normal controls and non‐cachectic tumour‐bearing mice, respectively. Good to moderate correlations with percent weight change were found for choline (r = 0.70), glutamine (r = −0.58), and formate (r = −0.43). Significant choline depletion of −38% and −30%, relative to normal controls and non‐cachectic tumour‐bearing mice, respectively, detected in the plasma of cachectic mice likely contributed to decreased brain choline in cachectic mice. Similarly, relative to normal controls and patients with benign disease, choline levels in human plasma samples of PDAC patients were significantly lower by −12% and −20% respectively. A comparison of plasma metabolites from PDAC patients with and without weight loss identified significant changes in glutamine metabolism.
Conclusions
Disturbances in metabolites of the choline/cholinergic and glutamine/glutamate/glutamatergic neurotransmitter pathways may contribute to morbidity. Metabolic normalization may provide strategies to reduce morbidity. The human plasma metabolite changes observed may lead to the development of companion diagnostic markers to detect PDAC and PDAC‐induced cachexia.
Keywords: Human pancreatic cancer xenografts, Human plasma, Cachexia, Brain and plasma 1H MR spectroscopy, Metabolites
Introduction
Cancer‐associated cachexia is a complex multifactorial syndrome that causes metabolic changes in multiple organs including the liver, cardiovascular system, muscle, and adipose tissue. 1 , 2 Defined as an unintentional weight loss of 5% over 3 to 6 months, cachectic cancer patients who respond poorly to treatment, are more susceptible to treatment failure, experience fatigue, and have a poor quality of life. Certain cancers, such as pancreatic ductal adenocarcinoma (PDAC), often induce cachexia. 1 , 2 Although substantial progress has been made towards understanding the syndrome and identifying the many factors involved with its sustained progression, 3 other than effectively eradicating the entire tumour burden, effective treatments remain elusive.
Cancers exhibit dysregulated metabolism that can result in a systemic disruption of metabolic homeostasis. The central nervous system (CNS) is impacted by and responds to this disruption of metabolic homeostasis. 3 , 4 Systemic biochemical and physiological changes, such as chronic systemic inflammation that occur during tumour growth, alter brain structure and disrupt normal regulation by the brain of peripheral organ functions and appetite. 3 , 4 Several cachexia studies have focused on the hypothalamus, and associated brain regions and neural networks, to understand the role of the brain in loss of appetite or anorexia. 5 , 6 These reports have documented changes in the quantity and type of cytokines, chemokines, and their receptors in the peripheral as well as the CNS. 3 Studies with animal xenograft models have detected a sepsis‐like response in the brain of ovarian cancer‐bearing rats, 7 oxidative stress in the brains of breast cancer‐bearing rats, 8 and disruption of voltage‐gated potassium channel functions in the brains of hepatoma‐bearing rats. 9 Morphological and functional changes in the brains of cancer patients have been reported in magnetic resonance imaging (MRI) and functional MRI (fMRI) studies. 10 , 11 , 12
Comprehensive metabolomics of the brain based on ex‐vivo metabolite analyses of brain tissue from cachectic subjects have, however, not been reported. 31P and 1H MR spectroscopy (MRS) have been used to investigate energy or metabolite changes in tumours, lymph nodes, livers, skeletal muscle, urine, and serum of cachectic animals and patients, but not cachectic brains. 13 , 14 , 15 As a result, little is known, outside of inflammation, about cachexia brain metabolic signatures. Such knowledge may expand our understanding of how changes in brain metabolism may contribute to cachectic progression and identify strategies to treat disrupted brain metabolism to restore CNS controlled peripheral metabolic homeostasis.
Using our previously established mouse model of pancreatic cancer induced cachexia, 14 we compared metabolites in high‐resolution ex‐vivo 1H MR brain spectra of normal non‐tumour‐bearing mice used as controls, with brain spectra from mice with pancreatic tumour xenografts that were non‐cachexia inducing (Panc1 tumours) or that induced cachexia (Pa04C tumours). Consistent with our previous report, 14 control and Panc1 mice gained weight throughout the course of the study while Pa04C mice lost substantial body weight. The 1H MRS data identified a brain metabolic pattern that was unique to the brains of cachectic Pa04C mice as compared with non‐cachectic Panc1 mice and normal mice that we termed ‘cachexia brain metabolic signature’. We also identified a brain metabolic pattern that was observed in the brains of both types of tumour‐bearing mice, compared with control brains, that we termed ‘cancer brain metabolic signature’. The cachexia brain metabolic signature was characterized by a depletion of choline and an increase of glutamine and formate. These results identified, for the first time, alterations in the metabolite levels of two central neurotransmitter pathways, the choline/cholinergic and glutamine/glutamate/glutamatergic pathways that are vital to normal brain activity, in cachectic mice. These metabolic alterations may contribute to the morbidity associated with cachexia induced by PDAC.
Changes in brain metabolism were accompanied by metabolic alterations in 1H MRS spectra of mouse plasma that were also observed in human plasma, providing further insight into the underlying causes of changes in brain metabolism.
Materials and methods
Cell lines and cell culture
The human pancreatic cell line, Panc1, derived from a 56‐year‐old male patient with PDAC, was obtained from American Type Culture Collection. The human Pa04C cell line, derived from PDAC lung metastasis in a 59‐year‐old male patient, was provided by Dr Maitra. 14 Both cell lines were cultured in Dulbecco's Modified Eagle Medium‐10% foetal bovine serum at standard 37°C, 5% CO2, humidified incubator conditions.
Generation of tumour xenografts
All aseptic surgical procedures and animal handling were performed in accordance with protocols approved by the Johns Hopkins University Institutional Animal Care and Use Committee and conformed to the Guide for the Care and Use of Laboratory Animals published by the National Institutes of Health. Six to eight‐week‐old severe combined immunodeficient male mice were used in these studies. Panc1 or Pa04C cells (2 × 10⁶ cells) in 50 μL of Hanks solution were injected into the right flank of mice.
Mouse weights and tumour volume measurements
Mice were weighed once a week. After the roughly ellipsoidal tumours became palpable, these were measured using a digital calliper at the time of weighing. Total tumour volumes (mm3) were calculated as 0.524 (length × width × depth). Final mouse weights were obtained from euthanized mice with the tumours excised, to eliminate tumour weight contributing to the mouse weight.
Plasma choline quantification
For analysis of mouse plasma, whole blood was obtained immediately at the time of sacrifice via heart puncture and placed into ice‐cold vacutainer (EDTA) tubes on ice. Samples were centrifuged at 2500 g for 10 min, and plasma was then transferred into ice‐cold cryotubes, frozen in liquid N2, and stored at −80°C prior to use. De‐identified human plasma studies were performed under an approved institutional review board protocol. After thawing the plasma samples on ice, 10 μL of each sample was assayed with the EnzyChrom Choline Assay Kit (BioAssay Systems, Hayward, CA, USA) according to the manufacturer's instructions for the fluorimetric assay mode. Fluorescence was measured using a Molecular Devices microplate reader.
1H magnetic resonance spectroscopy analysis of brain extracts and plasma
Brain samples were obtained immediately at sacrifice. Intact brains were rapidly dissected from craniums, snap frozen in liquid N2, and stored at −80°C. Snap frozen samples of entire brains (160 to 210 mg) were powdered under liquid nitrogen, weighed, and dual‐phase extracted, as described previously. 14 The aqueous phase was collected, evaporated under a stream of nitrogen, and lyophilized to remove the remaining water. Samples were reconstituted in 650 μL of 1x phosphate buffered D2O (90% D2O, 10% H2O, pH = 7.4) containing trimethylsilylpropanoic acid, vortexed, and centrifuged at 500 g for 5 min at 4°C, and supernatants were analysed with 1H MRS.
Briefly, all 1H MR one‐dimensional (1D) spectra were acquired at room temperature on a Bruker Avance III 750 MHz (17.6 T) MR spectrometer equipped with a 5 mm broad band inverse probe. Spectra of aqueous‐phase brain samples, with water suppression achieved using pre‐saturation, were acquired using a single pulse sequence with the following experimental parameters: spectral width of 15495.86 Hz, data points of 64 K, 90° flip angle, relaxation delay of 10 s, acquisition time 2.11 s, 64 scans with 8 dummy scans, receiver gain 64.
Plasma samples were thawed at room temperature; aliquots of approximately 80–100 μL of plasma samples were diluted in 550 μL of D2O saline buffer, vortexed, centrifuged for 5 min at 10000 rpm. Plasma spectra were acquired with a 1D Carr–Purcell–Meiboom–Gill pulse sequence with water suppression. All other acquisition parameters were kept as mentioned earlier.
All spectral acquisition, processing, and quantification of the 1D spectra were performed using TOPSPIN 3.5 software. Characterization of the metabolites was carried out on the basis of chemical shift, coupling constant, and splitting patterns of metabolites as reported in the literature and in comparison with standard MR spectra of metabolites from the Biological Magnetic Resonance Bank 14 and two‐dimensional correlation spectroscopy and heteronuclear single quantum coherence nuclear magnetic resonance spectroscopy. Areas under peaks were integrated and normalized to the reference peak as well as to tissue weights or plasma volumes.
Heat maps and principal component analysis
Metabolic heat maps for brain and plasma metabolites were generated from quantitative analysis of high‐resolution 1D 1H MR spectral data of the aqueous‐phase metabolites using MATLAB software (MATLAB R2017b, MathWorks) to visualize the metabolic patterns. Because of the large dynamic range of metabolites, we normalized the highest intensity of each metabolite in each of the three groups to 100%. This normalization provided a dynamic range between 0% and 100%. The heat map represents average measurements from each group (control mouse brain and plasma control: n = 10, Panc1 mouse brain and plasma: n = 9, Pa04C mouse brain and plasma: n = 10). For the heat map displays of human plasma, samples from 15 PDAC patients with stable weight and 20 PDAC patients with weight loss were analysed.
To investigate changes in overall metabolic patterns between control, Panc1 tumour‐bearing mice, and Pa04C tumour‐bearing mice, principal component analysis (PCA) was performed on quantitative data derived from aqueous‐phase mouse brain metabolites. Using a Bruker AMIX software, the selective variable‐size binning method was used to quantify the non‐overlapping peaks of the 1H MR spectra and exclude the broad water resonance at 4.7 ppm. Integral peak areas were normalized to the reference trimethylsilylpropanoic acid peak and the tissue weight.
Unsupervised PCA was used to visualize changes in the overall metabolic pattern between the groups and the clustering of the three groups, because of the size of the data set. PCA was performed using quantitative variable size binning of spectral metabolic data. Loading plots are provided as positive or negative bar plots in the results. Univariate analysis was performed independently of PCA to highlight changes in individual metabolites.
Statistical analysis
Statistically significant differences were identified using Student's two‐sided t test with Bonferroni correction for multiple comparisons, and P values ≤0.05 were considered significant.
Results
Body and tumour weights in tumour‐bearing and control mice
Cachexia‐inducing Pa04C tumours induced dramatic weight loss compared with weight gains in the non‐cachetic Panc1 mice and control mice, despite the almost identical average final tumour weights of non‐cachectic Panc1 tumours (0.63 ± 0.21 g) and cachectic Pa04C tumours (0.62 ± 0.21 g).
Average initial body weights of normal control, Panc1, and Pa04C mice did not differ significantly (Figure 1A). At the end of the study, non‐tumour‐bearing control and non‐cachectic Panc1 tumour‐bearing mice, with one exception, gained weight, while cachectic Pa04C tumour‐bearing mice lost weight (Figure 1A). Despite the initial weights being comparable, the final control and Panc1 mouse weights were significantly greater than the final Pa04C mouse weights (Figure 1B). The final weights of control mice were significantly higher, and the final weights of Pa04C mice were significantly lower than their initial average weights. Panc1 mice gained weight, but the average final weight of Panc1 mice was not significantly different from their initial average weight (Figure 1A). As shown in Figure 1B, relative to the initial animal weights, in control mice, the percent weight changes ranged from 10% to 21.8% weight gains, eight of nine Panc1 mice had weight gains from 2.3% to 24%, but one exhibited a −2% weight loss, and Pa04C mice had weight losses in the −2.5% to −15% range.
Figure 1.
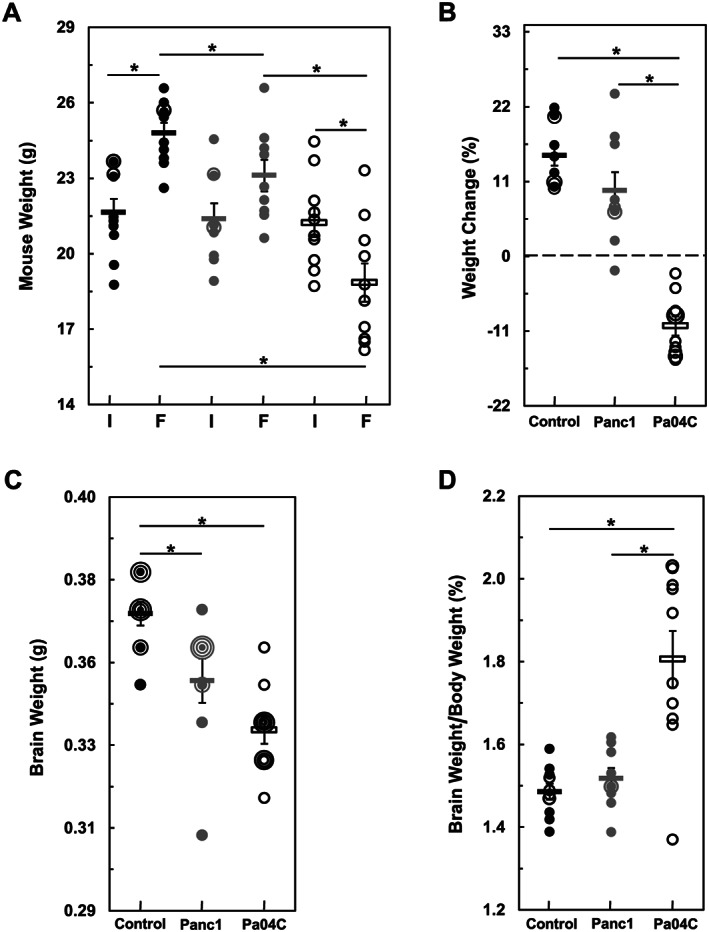
Body and brain weight changes in control mice as compared with tumour‐bearing mice. (A) Shows initial ‘I’ and final ‘F’ mouse weights, and (B) shows the weight change of each mouse relative to initial weights as percent gains or loses. (C) Shows individual brain weights, and (D) depicts brain weights as a percentage of final mouse weights. In all panels, means of cohorts are shown as rectangles and black symbols designate control mice (n = 10), grey symbols designate tumour‐bearing Panc1 mice (n = 9), and open symbols designate Pa04C mice (n = 10). In the cases of control and Panc1 mice, nearly identical or identical values are represented by black and grey overlapping open symbols respectively, i.e. in each cohort, several brain weights were identical, which generated concentric circular representations of brains at the same weight. Error bars designate standard error of the mean. *denotes statistical significance at P ≤ 0.05.
Brain weight changes
The average brain weights of tumour‐bearing mice were significantly less than control mice with the greatest decreases observed in brains from cachectic mice (Figure 1C). Panc1 and Pa04C brain weights were respectively, on average, ~5% and ~8.5% less‐than the average control brain weights. Brain weights from Pa04C mice tended to be lower than brain weights of Panc1 mice (P = 0.07). However, control and Panc1 brain weights as a percentage of overall body weights were comparable (on average 1.49% and 1.52%, respectively) and not significantly different (Figure 1D). Despite the larger decrease of brain weight in Pa04C mice, the profound body weight loss in these mice resulted in a significantly higher brain to body weight ratio compared with brains from control and Panc1 mice. On average, brain weights from Pa04C mice were 1.83% of mouse body weights (Figure 1D). No brain metastases were observed during the examination of sagittal sections of haematoxylin and eosin stained brain tissue from mice from either tumour‐bearing model (see Supporting Information, Figure S1).
1H magnetic resonance spectroscopic analysis and quantifications of brain metabolites
1H Magnetic resonance spectroscopic analyses of brain tissue were used to determine metabolic differences between the three groups. Representative 1H MR spectra of brains of aqueous‐phase metabolites obtained from Panc1, Pa04C, and control mice are shown in Figure 2, with low peak intensity spectral regions magnified above each spectrum, such as for the branched‐chain amino acids, N‐acetyl aspartate, fumarate, tyrosine, histidine, and phenylalanine. A heat map displaying the pattern of metabolic differences in the three groups, shown in Figure 3, provides an overview of the metabolic changes induced by Pa04C and Panc1 tumours.
Figure 2.
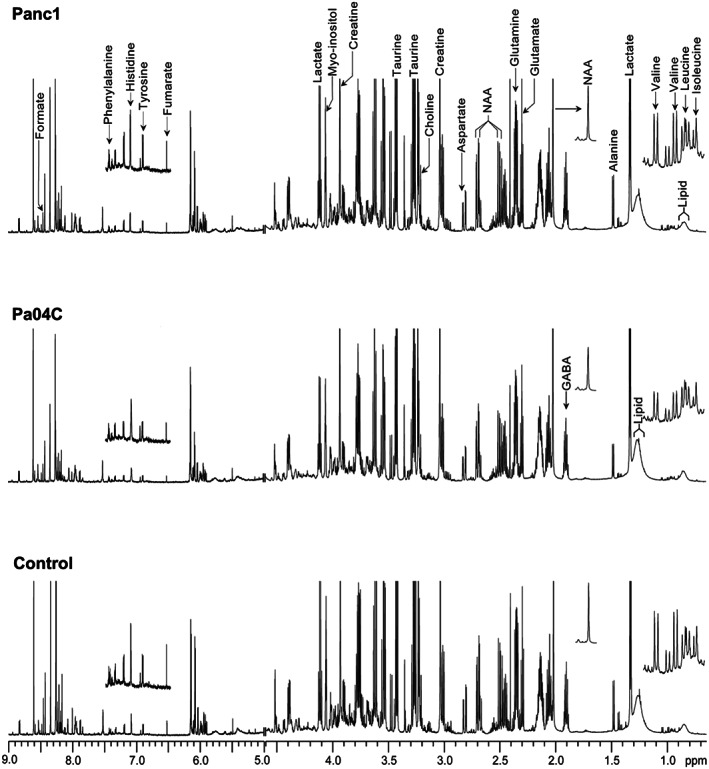
Representative 1H magnetic resonance spectra obtained from aqueous‐phase extracts of brain tissue harvested from non‐cachectic Panc1 (top spectrum) and cachetic Pa04C (middle spectrum) tumour‐bearing mice and control mice (bottom spectrum). Spectral regions, 0–1.3 ppm, ~2 ppm (NAA), and 6.5–7.5 ppm, were vertically magnified to better visualize the low intensity peaks in those regions. NAA, N‐acetylaspartate; GABA, γ‐aminobutyric acid.
Figure 3.
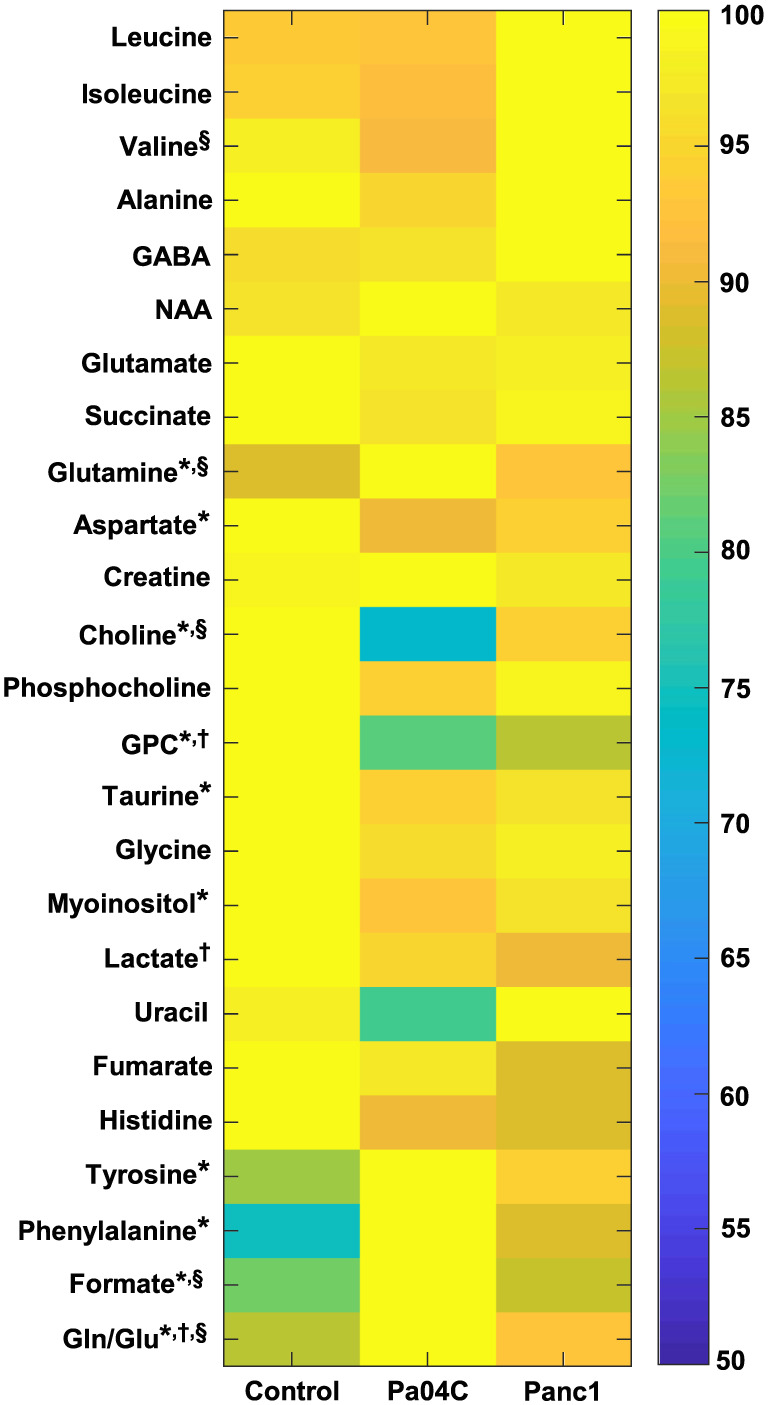
Metabolic heat map displaying differences in the metabolic profile of brain tissue in control (n = 10), Panc1 (n = 9), and Pa04C (n = 10) tumour‐bearing mice. Statistical significance was P ≤ 0.05 for: †Control vs. Panc1, *Control vs. Pa04C, and §Pa04C vs. Panc1. NAA, N‐acetylaspartate; GABA, γ‐aminobutyric acid.
As shown in Table 1, metabolites that differed significantly between the groups were valine, glutamine, aspartate, choline, glycerophosphocholine (GPC), taurine, myo‐inositol, lactate, uracil, tyrosine, phenylalanine, and formate. The total choline values, obtained by adding choline, phosphocholine (PC) and GPC, and the glutamine/glutamate (gln/glu) ratios were also significantly different. No significant differences were measured in the levels of the remaining evaluated metabolites including lipids identified in the lipid phase, γ‐aminobutyric acid, and N‐acetyl aspartate in the brains of all three groups of mice. Table 1 also shows the percent change in metabolites that were differentially expressed between groups. A substantial ~25% depletion of choline from Pa04C brains relative to brains from Panc1 and control mice was identified. Glutamine and formate increased an average of ~10% and ~18% in Pa04C mouse brains relative to both Panc1 mouse brains and control mouse brains, respectively, while accumulation of tyrosine and phenylalanine (19% and 34%, respectively) were found in Pa04C brains relative to control brains (Table 1). As shown in Table 1, the gln/glu ratios increased 16%, 7%, and 8% in the Pa04C vs. control, Panc1 vs. control, and Pa04C vs. Panc1 comparisons, respectively. In addition, changes in total choline (choline + phosphocholine + GPC) levels across groups resulted in significant decreases of −17%, −11%, and −7% in the Pa04C vs. control, Panc1 vs. control, and Pa04C vs. Panc1 comparisons, respectively.
Table 1.
Brain metabolites quantified by magnetic resonance imaging that significantly differed between groups, along with their associated magnitude of change, are in bold‐type and highlighted
| Metabolites |
ppm |
P value* | Percent change | ||||
|---|---|---|---|---|---|---|---|
| Control vs. Pa04C | Control vs. Panc1 | Pa04C vs. Panc1 | Pa04C vs. Control | Panc1 vs. Control | Pa04C vs. Panc1 | ||
| Leucine | 0.96 | 0.837 | 0.182 | 0.110 | −0.6 | 7.1 | −7.1 |
| Isoleucine | 0.99 | 0.481 | 0.276 | 0.076 | −3.0 | 6.4 | −8.9 |
| Valine | 1.01 | 0.099 | 0.614 | 0.042 | −7.1 | 2.7 | −9.5 |
| Alanine | 1.48 | 0.187 | 0.832 | 0.306 | −4.7 | −0.8 | −3.9 |
| GABA | 1.90 | 0.881 | 0.319 | 0.290 | 0.5 | 3.9 | −3.3 |
| NAA | 2.01 | 0.197 | 0.797 | 0.234 | 3.8 | 0.8 | 2.9 |
| Glutamate | 2.35 | 0.296 | 0.364 | 0.938 | −2.9 | −3.2 | 0.3 |
| Succinate | 2.40 | 0.617 | 0.595 | 0.887 | −3.2 | −3.9 | 0.8 |
| Glutamine | 2.46 | 0.002 | 0.197 | 0.027 | 12.5 | 3.4 | 8.8 |
| Aspartate | 2.79 | 0.003 | 0.117 | 0.293 | −9.7 | −5.3 | −4.6 |
| Creatine | 3.04 | 0.562 | 0.640 | 0.300 | 1.6 | −1.4 | 3.1 |
| Choline | 3.21 | 0.0002 | 0.334 | 0.003 | −26.6 | −6.6 | −21.4 |
| Phosphocholine | 3.22 | 0.060 | 0.879 | 0.143 | −6.1 | −0.6 | −5.5 |
| GPC | 3.24 | 0.0001 | 0.001 | 0.289 | −19.5 | −14.5 | −5.8 |
| Taurine | 3.43 | 0.054 | 0.242 | 0.527 | −5.6 | −3.8 | −1.9 |
| Glycine | 3.48 | 0.373 | 0.668 | 0.703 | −4.0 | −2.3 | −1.8 |
| Myo‐inositol | 4.06 | 0.022 | 0.281 | 0.266 | −7.2 | −3.6 | −3.7 |
| Lactate | 4.12 | 0.214 | 0.009 | 0.152 | −4.9 | −9.9 | 5.6 |
| Uracil | 5.81 | 0.206 | 0.994 | 0.044 | −19.0 | −0.1 | −18.9 |
| Fumarate | 6.51 | 0.908 | 0.723 | 0.670 | −2.9 | −9.3 | 7.0 |
| Histidine | 6.15 | 0.528 | 0.256 | 0.722 | −9.6 | −16.9 | 8.7 |
| Tyrosine | 6.90 | 0.053 | 0.213 | 0.498 | 18.5 | 12.4 | 5.4 |
| Phenylalanine | 7.43 | 0.0004 | 0.139 | 0.112 | 33.8 | 17.7 | 13.7 |
| Formate | 8.45 | 0.0002 | 0.322 | 0.005 | 21.0 | 5.9 | 14.2 |
| Total Cho | n.a. | 0.0001 | 0.0036 | 0.043 | −16.5 | −10.7 | −6.6 |
| Gln/Glu | n.a. | 0.0002 | 0.009 | 0.028 | 15.9 | 7.0 | 8.2 |
Two‐sided Student's t‐test. P ≤ 0.05 considered significant
GPC, glycerophosphocholine; Gln, glutamine; Glu, glutamate; n.a., not applicable; NAA, N‐acetyl aspartate; Total Cho, sum of choline + phosphocholine + GPC.
Quantitative metabolic data of the significant changes in metabolites are presented in Figure 4A and 4B. Significant metabolic differences between control mice, and Panc1 and Pa04C tumour‐bearing mice are termed ‘cancer brain metabolic signature’ (Figure 4A), and between Pa04C tumour‐bearing mice and control or Panc1 tumour‐bearing mice are termed ‘cachexia brain metabolic signature’ (Figure 4B). Relative to control mice, aspartate, taurine, and myo‐inositol were depleted while tyrosine and phenylalanine were increased in Pa04C cachectic brains (Figure 4A). GPC was depleted in the brains of both Panc1 and Pa04C mice, relative to controls (Figure 4A). Lactate decreased in Panc1 mouse brains relative to the brains of control mice (Figure 4A). Relative to control and non‐cachectic Panc1 mice, a depletion of choline and an increase of glutamine and formate were identified in the brains of weight losing Pa04C mice (Figure 4B).
Figure 4.
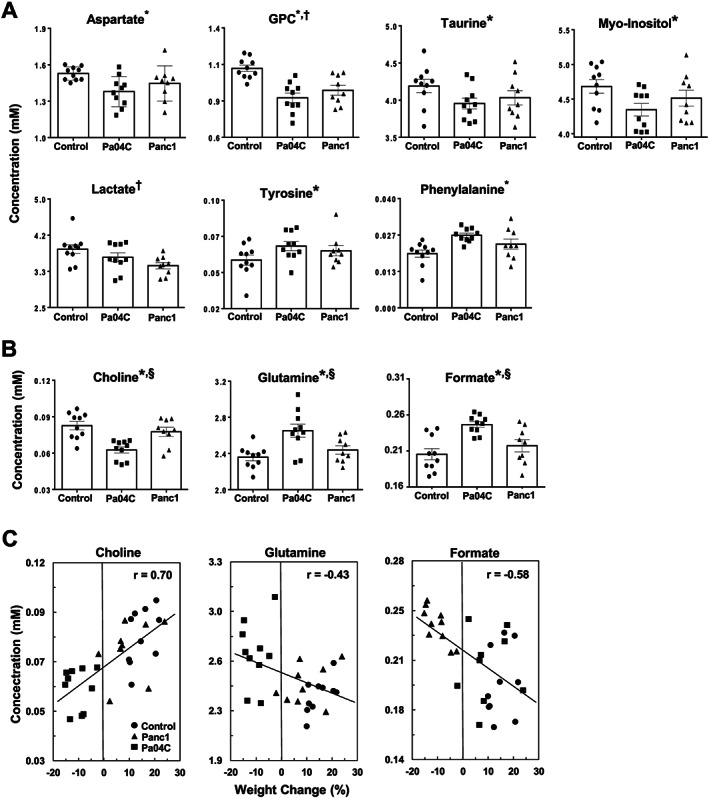
Quantitative analysis of metabolites obtained from brains of control mice (n = 10), and Panc1 (n = 9), and Pa04C (n = 10) tumour‐bearing mice. (A) Cancer brain metabolic signature, i.e. metabolites that were significantly different in either Pa04C mice or Panc1 mice or both groups compared with control mice. (B) Cachexia brain metabolic signature, i.e. metabolites that were significantly different in Pa04C mice when compared with the Panc1 and control groups. GPC, Glycerophosphocholine. (C) Linear regression analyses and associated Pearson correlation coefficients (r) with P values <0.05 for all three cases. In (A) and (B), values represent mean ± standard error of the mean. Statistical significance was P ≤ 0.05 for: †Control vs. Panc1, *Control vs. Pa04C, and §Pa04C vs. Panc1.
Linear regression analyses of metabolite levels in Figure 4B vs. percent weight change are shown in Figure 4C. Changes of brain choline were positively correlated to percent weight changes with Pearson's coefficients (r) of 0.70 (P = 0.0002) while formate (r = −0.58; P = 0.001) and glutamate (r = −0.43; P = 0.02) were negatively correlated to percent weight changes (Figure 4C). The strong to moderate correlations of brain choline, glutamine, and formate with percent weight changes support the data in Table 1 of these metabolites being likely candidates of a ‘cachexia brain metabolic signature’. Similar analyses shown in Figure S2 indicate moderate positive correlations between GPC (r = 0.62; P = 0.0004), aspartate (r = 0.54; P = 0.003), and myo‐inositol (r = 0.50; P = 0.005) levels with percent weight changes that indicate that these metabolites could also be included in a list of ‘cachexia brain metabolites’.
To better understand the metabolite changes exhibited in the tumour‐bearing brains, we analysed enzymes and transporters of choline and glutamine, as shown in Table S1 and Figure S3. As can be seen in Figure S3, the only change in this group of proteins was a slight decrease in the level of glutaminase‐2 in the brains of cachectic mice relative to normal and Panc1 tumour‐bearing mouse brains. Overall, there were no significant changes in the enzymes and transporters evaluated.
Principal component analysis
To evaluate whether each group (control, Panc1, and Pa04C) could be specifically defined by quantitative metabolic profiles, a PCA was carried out (Figure 5). Integrations of the areas of non‐overlapping aqueous‐phase metabolite resonances, from the 1H MRS spectra (Figure 5A: top of bar graph), were acquired from a variable‐size binning analysis with water resonance exclusion. The bar graphs of Figure 5A are visual representations of the loadings of the first three PCs (PC1, PC2, and PC3) generated from the PCA. The PC scores were used to generate a graphic representation of the score plots (Figure 5B). The plots reveal that the brain metabolite data from control mice, and Pa04C and Panc1 tumour‐bearing mice clearly separated into distinct differential clusters based on distinct metabolic signatures.
Figure 5.
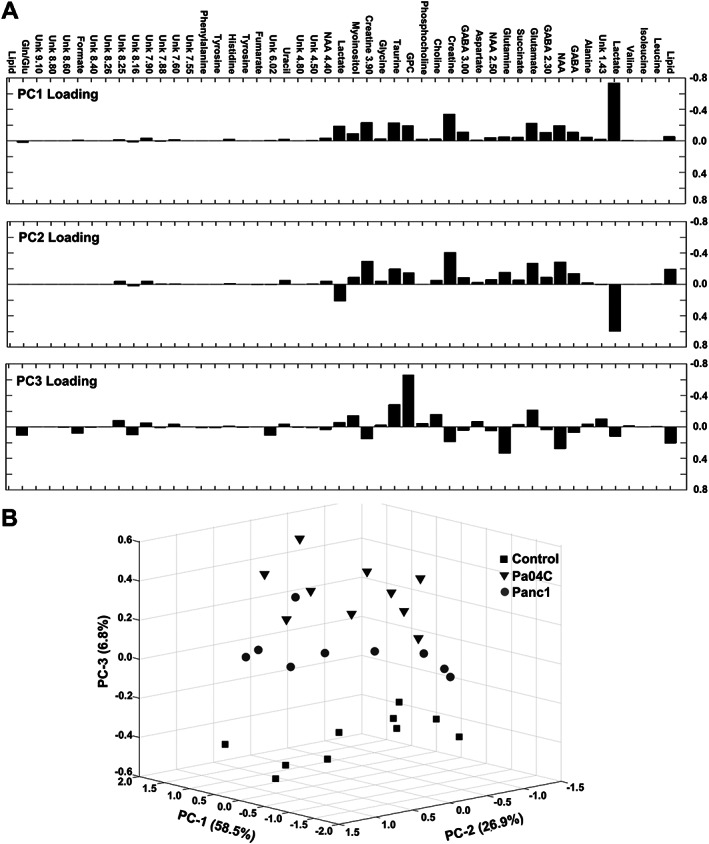
Score plots derived from principal component analysis (PCA) of the quantitative data from aqueous‐phase mouse brain metabolites. (A) Principal component loadings generated from PCA of the overall metabolic profiles acquired from 1H magnetic resonance spectra. (B) Three‐dimensional PCA representation of the quantitative data‐derived score plots of aqueous phase mouse brain extracts, showing differential clustering of each group: Control mice (squares), Pa04C mice (triangles), and Panc1 mice (circles). GABA, γ‐aminobutyric acid; GPC, glycerophosphocholine; Gln/Glu, glutamine/glutamate; NAA, N‐acetyl aspartate; Unk, unknown.
Plasma choline and metabolite concentrations
Because the brain receives choline from the blood, we next quantified the free choline concentration in plasma samples using a fluorimetric assay. Plasma choline concentrations from cachectic mice were significantly lower compared with non‐cachectic tumour‐bearing mice and control mice (Figure 6A, left). This significant decrease was also observed when the data from Panc1 and Pa04C mice were combined to represent all mice with PDAC (Figure 6A, right). In addition, a linear regression analysis (Figure S4) indicated a good correlation (r = 0.62; P = 0.0005) between plasma choline concentrations and percent weight change. To relate these findings to human plasma, we measured the plasma choline levels in a series of patients with pancreatic cancer and found these to have significantly lower plasma choline levels relative to normal pancreas control subjects as well as to patients with benign pancreatic disease. Unlike the mouse plasma data, in patients with PDAC, plasma choline levels were significantly lower irrespective of weight loss (Figure 6B, left). Plasma choline in PDAC patients was significantly lower compared to normal or benign pancreatic disease (Figure 6B, right). Although preliminary, these data indicate that choline deficiency in plasma may prove to be a minimally invasive plasma metabolic biomarker associated with PDAC.
Figure 6.
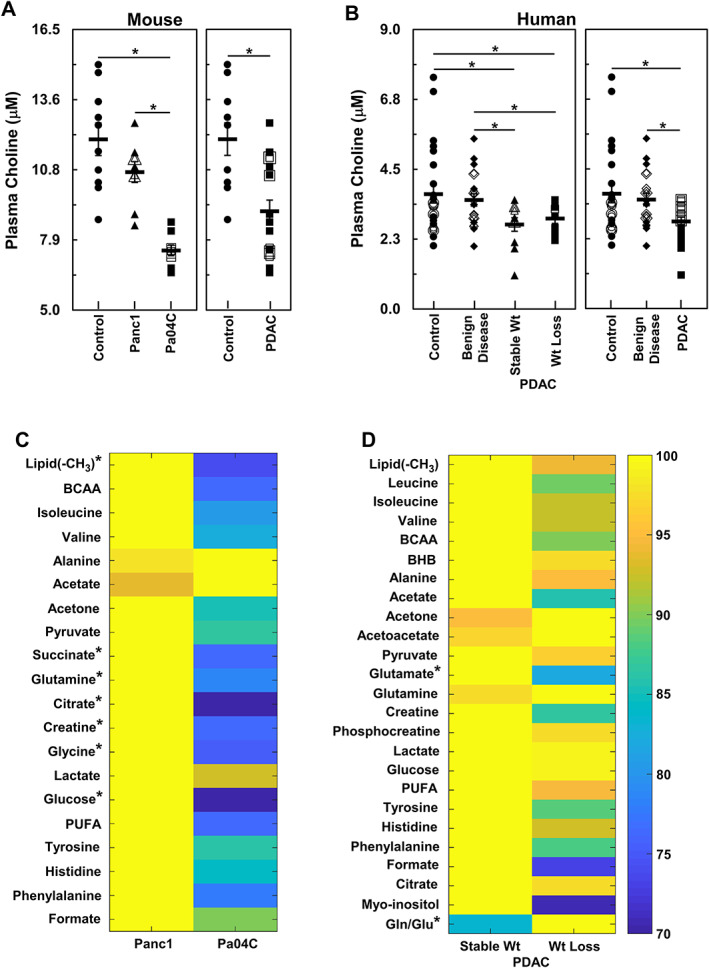
Comparisons of plasma metabolites between weight losing and weight stable groups of mouse and human subjects. (A) (left panel) shows comparisons between plasma choline concentrations from control mice (n = 10), non‐cachectic Panc1 tumour‐bearing (n = 9), and cachectic Pa04C tumour‐bearing (n = 9) mice while (right‐panel) shows comparison of plasma choline concentrations between control and combined Panc1 and Pa04C tumour‐bearing mice. Similarly, (B) (left panel) shows plasma choline concentration comparisons between healthy adult controls (n = 24), patients with benign disease (n = 20), weight stable (n = 11), and weight losing (n = 9) PDAC patients while (right panel) shows comparisons of plasma choline concentrations between healthy adult controls (n = 24), patients with benign disease (n = 20), and all PDAC patients (n = 20). In all cases, overlapping data points are shown with open symbols that generate concentric or semi‐concentric images of the symbols. Heat maps of plasma samples, (C) (mice, non‐cachectic Panc1 tumour‐bearing n = 9, and Pa04C tumour‐bearing n = 10 cachectic mice), and (D) (human, stable wt n = 15, wt loss n = 20), comparing differential levels of several 1H magnetic resonance spectroscopy identified plasma metabolites from subjects with stable weight to those with weight loss. *denotes P values ≤0.05. BCAA, branched‐chain amino acids; BHB, beta‐hydroxybutyric acid; gln/glu, glutamine/glutamate; PDAC, pancreatic ductal adenocarcinoma; PUFA, polyunsaturated fatty acids.
We also analysed plasma metabolite concentrations using 1H MRS (Figure 6C and 6D). Several metabolites were depleted in plasma from cachectic Pa04C mice compared with those in non‐cachectic Panc1 mice (Figure 6C). Plasma from Pa04C mice had lower levels of lipid, succinate, glutamine, citrate, creatine, glycine, and glucose relative to plasma from Panc1 mice. A similar analysis of human plasma samples (Figure 6D) from patients with PDAC revealed that plasma levels of glutamate and gln/glu ratios were significantly lower in patients who exhibited weight loss relative to those who maintained stable weights. Values of glutamine in mouse plasma and glutamate and gln/glu ratios in human plasma are also presented individually in Figure S5A and S5B, respectively.
Human brain spectroscopic imaging
To provide an example of non‐invasive imaging of brain metabolic signatures in humans to evaluate spatio‐temporal metabolic changes with cancer and cachexia, we performed 1H MR spectroscopic brain imaging in normal volunteers. As shown in Figure S6, several of the metabolites that were identified in our studies, such as total choline, myo‐inositol, and gln/glu, were detected non‐invasively in the human brain.
Discussion
Our studies identified changes in brain weight, and brain and plasma metabolites, highlighting, for the first time, the systemic effects of cancer and cancer‐induced cachexia on brain metabolism.
Cachexia‐inducing Pa04C tumours induced significant weight loss in mice, unlike the Panc1 tumours, compared with age‐matched control non‐tumour‐bearing mice. We have previously established that orthotopically or subcutaneously implanted Panc1 or Pa04C tumours exhibited metabolic profiles and weight patterns that were not implantation site dependent. 14 , 16 In the present study, brains of tumour‐bearing mice weighed less than the brains of control mice, with cachectic mice showing on average a greater decrease of brain weight. However, when normalized to total body weight, the brains of cachectic mice were significantly higher in terms of percent body weight. This may have occurred as a response to preserve brain function during cachexia. In humans, malnutrition has been observed to affect brain structure and function at several levels. 17 Studies with T1 and/or T2* MRI as well as diffusion‐weighted MRI have demonstrated that adult patients with untreated or newly diagnosed non‐CNS cancers can suffer from deficits in brain structure, such as reduced grey matter volumes, diminished white matter microstructural integrity, and brain neural network alterations. 4 , 10 Such imaging along with fMRI have linked anatomical structural changes to cognitive deficits, depression, memory disorders, and fatigue. 4 , 12 fMRI, in association with blood oxygen level‐dependent intensities, detected lower hypothalamic activity in anorectic lung cancer patients. 6 Non‐invasive MRI characterizing brain structure and volume in PDAC patients with or without cachexia may expand our understanding of the brain weight change observed here and its relationship to the changes in brain metabolism.
The three metabolites in the brains of Pa04C mice that were significantly different from comparable levels in control and Panc1 mouse brains were glutamine, formate, and choline. Glutamine and formate increased, while choline decreased. These metabolites were therefore included in the ‘cachexia brain metabolic signature’, although expanded mouse and human studies are required to confirm the role of these metabolites in cachexia.
The relative depletion of choline and choline compounds from cachectic brains indicates compromised brain function, as choline is necessary in several metabolic pathways. 18 , 19 , 20 Choline is an essential nutrient 21 utilized for the synthesis of the neurotransmitter acetylcholine (cholinergic activity) and membrane lipids, such as phosphatidylcholine and sphingomyelin that are necessary for cellular integrity and maintenance of efficient mitochondrial oxidative phosphorylation. Choline is also needed for one‐carbon (methyl‐group) metabolism required for the epigenetic modulation of gene expression/genomic stability and several other methyl‐group transfer reactions 22 and is an intracellular messenger (agonist), signalling through brain abundant sigma‐1 receptors that are involved in cholinergic transmissions. 23 In the context of cancer‐cachexia, cholinergic signalling is involved with modulating inflammation and appetite in the basal forebrain and hypothalamus. 24 CNS cholinergic signalling senses peripheral inflammation and modulates immune responses in the spleen through T‐cell interactions, greatly contributing to the control of peripheral inflammation. 25 , 26 , 27 Loss of choline and GPC, along with a trend of phosphocholine depletion in brains of cachectic mice, likely reflects the need for choline in the multiple pathways listed previously. Under conditions of choline depletion in the plasma, the only source of choline in the brain would be from lipid stores through breakdown of GPC, and diversion from phosphocholine membrane synthesis. Overall, the loss of choline in cachectic brains may result in an attenuation of cholinergic signalling and associated loss of anti‐inflammation signalling, and possible disruptions in gene expression/genomic stability due to loss of methyl‐group transfer capacity that would affect a large number of metabolic pathways. 28 , 29
A gln/glu cycle between neurons and astrocytes that tightly regulates the level of glutamate is necessary for normal brain function as glutamate is an excitatory neurotransmitter and accumulation of glutamate will produce excitatory toxicity. 30 The elevated amounts of glutamine in cachectic brains observed here may be partly due to the necessity of keeping glutamate levels from fluctuating or increasing. However, glutamine is also a sink for toxic NH4 + and its increase in cachectic brains may reflect systemic hyperammonemia 30 , 31 due to compromised liver function, or increased peripheral protein and amino acid metabolism from muscle as well as the tumour, 32 or local increases in the catabolism of amino acids. The possibility of hyperammonemia is supported by the simultaneous accumulations of tyrosine and phenylalanine in cachectic brains as these amino acids are transported into the brain in exchange of the export of accumulating glutamine. 30 , 33 Under such a condition, as glutamine accumulates, it would be transported out of the brain as a carrier of ammonia to detoxification in the liver. Further support of hyperammonemia arises from the depletion of aspartate from cachectic brains as this amino acid is involved in two aspartate aminotransferase‐mediated transamination reactions of the glutamine/glutamate cycle and has been shown to decrease during NH4 + exposure to astrocytes, i.e. the site of glutamine production from glutamate. 30 Moreover, healthy skeletal muscle is important and likely second only to liver in maintaining ammonia homeostasis. 34 , 35 Loss of muscle mass that is associated with late‐stage liver disease worsens hyperammonemia, 34 , 35 which is consistent with the cachectic brains exhibiting a metabolic signature similar to patients with hepatic encephalopathy. 36 A possible reason for elevated glutamine and the doubling of the gln/glu ratio in cachectic brains may also be due to an increase in glutaminergic (excitatory) brain activity in response to the stresses of inflammation and cachexia. 37
The increase in formate in cachectic brains might indicate, along with choline depletion, perturbation of one‐carbon metabolism. 38 , 39 High rates of formate synthesis have been associated with active mitochondrial oxidative phosphorylation and supplemental adenosine triphosphate generation. 40 Elevated formate in cachectic brains may indicate excessive energy consumption/usage or an adaptation to cachexia driven hypoglycaemia or insulin resistance. Co‐factors in one‐carbon metabolism have been shown to be depleted in aging adults with sarcopenia. 41 A blunting of one‐carbon metabolism may partly explain formate accumulation in cachectic brains.
Metabolic changes were also identified in mouse and human plasma. The significant decrease of choline observed in the plasma of Pa04C mice may be one cause for the decrease of brain choline in Pa04C mice. Because Pa04C tumours are less choline avid compared with Panc1 tumours, 16 the decrease of plasma choline was not due to depletion by the Pa04C tumour but mostly likely due to systemic metabolic alterations, potentially in the liver, because choline is generally supplied in the blood as free and lipid‐incorporated choline from the liver. Human plasma choline levels were significantly lower compared with those in normal subjects and with those in patients with benign pancreatic disease. These results are consistent with a previous mass spectrometry plasma study that identified choline as one of a cluster of five metabolic predictors of PDAC detected using logistic regression and receiver operating characteristic curve analysis. 42 The significant decrease of quantitative plasma choline values with PDAC observed in our studies suggests that it may be useful as a companion diagnostic to detect PDAC.
With 1H MRS, we detected isoleucine and valine in the plasma of mice and humans but did not observe a significant difference between PDAC with or without weight loss. An increase of the branched‐chain amino acids isoleucine, leucine, and valine in the plasma has been associated with a greater than two‐fold risk in developing PDAC. 43 Our study was focused on identifying changes in plasma metabolites associated with PDAC cachexia.
In mouse plasma, we observed a significant decrease of succinate, glutamine, citrate, creatine, glycine and glucose in Pa04C mice. Unlike choline, where brain and plasma choline significantly decreased, with glutamine, brain glutamine increased despite plasma glutamine decreasing. In human plasma, we observed a significant decrease of glutamate and a significant increase of the gln/glu ratio with weight loss.
The ‘cancer brain metabolic signature’ was primarily characterized by changes in lactate and GPC because lactate decreased significantly in Panc1 brains compared with control brains , and GPC decreased significantly in the brains of both Panc1 and Pa04C mice, yet Panc1 tumours did not induce weight loss. Choline depletion in the plasma would have necessitated the breakdown of GPC to obtain choline. Pa04C tumours also induced a decrease of brain aspartate, myo‐inositol, and taurine and an increase of phenylalanine, tyrosine, and taurine compared with control brains, but because these metabolite levels were not significantly different from Panc1 tumours, these were included in the ‘cancer brain metabolic signature’. It is possible, however, that other than lactate and GPC, the metabolic changes that occurred only in the brains of Pa04C mice were characteristics of the cachectic brain.
Our data clearly identified the adverse effects of pancreatic cancer‐induced cachexia on brain weight and metabolism, including changes in metabolites of the choline/cholinergic and glutamine/glutamate/glutamatergic neurotransmitter pathways. Additionally, changes in some brain metabolites were also observed in mice with pancreatic cancers that did not induce cachexia, highlighting the scale of systemic metabolic changes that can be induced by cancers. A significant decrease of plasma choline was associated with PDAC in mouse and human plasma. A significant decrease of glutamate and a significant increase of the gln/glu ratio in human plasma was associated with PDAC weight loss. These plasma changes may lead to the development of plasma metabolic markers to detect PDAC and PDAC‐induced cachexia.
Our data support investigating nutraceutical therapies such as the repletion of choline levels to re‐establish one‐carbon homeostasis. 44 , 45 , 46 Treating choline and gln/glu imbalances could potentially reverse deficits in memory and cognitive functions. 45 , 47 In PDAC patients, where maldigestion due to a lack of pancreatic enzymes 1 is often a contributing factor to the syndrome, a combination of nutritional and metabolic interventions may be needed. Applications of non‐invasive metabolic and functional imaging to identify spatial and temporal changes in the CNS in humans will further expand our understanding of the impact of cachexia and cancer on the CNS and the response of the CNS to metabolic interventions.
Conflict of interest
The authors have no potential conflicts of interest to disclose.
Funding
This work was supported by National Institutes of Health R35 CA209960, R01 CA193365, R01 CA82337, and U01 CA210170.
Supporting information
Data S1. Supporting information
Data S2. Supporting information
Acknowledgements
We thank Mr Gary Cromwell for tumour inoculations and Ms Flonne Wildes for her assistance with the studies. The authors certify that they comply with the ethical guidelines for publishing in the Journal of Cachexia, Sarcopenia and Muscle: update 2019. 48
Winnard P. T. Jr, Bharti S. K., Sharma R. K., Krishnamachary B., Mironchik Y., Penet M.‐F., Goggins M. G., Maitra A., Kamel I., Horton K. M., Jacobs M. A., and Bhujwalla Z. M. (2020) Brain metabolites in cholinergic and glutamatergic pathways are altered by pancreatic cancer cachexia, Journal of Cachexia, Sarcopenia and Muscle, 11, 1487–1500, 10.1002/jcsm.12621
Paul T. Winnard Jr and Santosh Kumar Bharti contributed equally to this work.
References
- 1. Kays JK, Shahda S, Stanley M, Bell TM, O'Neill BH, Kohli MD, et al. Three cachexia phenotypes and the impact of fat‐only loss on survival in FOLFIRINOX therapy for pancreatic cancer. J Cachexia Sarcopenia Muscle 2018;9:673–684. [DOI] [PMC free article] [PubMed] [Google Scholar]
- 2. Porporato PE. Understanding cachexia as a cancer metabolism syndrome. Oncogenesis 2016;5:e200. [DOI] [PMC free article] [PubMed] [Google Scholar]
- 3. Burfeind KG, Zhu X, Levasseur PR, Michaelis KA, Norgard MA, Marks DL. TRIF is a key inflammatory mediator of acute sickness behavior and cancer cachexia. Brain Behav Immun 2018;73:364–374. [DOI] [PMC free article] [PubMed] [Google Scholar]
- 4. Amidi A, Wu LM. Structural brain alterations following adult non‐CNS cancers: a systematic review of the neuroimaging literature. Acta Oncol 2019;58:522–536. [DOI] [PMC free article] [PubMed] [Google Scholar]
- 5. Chance WT, van Lammeren FM, Fischer JE. Feeding elicited by cholinergic and adrenergic hypothalamic stimulation of anorectic tumor‐bearing rats. Pharmacol Biochem Behav 1988;31:209–213. [DOI] [PubMed] [Google Scholar]
- 6. Molfino A, Logorelli F, Citro G, Bertini G, Ramaccini C, Bollea MR, et al. Stimulation of the nicotine antiinflammatory pathway improves food intake and body composition in tumor‐bearing rats. Nutr Cancer 2011;63:295–299. [DOI] [PubMed] [Google Scholar]
- 7. Carson LF, Roy S, Cain K, Charboneau R, DeTurris S, Ramakrishin S, et al. The central response to ovarian carcinoma simulates the response to sepsis. J Surg Res 1998;75:97–102. [DOI] [PubMed] [Google Scholar]
- 8. Freitas JJ, Pompeia C, Miyasaka CK, Curi R. Walker‐256 tumor growth causes oxidative stress in rat brain. J Neurochem 2001;77:655–663. [DOI] [PubMed] [Google Scholar]
- 9. Coma M, Vicente R, Busquets S, Carbo N, Tamkun MM, Lopez‐Soriano FJ, et al. Impaired voltage‐gated K+ channel expression in brain during experimental cancer cachexia. FEBS Lett 2003;536:45–50. [DOI] [PubMed] [Google Scholar]
- 10. Kesler SR, Adams M, Packer M, Rao V, Henneghan AM, Blayney DW, et al. Disrupted brain network functional dynamics and hyper‐correlation of structural and functional connectome topology in patients with breast cancer prior to treatment. Brain Behav 2017;7:e00643. [DOI] [PMC free article] [PubMed] [Google Scholar]
- 11. Menning S, de Ruiter MB, Veltman DJ, Koppelmans V, Kirschbaum C, Boogerd W, et al. Multimodal MRI and cognitive function in patients with breast cancer prior to adjuvant treatment—the role of fatigue. Neuroimage Clin 2015;7:547–554. [DOI] [PMC free article] [PubMed] [Google Scholar]
- 12. Scherling C, Collins B, Mackenzie J, Bielajew C, Smith A. Pre‐chemotherapy differences in visuospatial working memory in breast cancer patients compared to controls: an FMRI study. Front Hum Neurosci 2011;5:122. [DOI] [PMC free article] [PubMed] [Google Scholar]
- 13. Gehman KE, Inculet RI, Brauer M, Marsh GD, Driedger AA, Thompson RT. Early detection of cancer cachexia in the rat using 31P magnetic resonance spectroscopy of the liver and a fructose stress test. NMR Biomed 1996;9:271–275. [DOI] [PubMed] [Google Scholar]
- 14. Winnard PT Jr, Bharti SK, Penet MF, Marik R, Mironchik Y, Wildes F, et al. Detection of pancreatic cancer‐induced cachexia using a fluorescent myoblast reporter system and analysis of metabolite abundance. Cancer Res 2016;76:1441–1450. [DOI] [PMC free article] [PubMed] [Google Scholar]
- 15. Zhang H, Cui L, Liu W, Wang Z, Ye Y, Li X, et al. 1H NMR metabolic profiling of gastric cancer patients with lymph node metastasis. Metabolomics 2018;14:47. [DOI] [PMC free article] [PubMed] [Google Scholar]
- 16. Penet MF, Shah T, Bharti S, Krishnamachary B, Artemov D, Mironchik Y, et al. Metabolic imaging of pancreatic ductal adenocarcinoma detects altered choline metabolism. Clin Cancer Res 2015;21:386–395. [DOI] [PMC free article] [PubMed] [Google Scholar]
- 17. Lukas WD, Campbell BC. Evolutionary and ecological aspects of early brain malnutrition in humans. Hum Nat 2000;11:1–26. [DOI] [PubMed] [Google Scholar]
- 18. Blusztajn JK, Slack BE, Mellott TJ. Neuroprotective actions of dietary choline. Nutrients 2017;9. [DOI] [PMC free article] [PubMed] [Google Scholar]
- 19. Liapi C, Kyriakaki A, Zarros A, Galanopoulou P, Al‐Humadi H, Dontas I, et al. Choline‐deprivation alters crucial brain enzyme activities in a rat model of diabetic encephalopathy. Metab Brain Dis 2010;25:269–276. [DOI] [PubMed] [Google Scholar]
- 20. Tayebati SK, Amenta F. Choline‐containing phospholipids: relevance to brain functional pathways. Clin Chem Lab Med 2013;51:513–521. [DOI] [PubMed] [Google Scholar]
- 21. Wallace TC, Blusztajn JK, Caudill MA, Klatt KC, Natker E, Zeisel SH, et al. Choline: the underconsumed and underappreciated essential nutrient. Nutr Today 2018;53:240–253. [DOI] [PMC free article] [PubMed] [Google Scholar]
- 22. Zeisel SH. Dietary choline deficiency causes DNA strand breaks and alters epigenetic marks on DNA and histones. Mutat Res 2012;733:34–38. [DOI] [PMC free article] [PubMed] [Google Scholar]
- 23. Brailoiu E, Chakraborty S, Brailoiu GC, Zhao P, Barr JL, Ilies MA, et al. Choline is an intracellular messenger linking extracellular stimuli to IP3‐evoked Ca(2+) signals through sigma‐1 receptors. Cell Rep 2019;26:330–337, e4. [DOI] [PMC free article] [PubMed] [Google Scholar]
- 24. Herman AM, Ortiz‐Guzman J, Kochukov M, Herman I, Quast KB, Patel JM, et al. A cholinergic basal forebrain feeding circuit modulates appetite suppression. Nature 2016;538:253–256. [DOI] [PMC free article] [PubMed] [Google Scholar]
- 25. Lehner KR, Silverman HA, Addorisio ME, Roy A, Al‐Onaizi MA, Levine Y, et al. Forebrain cholinergic signaling regulates innate immune responses and inflammation. Front Immunol 2019;10:585. [DOI] [PMC free article] [PubMed] [Google Scholar]
- 26. Olofsson PS, Rosas‐Ballina M, Levine YA, Tracey KJ. Rethinking inflammation: neural circuits in the regulation of immunity. Immunol Rev 2012;248:188–204. [DOI] [PMC free article] [PubMed] [Google Scholar]
- 27. Rosas‐Ballina M, Tracey KJ. Cholinergic control of inflammation. J Intern Med 2009;265:663–679. [DOI] [PMC free article] [PubMed] [Google Scholar]
- 28. Javelot H, Messaoudi M, Jacquelin C, Bisson JF, Rozan P, Nejdi A, et al. Behavioral and neurochemical effects of dietary methyl donor deficiency combined with unpredictable chronic mild stress in rats. Behav Brain Res 2014;261:8–16. [DOI] [PubMed] [Google Scholar]
- 29. Niculescu MD, Zeisel SH. Diet, methyl donors and DNA methylation: interactions between dietary folate, methionine and choline. J Nutr 2002;132:2333S–2335S. [DOI] [PubMed] [Google Scholar]
- 30. Hertz L, Rothman DL. Glutamine‐glutamate cycle flux is similar in cultured astrocytes and brain and both glutamate production and oxidation are mainly catalyzed by aspartate aminotransferase. Biology (Basel) 2017;6. [DOI] [PMC free article] [PubMed] [Google Scholar]
- 31. James JH, Ziparo V, Jeppsson B, Fischer JE. Hyperammonaemia, plasma aminoacid imbalance, and blood‐brain aminoacid transport: a unified theory of portal‐systemic encephalopathy. Lancet 1979;2:772–775. [DOI] [PubMed] [Google Scholar]
- 32. Holm E, Hagmuller E, Staedt U, Schlickeiser G, Gunther HJ, Leweling H, et al. Substrate balances across colonic carcinomas in humans. Cancer Res 1995;55:1373–1378. [PubMed] [Google Scholar]
- 33. Cangiano C, Cardelli‐Cangiano P, James JH, Rossi‐Fanelli F, Patrizi MA, Brackett KA, et al. Brain microvessels take up large neutral amino acids in exchange for glutamine. Cooperative role of Na+−dependent and Na+−independent systems. J Biol Chem 1983;258:8949–8954. [PubMed] [Google Scholar]
- 34. Butterworth RF. L‐Ornithine L‐aspartate for the treatment of sarcopenia in chronic liver disease: the taming of a vicious cycle. Can J Gastroenterol Hepatol 2019;2019: 8182195. [DOI] [PMC free article] [PubMed] [Google Scholar]
- 35. Lockwood AH, McDonald JM, Reiman RE, Gelbard AS, Laughlin JS, Duffy TE, et al. The dynamics of ammonia metabolism in man. Effects of liver disease and hyperammonemia. J Clin Invest 1979;63:449–460. [DOI] [PMC free article] [PubMed] [Google Scholar]
- 36. Haussinger D, Laubenberger J, Vom Dahl S, Ernst T, Bayer S, Langer M, et al. Proton magnetic resonance spectroscopy studies on human brain myo‐inositol in hypo‐osmolarity and hepatic encephalopathy. Gastroenterology 1994;107:1475–1480. [DOI] [PubMed] [Google Scholar]
- 37. Hall MH, Jensen JE, Du F, Smoller JW, O'Connor L, Spencer KM, et al. Frontal P3 event‐related potential is related to brain glutamine/glutamate ratio measured in vivo. Neuroimage 2015;111:186–191. [DOI] [PMC free article] [PubMed] [Google Scholar]
- 38. Lamarre SG, Morrow G, Macmillan L, Brosnan ME, Brosnan JT. Formate: an essential metabolite, a biomarker, or more? Clin Chem Lab Med 2013;51:571–578. [DOI] [PubMed] [Google Scholar]
- 39. Sengelov H, Hansen OP, Simonsen L, Bulow J, Nielsen OJ, Ovesen L. Inter‐relationships between single carbon units' metabolism and resting energy expenditure in weight‐losing patients with small cell lung cancer. Effects of methionine supply and chemotherapy. Eur J Cancer 1994;30A:1616–1620. [DOI] [PubMed] [Google Scholar]
- 40. Meiser J, Tumanov S, Maddocks O, Labuschagne CF, Athineos D, Van Den Broek N, et al. Serine one‐carbon catabolism with formate overflow. Sci Adv 2016;2:e1601273. [DOI] [PMC free article] [PubMed] [Google Scholar]
- 41. Ates Bulut E, Soysal P, Aydin AE, Dokuzlar O, Kocyigit SE, Isik AT. Vitamin B12 deficiency might be related to sarcopenia in older adults. Exp Gerontol 2017;95:136–140. [DOI] [PubMed] [Google Scholar]
- 42. Xie G, Lu L, Qiu Y, Ni Q, Zhang W, Gao YT, et al. Plasma metabolite biomarkers for the detection of pancreatic cancer. J Proteome Res 2015;14:1195–1202. [DOI] [PMC free article] [PubMed] [Google Scholar]
- 43. Mayers JR, Wu C, Clish CB, Kraft P, Torrence ME, Fiske BP, et al. Elevation of circulating branched‐chain amino acids is an early event in human pancreatic adenocarcinoma development. Nat Med 2014;20:1193–1198. [DOI] [PMC free article] [PubMed] [Google Scholar]
- 44. Adibhatla RM, Hatcher JF. Cytidine 5′‐diphosphocholine (CDP‐choline) in stroke and other CNS disorders. Neurochem Res 2005;30:15–23. [DOI] [PMC free article] [PubMed] [Google Scholar]
- 45. Jadavji NM, Emmerson JT, MacFarlane AJ, Willmore WG, Smith PD. B‐vitamin and choline supplementation increases neuroplasticity and recovery after stroke. Neurobiol Dis 2017;103:89–100. [DOI] [PubMed] [Google Scholar]
- 46. Ulus IH, Wurtman RJ, Mauron C, Blusztajn JK. Choline increases acetylcholine release and protects against the stimulation‐induced decrease in phosphatide levels within membranes of rat corpus striatum. Brain Res 1989;484:217–227. [DOI] [PubMed] [Google Scholar]
- 47. Maurer SV, Williams CL. The cholinergic system modulates memory and hippocampal plasticity via its interactions with non‐neuronal cells. Front Immunol 2017;8:1489. [DOI] [PMC free article] [PubMed] [Google Scholar]
- 48. von Haehling S, Morley JE, Coats AJS, Anker SD. Ethical guidelines for publishing in the Journal of Cachexia, Sarcopenia and Muscle: update 2019. J Cachexia Sarcopenia Muscle 2019;10:1143–1145. [DOI] [PMC free article] [PubMed] [Google Scholar]
Associated Data
This section collects any data citations, data availability statements, or supplementary materials included in this article.
Supplementary Materials
Data S1. Supporting information
Data S2. Supporting information