

Abstract
Background
Cancer is associated with muscle atrophy (cancer cachexia) that is linked to up to 40% of cancer‐related deaths. Oxidative stress is a critical player in the induction and progression of age‐related loss of muscle mass and weakness (sarcopenia); however, the role of oxidative stress in cancer cachexia has not been defined. The purpose of this study was to examine if elevated oxidative stress exacerbates cancer cachexia.
Methods
Cu/Zn superoxide dismutase knockout (Sod1KO) mice were used as an established mouse model of elevated oxidative stress. Cancer cachexia was induced by injection of one million Lewis lung carcinoma (LLC) cells or phosphate‐buffered saline (saline) into the hind flank of female wild‐type mice or Sod1KO mice at approximately 4 months of age. The tumour developed for 3 weeks. Muscle mass, contractile function, neuromuscular junction (NMJ) fragmentation, metabolic proteins, mitochondrial function, and motor neuron function were measured in wild‐type and Sod1KO saline and tumour‐bearing mice. Data were analysed by two‐way ANOVA with Tukey–Kramer post hoc test when significant F ratios were determined and α was set at 0.05. Unless otherwise noted, results in abstract are mean ±SEM.
Results
Muscle mass and cross‐sectional area were significantly reduced, in tumour‐bearing mice. Metabolic enzymes were dysregulated in Sod1KO mice and cancer exacerbated this phenotype. NMJ fragmentation was exacerbated in tumour‐bearing Sod1KO mice. Myofibrillar protein degradation increased in tumour‐bearing wild‐type mice (wild‐type saline, 0.00847 ± 0.00205; wildtype LLC, 0.0211 ± 0.00184) and tumour‐bearing Sod1KO mice (Sod1KO saline, 0.0180 ± 0.00118; Sod1KO LLC, 0.0490 ± 0.00132). Muscle mitochondrial oxygen consumption was reduced in tumour‐bearing mice compared with saline‐injected wild‐type mice. Mitochondrial protein degradation increased in tumour‐bearing wild‐type mice (wild‐type saline, 0.0204 ± 0.00159; wild‐type LLC, 0.167 ± 0.00157) and tumour‐bearing Sod1KO mice (Sod1KO saline, 0.0231 ± 0.00108; Sod1 KO LLC, 0.0645 ± 0.000631). Sciatic nerve conduction velocity was decreased in tumour‐bearing wild‐type mice (wild‐type saline, 38.2 ± 0.861; wild‐type LLC, 28.8 ± 0.772). Three out of eleven of the tumour‐bearing Sod1KO mice did not survive the 3‐week period following tumour implantation.
Conclusions
Oxidative stress does not exacerbate cancer‐induced muscle loss; however, cancer cachexia may accelerate NMJ disruption.
Keywords: Reactive oxygen species (ROS), CuZn superoxide dismutase knockout mice (Sod1KO), Lewis lung carcinoma cells (LLC), Lung cancer, Oxidative stress
Introduction
Cancer cachexia is a muscle wasting syndrome defined by a loss of skeletal muscle mass that cannot be treated by nutritional therapies. 1 , 2 Cachexia occurs in up to 80% of cancer cases and is directly attributable for up to 40% of cancer‐related deaths. 1 , 2 , 3 Current therapies to treat cancer cachexia are lacking; therefore, a critical need remains to understand the underlying mechanisms of cancer‐induced muscle wasting in order to develop an effective therapeutic strategy. In many cases, cancer cachexia develops in association with pre‐existing age‐related loss of muscle mass and function (i.e. sarcopenia). 4 , 5 , 6 Oxidative stress is a key driver of sarcopenia and muscle dysfunction 7 , 8 , 9 ; however, the role oxidative stress plays in cancer‐induced muscle loss is understudied.
Oxidative stress is an imbalance between the production of free radicals and the ability to neutralize these oxidizing molecules. Skeletal muscle reactive oxygen species (ROS) such as superoxide and its derivatives accumulate and damage macromolecules when they chronically exceed the reducing capacity of the cell. Damaged proteins induce an increase in activation of protein breakdown signalling, promoting muscle loss. 10 , 11 Tissues possess scavenging antioxidant enzymes that act to neutralize radicals and prevent oxidative stress‐mediated tissue dysfunction. 12 However, scavenging enzymes are dysregulated in many disease conditions, 13 , 14 leading to oxidative stress. Both the content and the activity of many of these scavenger enzymes (including CuZnSOD) are disrupted in muscle from mice with cancer 15 ; however, it is not known if loss of free radical scavenging potential contributes to muscle loss. CuZnSOD is a primarily cytosolic enzyme that acts to detoxify superoxide anion, a damaging reactive molecule formed from the reaction of electrons with oxygen. The Cu/Zn superoxide dismutase knockout (Sod1KO) mouse is a model that exhibits high levels of oxidative stress and damage due to loss of superoxide scavenging capacity and recapitulates the pathologies that occur in sarcopenia in an accelerated time frame. Specifically, Sod1KO mice show a significant loss of muscle innervation, muscle mass, and function. 9 , 16 The role of oxidative stress in promoting cancer cachexia is understudied; therefore, it is not known if oxidative stress exacerbates cancer cachexia or cancer mortality.
Mitochondria are a primary site for ROS production in skeletal muscle. 17 Both cancer and oxidative stress impair mitochondrial quality and function, which leads to excess production of ROS. 18 , 19 , 20 The accumulation of ROS contributes to skeletal muscle atrophy in many disease phenotypes 11 , 21 , 22 , 23 , 24 , 25 , 26 via the induction of atrophy programming. 11 , 21 , 22 , 23 , 24 , 25 , 26 Considering the role ROS has in promoting muscle wasting, and the noted loss of antioxidant activity and content in cachectic muscle and aged muscle, 15 , 27 there is a critical need to explore cancer‐induced muscle wasting in sarcopenic mice with high levels of oxidative stress.
To our knowledge, the role of cancer‐induced motor neuron dysfunction has not been explored and could be a key contributor to loss of muscle mass. Oxidative stress contributes to neuronal dysfunction via demyelination, which may promote muscle wasting. 28 , 29 , 30 Oxidative stress also leads to neuromuscular junction (NMJ) impairments, which is important for the maintenance of skeletal muscle mass and function. 28 , 29 Sarcopenia is associated with NMJ disruption 31 ; however, it is not known if cancer leads to NMJ pathology or exacerbates pre‐existing NMJ dysfunction.
To determine if oxidative stress exacerbates cancer cachexia, we implanted tumours in an established experimental model of oxidative stress, the Sod1KO mice. We hypothesized that deletion of Sod1 would exacerbate cancer cachexia when compared with wild‐type (WT) counterparts. To test this hypothesis, we measured survivability, skeletal muscle size, skeletal muscle contractile function, skeletal muscle myofibrillar, cytosolic and mitochondrial protein turnover, mitochondrial function, metabolic proteomics, motor neuron function, and loss of innervation in tumour‐bearing WT and Sod1KO mice.
Methods
Animals and interventions
Animal experiments were approved by the Institutional Animal Care and Use Committees and performed at the Oklahoma Medical Research Foundation. In the current study, we have utilized the Lewis lung carcinoma (LLC) pre‐clinical model to study cancer cachexia. Experimental mice were group housed, kept on a 12:12 h light–dark cycle, and had access to standard rodent chow and water ad libitum. The breeding and characterization of the Sod1KO mice is described in detail elsewhere. 16 , 32 Blood was drawn through the aorta, and tissues were collected and snap frozen in liquid nitrogen for subsequent analyses.
Lewis lung carcinoma growth and tumour implantation
Lewis lung carcinoma cells were grown and implanted as previously described. 19 Briefly, LLC cells (ATCC CRL‐1642) were plated in 250 mL culture flasks in Dulbecco's modified Eagle medium supplemented with 10% foetal bovine serum plus 1% penicillin and streptomycin. Once confluent, cells were trypsinized, counted, and diluted in phosphate‐buffered saline for implantation. LLC cells were implanted into the right hind flank of the mouse. WT and Sod1KO mice were implanted with LLC cells at ~4–4.5 months of age. LLC cells were plated at passages 2–5. LLC cells were suspended in 100 μL of phosphate‐buffered saline for the injection, so control mice were injected with phosphate‐buffered saline into the hind flank of the mouse.
Ex vivo extensor digitorum longus contractility
Extensor digitorum longus (EDL) contractile properties were measured as previously described. 8 , 33 Briefly, EDL muscle was suspended on a dual‐mode muscle lever system (300C‐LR, Aurora Scientific Inc, Aurora, Canada) and a hook in Krebs buffer. Muscles were placed at optimal length and allowed 20 min of thermoequilibration at 32°C. A supramaximal current (600–800 mA) of 0.25 ms pulse duration was delivered through a stimulator (701 C, Aurora Scientific Inc.), while train duration for isometric contractions was 300 ms. Data were recorded and analysed using commercial software (DMC and DMA, Aurora Scientific). Specific force (N/cm2) of EDL muscles were multiplied to the ratio of fibre length to muscle length published previously. 34
Histology
Quadricep muscle was immediately imbedded in optimal cutting temperature compound and snap frozen. Sections were cut at 10 μm with a Leica 3050 cryotome. Staining for haematoxylin and eosin and succinate dehydrogenase was performed as previously described. 19 , 26 Zeiss inverted microscope was used to image slides. Muscle fibres were circled using Image J imaging software.
Determination of protein turnover
Protein synthesis was determined according to methods described in other studies. 35 , 36 , 37 Mice received a bolus i.p. injection (~20 μL/g body weight) of 99% deuterium oxide (D2O) 5 days before tissue collection. Drinking water was thereafter supplemented with 8% D2O in drinking water until euthanasia. 35 , 36 , 37 We chose to start labelling 5 days prior to euthanasia because this period corresponds to the period of time that the LLC model begins to lose muscle mass. 19 , 26 Approximately 50 mg of tibialis anterior (TA) muscles were powdered and fractionated according to our previously published protocols. 35 , 36 , 37 TA muscle was used because gastrocnemius was processed for other experiments (respirometer, proteomics, RNA analysis, and immunoblot analysis). Briefly, skeletal muscle tissue was homogenized 1:20 in isolation buffer (100 mM KCl, 40 mM Tris HCl, 10 mM Tris base, 5 mM MgCl2, 1 mM EDTA, 1 mM Adenosine triphosphate, pH = 7.5) with phosphatase and protease inhibitors (HALT, Thermo Fisher Scientific) using a bead homogenizer (Next Advance Inc., Averill Park, NY, USA). After homogenization, subcellular fractions were isolated via differential centrifugation as previously described. 35 , 36 , 37 The pentafluorobenzyl‐N,N‐di (pentafluorobenzyl) derivative of alanine was analysed on an Agilent 7890A GC coupled to an Agilent 5975C MS as previously described. 35 , 36 , 37 Distilled plasma was analysed on a Liquid Water Isotope Analyser (LWIA‐45‐EP, Los Gatos Research, Inc., San Jose, CA, USA). The newly synthesized fraction (f) of proteins was calculated from the enrichment of alanine bound in muscle proteins over the entire labelling period, divided by the true precursor enrichment (p), using plasma D2O enrichment with mass isotopomer distribution analysis adjustment. 38
Modelling calculations to account for non‐steady state conditions
The period of D2O measurement was a period of muscle loss, which violates the steady state assumptions of isotopic labelling. To account for this non‐steady state condition, calculations were made based in our previously published work. 39 , 40 , 41 CoxIV is commonly used as a surrogate marker for mitochondrial content; therefore, it was used for assessing turnover calculations. 42 , 43 , 44 In brief, the mass of protein at time t, P(t), obeys the differential equation:
| (1) |
where k syn is the synthesis rate, with dimensions of mass over time, and k deg is the degradation constant, with dimensions of inverse time.
From the equations derived in Miller et al., 39 , 40
| (2) |
Targeted quantitative mass spectrometry
We used targeted quantitative mass spectrometry to measure protein abundance as previously described. 45 Briefly, gastrocnemius samples were homogenized in a radioimmunoprecipitation assay buffer containing 10 mM Tris‐Cl (pH 8.0), 1 mM EDTA, 1% Triton X‐100 (v/v), 0.1% sodium deoxycholate (w/v), 0.1% sodium dodecyl sulfate (w/v), 140 mM NaCl, and 1 mM phenylmethylsulfonyl fluoride, with protease inhibitor cocktail (Calbiochem Set III, EDTA‐free; EMD Millipore; Billerica, MA, USA), and Bradford assay was used to determine protein concentration. For targeted proteomic analysis, 150 μG protein was used, as previously described. 33 , 46
Each of the four independent variables was analysed using scikit‐learn's implementation of linear discriminant analysis (LDA), with the eigen decomposition performed via singular value decomposition. Additional information regarding the univariate statistics comparing genotypes are given in the Supporting Information, Table S2. The clear separation between the genotypes in LDA component 1 is associated with the knockout of SOD1, as expected; however, the knockout model induces several other alterations to protein levels, which are shown with the supplementary table. LDA component 2 is associated with a linear combination of variables for which is less amenable to separation or decomposition into univariate statistics.
Respiration and hydroperoxide production in permeabilized fibre bundles
Skeletal muscle fibre permeabilization was performed as previously described. 11 , 19 , 33 Briefly, small strips of red gastrocnemius muscle were teased to near‐single fibres in ice cold buffer X (7.23 mM K2EGTA, 2.77 mM CaK2EGTA, 20 mM imidazole, 0.5 mM DTT, 20 mM taurine, 5.7 mM ATP, 14.3 mM PCr, 6.56 mM MgCl2–6H2O, and 50 mM K‐MES with a pH of 7.1). These fibre bundles were then permeabilized with saponin for 30 min. Mitochondrial oxygen consumption rate (OCR) and hydroperoxide production rate were simultaneously measured using the Oxygraph‐2k (O2k, OROBOROS Instruments, Innsbruck, Austria) respirometer and fluorometer as previously described. 11 , 19 , 33 Briefly, OCR and hydroperoxide production were measured in permeabilized fibre bundles in buffer Z media containing 10 μM Amplex UltraRed (Molecular Probes, Eugene, OR), 1 U/mL horseradish peroxidase, superoxide dismutase, and blebbistatin (25 μM) at 37°C. Rates of respiration and hydroperoxide production were determined using the following sequential additions of substrates and inhibitors: glutamate (10 mM), malate (2 mM), pyruvate (5 mM), Adenosine diphosphate (5 mM), succinate (10 mM), rotenone (1 μM), antimycin A (1 μM), and N,N,N′,N′‐Tetramethyl‐p‐phenylenediamine (TMPD) (0.5 mM) immediately followed by ascorbate (5 mM, ascorbate is added to ensure TMPD is reduced, so TMPD can continue to donate electrons). Respiration measurements were normalized to antimycin A to account for non‐mitochondrial oxygen consumption. Data for both OCR and rates of hydroperoxide generation were normalized by milligrams of muscle bundle wet weights weighed on Acculab AL‐104 scale.
RNA isolation, cDNA synthesis, and quantitative real‐time PCR
Gastrocnemius muscles were collected and frozen in liquid nitrogen at time of harvest. Gastrocnemius muscle, 20–30 μg, was homogenized into a 1 mL TRIzol solution. RNA was isololated as previously described. 8 Isolated RNA purity and concentration were confirmed using Bio‐Tek (Winooski, VT) Power Wave XS plate reader with Take3 microvolume plate and Gen5 software. After which, 1 μg of RNA was reverse transcribed into cDNA using previously described methods 8 and iScriptTM cDNA Synthesis reverse transcriptase reagents. cDNA was diluted to 1:25 (25 ng/μL) and Ct values analysed using Sybr Green reagents and commercial QuantStudio 6 Flex real‐time RT‐PCR instrumentation (Applied BioSystems, Foster City, CA). The following primers were used for RT‐PCR assessment (Table S1): 18s, ND4, ND6, COX1, CytB, ATPase 8/6, ATP5F1, SDHA, and UQCRC1. No differences were seen in 18s among experimental conditions for experiments presented. Final quantification of gene expression was calculated using the ΔΔCT method. Relative quantification was calculated as 2−ΔΔCT.
Immunoblotting
Immunoblot was performed as previously described. 47 Briefly, gastrocnemius muscle was homogenized in a buffer containing 0.23 M Tris HCl, pH 6.8, 4.5% w/v SDS, 45% glycerol, 0.04% w/v bromophenol blue, 80 mM dithiothreitol, 0.57 mM 2‐mercaptoethanol, protease inhibitor and denatured at 95°C. Concentrations were determined using the RC/DC assay (500‐0119, BioRad, Hercules, CA), and 30 μg total protein was resolved by sodium dodecyl sulfate‐polyacrylamide gel electrophoresis, transferred to a nitrocellulose membrane and blocked in 5% weight by volume milk in Tris‐buffered saline with 0.2% Tween 20. Membranes were probed overnight for antibodies specific to CuZn Superoxide Dismutase (SOD), MnSOD, Voltage‐dependent anion channel (VDAC), Cytochrome C Oxidase Subunit IV (CoxIV), and Thioredoxin‐dependent peroxide reductase (Prdx3). Primary and secondary antibodies were diluted in Tris‐buffered saline with 0.2% Tween 20 and used according to manufacturer's protocol. Membranes were imaged using Syngene G Box. All bands were normalized to the 45 kDa actin band of Ponceau S stain as a loading control.
Sciatic nerve conduction velocity
Sciatic nerve conduction velocity was measured based on a previously described protocol. 48 Briefly, mice were anaesthetised with constant flow of isoflurane. Sciatic nerve conduction velocity was measured using stimulating electrodes placed at the ankle, and recording electrodes were placed dorsally over all five digits. The latency and distance between electrodes were measured, and then, the stimulating electrodes were moved to the sciatic notch. The nerve was again stimulated, and the resulting latency was subtracted from the initial ankle–foot latency. This difference was divided between the distance between the notch and ankle to determine velocity. The distance was determined by stretching the foot so that a linear distance could be measured between stimulating and recording electrodes.
Transmission electron microscopy for sciatic nerve
Sciatic nerve samples were immediately collected after sacrifice, fixed in 4% glutaraldehyde and post‐fixed 1% osmium. The Oklahoma Medical Research Foundation imaging core facility then processed the sciatic nerves for ultrastructure assessment. Images were taken on a Hitachi H‐7600 Transmission Electron Microscope at ×1200 magnification.
Enzyme activity assay
Activities of CuZnSOD and MnSOD were determined using native gels with negative staining as a method previously described. 49 Briefly, Extracts containing 40 μg protein were separated on a 10% polyacrylamide native page gel. The gel was then soaked in a solution containing nitroblue tetrazolium, riboflavin, and Tetramethylethylenediamine (TEMED). The riboflavin is activated to oxidize an electron donor (TEMED). The gel was then imaged using Syngene G Box. For publication purposes, the image was inverted so that the achromatic areas representing SOD activity appear as dark regions against a light background.
Statistical analysis
A two‐way ANOVA with the independent factors of genotype and LLC implantation was used as the global analysis for each dependent variable. Only when there were differences was the Tukey–Kramer post hoc test performed. For all experiments, the comparison‐wise error rate, α, was set at 0.05 for all statistical tests. Asterisk (*) was used to denote significant differences denoted from the post hoc test. Interactions were denoted by #. All data were analysed, and graphs were compiled using GraphPad Prism (La Jolla, CA, USA) and data expressed as mean ± SEM.
Results
Characterization of Lewis lung carcinoma‐induced cancer cachexia in wild‐type and Sod1KO mice
In order to determine if elevated oxidative stress exacerbates cancer cachexia, we measured body weight, muscle weights, and cross‐sectional area (CSA) of hindlimb muscles. Injection of Sod1KO mice with LLC caused a 15% reduction in body weight compared with Sod1KO saline (P = 0.0107), suggesting that cancer‐induced loss of body weight was more severe in Sod1KO mice when compared with WT mice (Figure 1A). Gastrocnemius, quadriceps femoris, and TA muscle wet weights normalized to body mass were ~20% smaller in Sod1KO mice when compared with WT mice (P = 0.005–0.01, Figure 1B–D). Gastrocnemius mass was ~20% smaller in tumour‐bearing Sod1KO mice than gastrocnemius mass of saline‐injected Sod1KO mice (P = 0.017), which indicates that tumour‐mediated gastrocnemius muscle loss was more severe in Sod1KO mice than WT mice (Figure 1B). Quadricep femoris and TA muscle wet weights decreased by ~15% in tumour‐bearing WT and Sod1KO mice compared with saline‐injected WT and Sod1KO mice (P = 0.001–0.03, Figure 1C and 1D). Soleus mass was ~15% smaller in tumour‐bearing WT mice than saline‐injected WT mice (P = 0.019, Figure 1E). EDL mass was not different between groups (Figure 1F). The degree of tumour‐induced loss of muscle wet weight in hindlimb muscles is different in WT and Sod1KO mice (Figure 1G).
Figure 1.
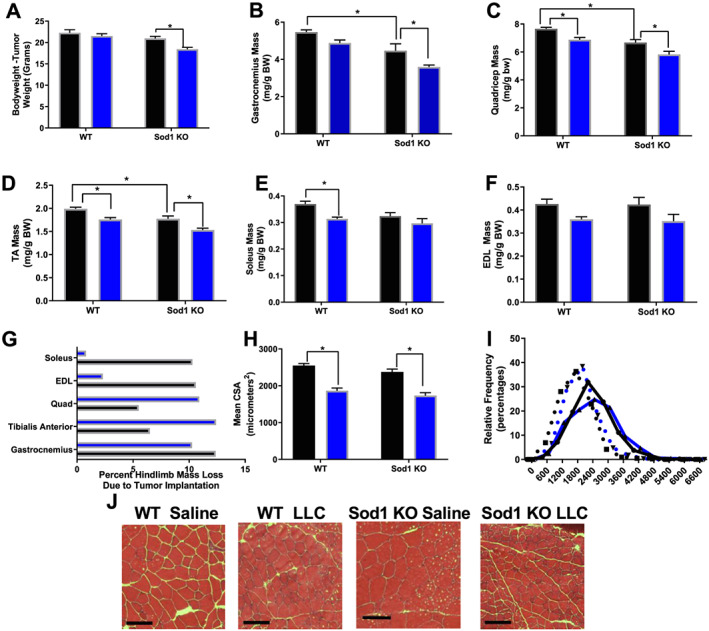
Characterization of LLC‐induced cancer cachexia in wild‐type (WT) and Sod1KO mice. (A) Body weights (BW—tumour weight) of WT saline, WT Lewis lung carcinoma (LLC), Sod1KO saline, and Sod1KO LLC tumour‐bearing mice. (B) Gastrocnemius mass in all groups normalized to BW. (C) Quadricep mass in all groups normalized to BW. (D) Tibialis anterior (TA) mass in all groups normalized to BW. (E) Soleus mass in all groups normalized to BW. (F) Extensor digitorum longus (EDL) mass in all groups normalized to BW. (G) Percent mass lost from cancer in hindlimb muscles of WT and Sod1KO mice. (H) Mean cross‐sectional area (CSA) analysis for all groups. (I) Frequency distribution of small fibres, average fibres, and large fibres. Groups for frequency distribution are displayed as shown here. (J) Representative images for haematoxylin and eosin stain across all groups. Scale bar is 100 μM. N of 6–8 was used for each group. Saline, black bar; LLC, blue bar. Asterisk denotes post hoc differences at an alpha set at P < 0.05.
Despite a reduction in muscle mass in Sod1KO mice compared with WT mice, the mean CSA of quadricep femoris muscle fibres in the muscles was not different than in WT mice (Figure 1H). The mean CSA of quadricep femoris muscle fibres was ~25% smaller in tumour‐bearing mice when compared with saline‐injected WT and Sod1KO mice (P = 0.001, Figure 1H and 1J). The number of small fibres (200–1200 μm2 area) increased in tumour‐bearing WT and Sod1KO mice when compared with saline‐injected WT and Sod1KO mice and the number of large fibres (>2400 μm2) decreased in tumour‐bearing WT and Sod1KO mice when compared with saline‐injected WT and Sod1KO mice (Figure 1I and 1J). Both the mean quadriceps femoris CSA and the frequency distribution suggest that cancer‐induced loss of individual muscle fibre mass was not exacerbated in Sod1KO mice (Figure 1H and 1I). Figure 1J shows representative haematoxylin and eosin staining images from the quadriceps femoris used to assess CSA.
Oxidative stress‐induced contractile dysfunction was not exacerbated in tumour‐bearing mice
In agreement with our previous reports, EDL maximal force was reduced by ~25% in Sod1KO mice when compared with WT counterparts (P = 0.012, Figure 2A). Despite a mean decrease of specific force in Sod1KO mice, there was no significant decrease between groups (P = 0.15, Figure 2B). We analysed the ex vivo twitch force of the EDL muscle and found no difference between groups (Figure 2C). Interestingly, the presence of tumours did not exacerbate contractile dysfunction in Sod1KO mice (Figure 2A–C).
Figure 2.
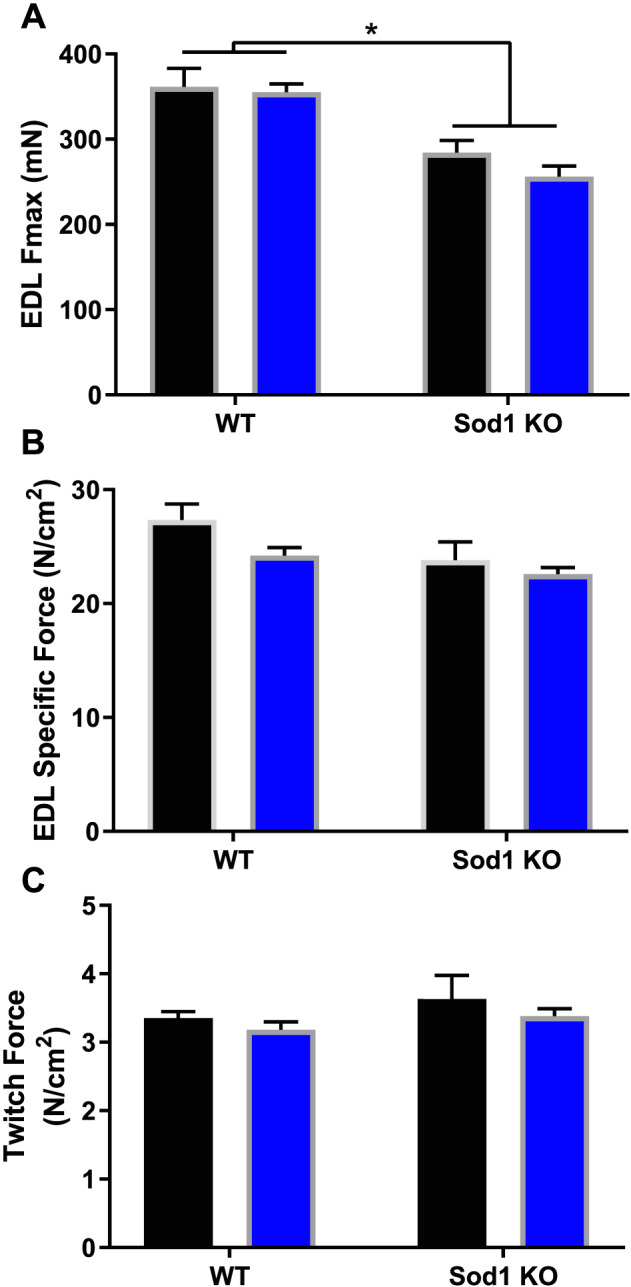
Oxidative stress‐induced contractile dysfunction is not exacerbated in tumour‐bearing mice. (A) Twitch contractile force for EDL muscle ex vivo. (B) Maximal contractile force for EDL muscle ex vivo. (C) Specific maximal contractile force for EDL muscle ex vivo. Saline, black bar; Lewis lung carcinoma, blue bar. Asterisk denotes post hoc differences at an alpha set at P < 0.05. EDL, extensor digitorum longus; WT, wild type.
Tumour burden in Sod1KO mice exacerbates neuromuscular junction fragmentation
Neuromuscular junction fragmentation increased by ~30% in saline‐injected Sod1KO mice when compared with WT saline mice (P = 0.03, Figure 3A and 3B). NMJ fragmentation was not different in tumour‐bearing WT mice compared with saline‐injected WT mice. NMJ fragmentation increased by an additional ~15% in tumour‐bearing Sod1KO mice when compared with saline‐injected Sod1KO mice (P = 0.01, Figure 3A and 3B). Sod1KO mice had a ~50–200% increase in mRNA content for the denervation markers Runx1, Gadd45α, AchRα, and Sln when compared with WT mice (P = 0.0001–0.0087, Figure 3C). Denervation markers did not increase in tumour‐bearing WT mice (Figure 3C), and tumour burden in Sod1KO mice did not further increase mRNA denervation markers when compared with saline‐injected Sod1KO mice (Figure 3C).
Figure 3.
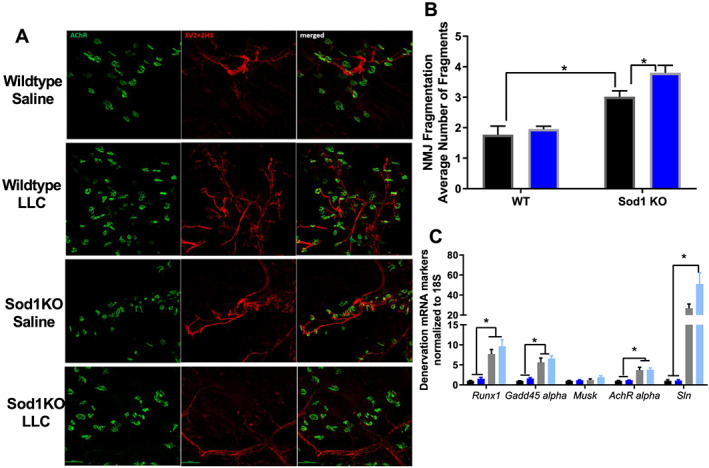
Cancer does not exacerbate neuromuscular junction disruption. (A) Representative images for NMJ staining in all groups. (B) NMJ fragmentation in all groups. Saline, black bar; LLC, blue bar. (C) Colours for graphs displayed in (C) are displayed here. Wild‐type saline, black bar; wild‐type LLC, dark blue bar; Sod1KO saline, grey bar; Sod1KO LLC, light blue bar. Denervation mRNA markers in all groups. For NMJ staining, an N of 2 animals per group was used. N of 6–8 per group was used in mRNA denervation markers.. Number sign denotes an interaction. Asterisk denotes post hoc differences at an alpha set at P < 0.05. LLC, Lewis lung carcinoma; NMJ, neuromuscular junction; WT, wild type.
Metabolic enzymes are altered in both Sod1KO mice and tumour‐bearing mice
We were interested in how metabolic enzymes were altered in WT mice and Sod1KO mice with cancer. In general, the gastrocnemius muscle from Sod1KO mice showed an up‐regulation of proteins involved in oxidative stress response, fatty acid metabolism, and oxidative metabolism when compared with saline‐injected WT mice (Figure 4A–D). Carbohydrate metabolism proteins were both up‐regulated and down‐regulated in Sod1KO mice compared with saline‐injected WT mice (Figure 4C). Tumour burden had a more modest effect on proteins involved in oxidative stress response and fatty acid metabolism when compared with saline‐injected WT mice (Figure 4A and 4B); however, proteins involved in carbohydrate metabolism were largely up‐regulated (Figure 4C). Oxidative metabolism proteins were both up‐regulated and down‐regulated in tumour‐bearing WT mice when compared with saline‐injected WT mice (Figure 4D). Metabolic protein dysregulation in tumour‐bearing Sod1KO mice was exacerbated when compared with saline‐injected Sod1KO mice (Figure 4A–D). LDA analysis, a linear transformation technique that attempts to find a feature subspace that maximizes group separability, showed distinct separation between the metabolic proteins of WT and Sod1KO mice (Figure 4E). There was no distinct separation between saline‐injected WT mice and tumour‐bearing WT mice (Figure 4E). Metabolic profile of tumour‐bearing Sod1KO mice was different than saline‐injected Sod1KO mice (Figure 4E). Statistics for these proteins are shown in Table S1.
Figure 4.
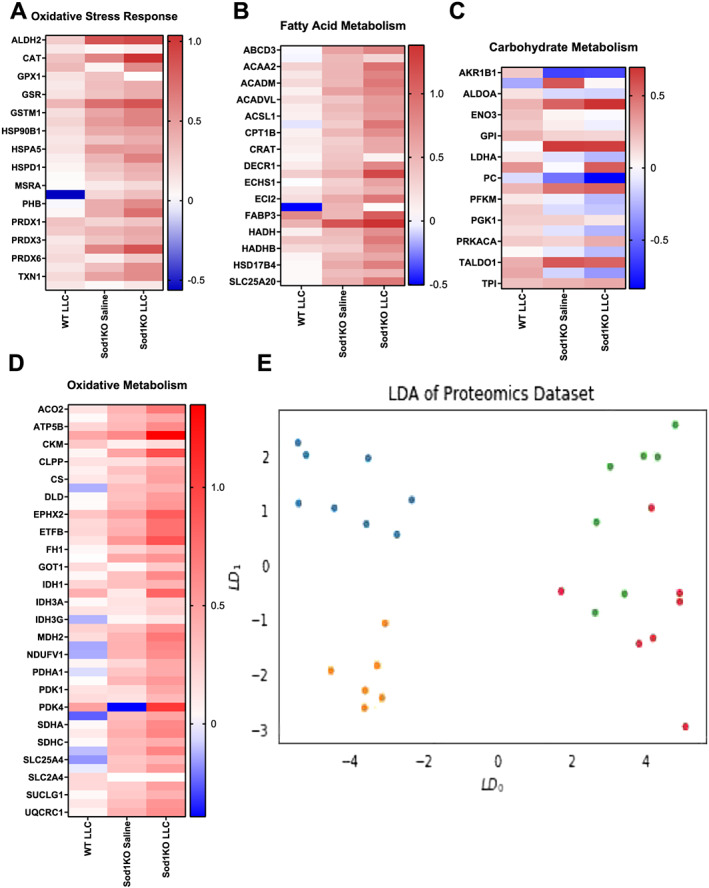
Metabolic enzymes are altered in Sod1KO mice and tumour‐bearing mice. (A) Heat map for oxidative stress enzymes relative to wild‐type saline mice. (B) Heat map for fatty acid metabolism enzymes relative to wild‐type saline mice. (C) Heat map for carbohydrate metabolism enzymes relative to wild‐type saline mice. (D) Heat map for oxidative metabolism enzymes relative to wild‐type saline mice. Targeted proteomics of glycolysis enzymes in all groups. (E) LDA analysis for the proteomics data set. Red, wild‐type saline; green, wild‐type LLC; orange, Sod1KO saline; blue, Sod1KO LLC. N of 6–8 per group was used. LDA, linear discriminant analysis; LLC, Lewis lung carcinoma; WT, wild type.
Tumour‐bearing mice have protein imbalance favouring degradation, despite an oxidative stress‐associated increase in myofibrillar protein synthesis
Muscle mass is lost when protein breakdown exceeds protein synthesis; therefore, we used D2O labelling to measure protein turnover in the TA muscle of WT and Sod1KO mice in response to induction of cachexia. Myofibrillar protein synthesis was two‐fold greater in saline Sod1KO mice when compared with saline WT mice (P = 0.027, Figure 5A). Myofibrillar degradation was two‐fold greater in saline Sod1KO mice than in saline WT mice (P = 0.0067, Figure 5B). Importantly, myofibrillar protein degradation was two‐fold greater in tumour‐bearing WT and Sod1KO mice when compared with WT saline and Sod1KO saline, respectively (P = 0.0001–0.0007, Figure 5B). Tumour‐bearing Sod1KO mice had ~50% greater increase in myofibrillar degradation rates when compared with tumour‐bearing WT mice (P = 0.0001, Figure 5B). Cytosolic proteins are typically involved in cell signalling and regulatory functions. There was no change in cytosolic protein synthesis between groups (Figure 5C). Cytosolic protein degradation did not increase in tumour‐bearing WT mice when compared with saline‐injected WT mice; however, cytosolic protein degradation was ~100% greater in tumour‐bearing Sod1KO mice when compared with saline Sod1KO mice (P = 0.0046, Figure 5D).
Figure 5.
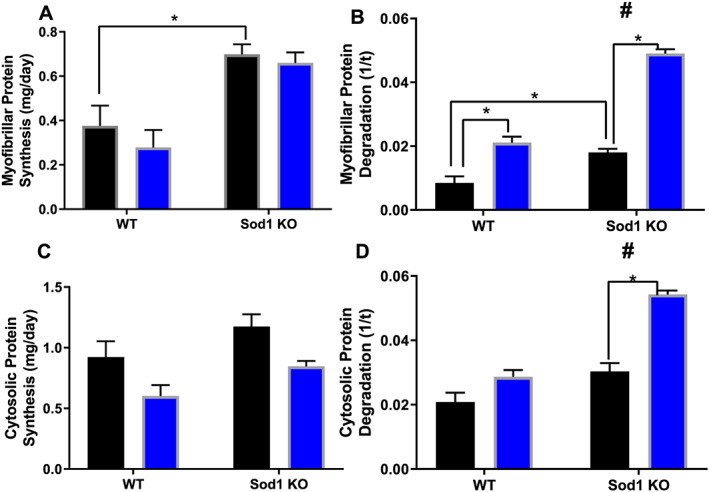
Tumour‐bearing mice have protein imbalance favouring degradation, despite an oxidative stress associated increase in myofibrillar protein synthesis. (A) Myofibrillar protein synthesis between all groups. (B) Myofibrillar protein degradation between all groups. (C) Cytosolic protein synthesis between all groups. (D) Cytosolic protein degradation between all groups. Saline, black bar; Lewis lung carcinoma, blue bar. Number sign denotes if there was an interaction. Asterisk denotes post hoc differences at an alpha set at P < 0.05. WT, wild type.
Tumour‐bearing mice have impaired mitochondrial function, increased reactive oxygen species production, increased mitochondrial protein degradation, and a loss of oxidative fibres
Mitochondrial dysfunction is prevalent in multiple muscle wasting conditions including cancer cachexia 19 ; therefore, we wanted to determine if elevated oxidative stress exacerbates cancer‐induced mitochondrial dysfunction and cancer‐induced mitochondrial turnover dysregulation. We assessed mitochondrial respiration and hydroperoxide production using permeabilized muscle fibres. Glutamate and malate‐stimulated leak respiration was not different between groups. Next, we measured maximally stimulated respiration from electron transport chain complex I, complex I + II, and complex II. These measurements assess mitochondrial peak respiratory capacity (state 3). There was a trend for a ~20% mean decrease (non‐significant, P = 0.1–0.25) in maximally stimulated respiration (complex I, complex I + II, and complex II) in Sod1KO when compared with WT counterparts (Figure 6A). Complex I, complex I + II, and complex II‐stimulated state 3 respiration was ~30% lower in tumour‐bearing WT mice when compared with saline‐injected WT mice (P = 0.0002–0.0023, Figure 6A). To assess the function of mitochondrial complex IV, we stimulated mitochondria with ascorbate and TMPD, which directly feeds elections into complex IV. Complex IV‐stimulated respiration was ~20% lower in tumour‐bearing WT mice than saline‐injected WT mice (P = 0.0074, Figure 6A). Taken together, these data suggest that cancer disrupts maximal mitochondrial respiratory, and mitochondrial dysfunction in tumour‐bearing Sod1KO mice was not further impaired (Figure 6A).
Figure 6.
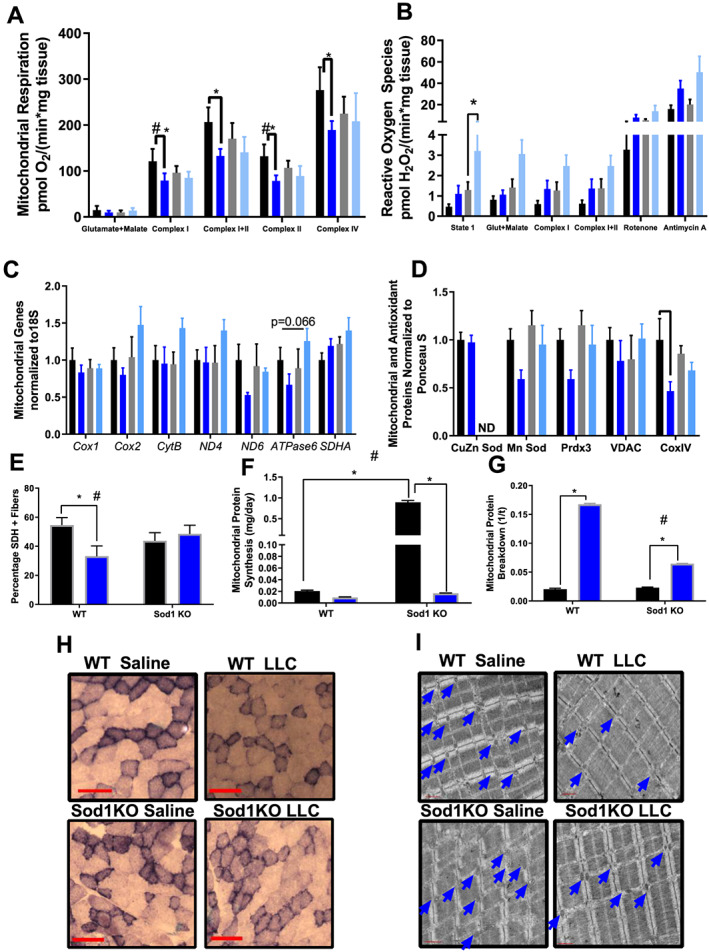
Tumour‐bearing mice have impaired mitochondrial function, increased reactive oxygen species production, and a loss of oxidative fibres. (A) Respiration measurements normalized to muscle wet weight. (B) Peroxide assessments normalized to muscle wet weight. There were main effects for both the genotype and LLC for an increase in hydroperoxide production for state 1, glutamate malate, complex I, complex I + II, and complex II stimulated ROS production. There was an ME for cancer‐induced increased in ROS production after antimycin A electron transport chain inhibition. Colours for graphs (C–E) are displayed here. (C) mRNA content of mitochondria genes. (D) Protein content of mitochondrial and antioxidant proteins. (E) Percent area stained positive for SDH. (F) Mitochondrial protein synthesis measurement using CoxIV as a mitochondrial content marker (Figure 6D). (G) Mitochondrial protein breakdown measurement using CoxIV as a mitochondrial content marker (Figure 6D). (H) SDH stain representative images. (I) TEM representative images. For TEM imaging, an N of 2 per group was used. N of 6–8 per group was used for all other measurements. (A–D) Wild‐type saline, black bar; wild‐type LLC, dark blue bar; Sod1KO saline, grey bar; Sod1KO LLC, light blue bar. (E–G) Saline, black bar; LLC, blue bar. Number sign denotes an interaction. Asterisk denotes post hoc differences at an alpha set at P < 0.05. LLC, Lewis lung carcinoma; WT, wild type.
When mitochondria become damaged, electrons are more susceptible to leak into oxygen to form ROS. We wanted to determine if elevated oxidative stress triggers an increase in ROS production with cancer. State 1 hydroperoxide production was ~200% higher in tumour‐bearing Sod1KO mice when compared with saline‐injected Sod1KO mice (P = 0.033, Figure 6B). Increased state 1 hydroperoxides is typically associated with muscle that has lost innervation, 50 , 51 which corroborates our findings in Figure 3. ROS generation during maximally stimulated respiration is indicative of electrons prematurely leaking into oxygen. There were no differences in ROS production between groups with complex I, complex I + II, and complex II‐stimulated respiration (Figure 6B). Rotenone leads to reverse electron flow and leak at complex I while antimycin A causes electron backup and leak for the entire electron transport chain. There were no differences in ROS production between groups following rotenone and antimycin A treatment (Figure 6B). These data suggest that cancer exacerbates basal hydroperoxide production in Sod1KO mice; however, in stimulated conditions, hydroperoxides produced in tumour‐bearing Sod1KO mice are not higher than saline‐injected Sod1KO mice.
Considering the loss of mitochondrial respiration in tumour‐bearing mice, we were interested in the effect of the tumour on mitochondrial turnover and content in skeletal muscle because impaired mitochondrial turnover can lead to mitochondrial dysfunction. For these calculations, we used the mitochondrial content marker CoxIV (Figure 6D). mRNA content for mitochondrial genes were not different between groups (Figure 6c); however, mitochondrial proteins MnSOD, Prdx3, and CoxIV were decreased by ~20–50% in WT and Sod1KO tumour‐bearing mice when compared with WT saline and Sod1KO saline mice, respectively (P = 0.02–0.049, Figure 6D). Immunoblot images are shown in Figure S1. The percentage of the image area that stained for SDH was not different between genotypes (Figure 6E and 6H). However, the area stained in tumour‐bearing WT mice was ~35% lower than saline‐injected WT mice (P = 0.042, Figure 6E and 6H). Loss of stained SDH area was not different in LLC‐injected Sod1KO mice when compared with saline‐injected Sod1KO mice (Figure 6E and 6H). Mitochondrial protein synthesis increased by ~300% in saline‐injected Sod1KO mice compared with all other groups (P = 0.0001, Figure 6F). Mitochondrial protein degradation increased by four‐fold in tumour‐bearing WT mice compared with saline‐injected WT mice (P = 0.0001, Figure 6G). Mitochondrial degradation in tumour‐bearing Sod1KO mice increased by two‐fold compared with saline‐injected Sod1KO mice, which was a notably smaller increase than tumour‐bearing WT mice (P = 0.0001, Figure 6G). Transmission electron microscopy (TEM) showed drastically increased size and quantity of mitochondria in Sod1KO mice compared with WT mice, while mitochondria of tumour‐bearing mice were smaller and less dense than saline‐injected mice (Figure 6I).
Motor neuron dysfunction was present in Sod1KO mice and tumour‐bearing mice
Sod1KO mice show a number of motor neuron phenotypes including demyelination, reduced nerve conduction velocity, and NMJ disruption. 29 , 48 , 52 , 53 Here, we asked whether the presence of tumours can exacerbate these phenotypes. The axon diameter measured in the sciatic nerve from Sod1KO mice was not different than in WT counterparts; however, axon diameter decreased by ~50% in tumour‐bearing WT mice compared with saline‐injected WT mice (P = 0.014, Figure 7A and 7F). Injection of LLC cells had no effect on axon diameter in Sod1KO mice (Figure 7A and 7F). There was no change in myelin diameter in Sod1KO mice compared with WT mice; however, myelin diameter decreased by ~40% in tumour‐bearing WT mice compared with saline‐injected WT mice (P = 0.0048, Figure 7B and 7F). Myelin diameter was not different in tumour‐bearing Sod1KO mice when compared with saline‐injected Sod1KO mice (Figure 7B and 7F). The axon diameter/myelin diameter and G ratio were not different between groups (Figure 7C, 7D, and 7F). The percent abnormal myelin increased by 100% in Sod1KO mice when compared with WT mice (P = 0.0001 Figure 7E and 7F). WT tumour‐bearing mice had 50% altered myelin profile, while saline‐injected WT mice did not have an altered myelin profile (P = 0.0001, Figure 7E and 7F). Sciatic nerve conduction velocity was decreased by ~20% in Sod1KO mice when compared with WT mice (P = 0.0223, Figure 7G). Also, sciatic nerve conduction velocity is decreased by ~30% in tumour‐bearing WT mice compared with saline‐injected WT mic`e (P = 0.0038, Figure 7G). Sciatic nerve conduction velocity was not further decreased in tumour‐bearing Sod1KO mice (Figure 7G).
Figure 7.
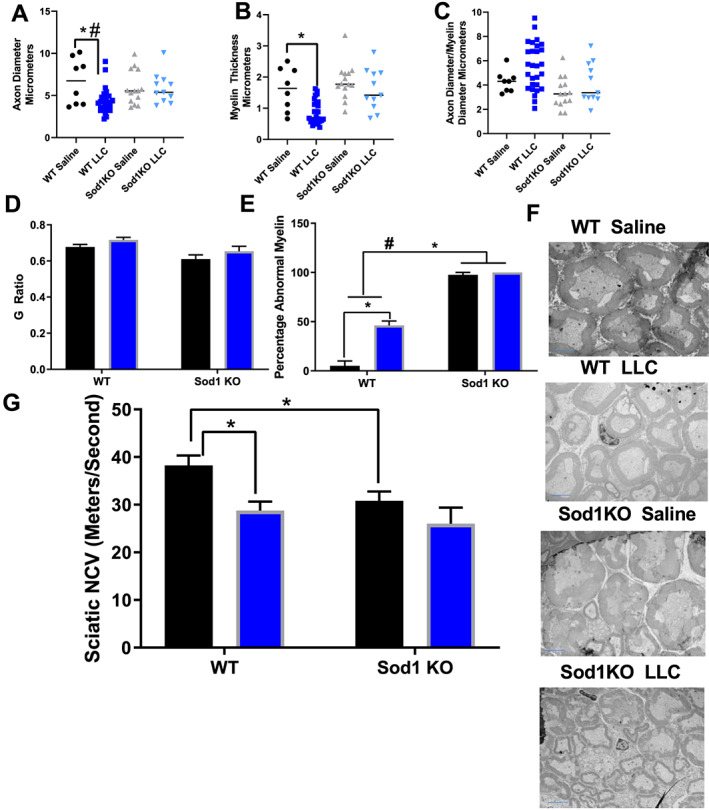
Motor neuron dysfunction is present in Sod1KO mice and tumour‐bearing mice. (A) Axon diameter measurements from sciatic nerve TEM images in all groups. (B) Myelin diameter measurements from sciatic nerve TEM images in all groups. (C) Axon diameter/myelin diameter from sciatic nerve TEM images in all groups. (D) G ratio from sciatic nerve TEM images in all groups. (E) Percent abnormal myelin from sciatic nerve TEM images in all groups. (F) Representative sciatic nerve TEM images. (G) Sciatic nerve conduction velocity assessment in all groups. For TEM image analysis, an N of 1 animal per group was used. N of 6–8 per group was used for nerve conduction velocity. (A–C) Wild‐type saline, black circles; wild‐type LLC, dark blue squares; Sod1KO saline, grey triangles; Sod1KO LLC, light blue inverted triangles. (D–G) Saline, black bar; LLC, blue bar. Number sign denotes an interaction. Asterisk denotes post hoc differences at an alpha set at P < 0.05. LLC, Lewis lung carcinoma; WT, wild type.
Lewis lung carcinoma injection induced death of Sod1KO mice within three weeks
We injected 4‐month to 5‐month‐old female WT and Sod1KO mice with phosphate‐buffered saline or one million LLC cells. Unexpectedly, 3 out of 11 of the tumour‐bearing Sod1KO mice did not survive the 3‐week duration of tumour implantation, while no WT mice that were injected with LLC cells died during the experimental period (Figure 8). Therefore, we ended the experiment after 3 weeks for data collection. Saline‐injected WT and Sod1KO mice survived the entire duration of the study as well (Figure 8).
Figure 8.
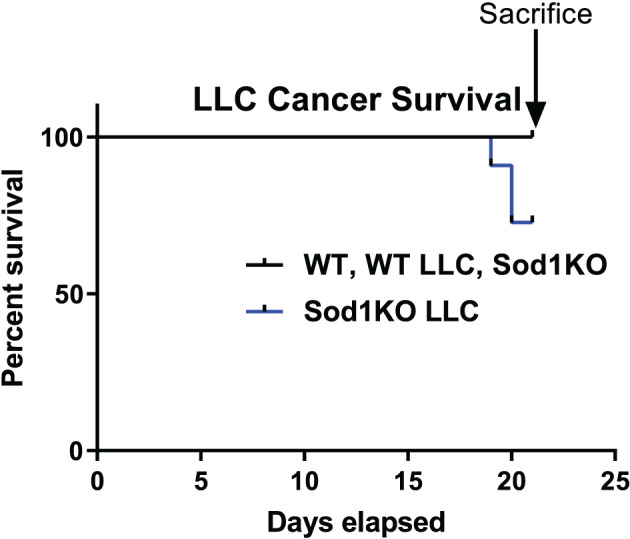
LLC‐injection induced death of Sod1KO mice within 3 weeks. Survival curve of tumour‐bearing WT (n = 8) and Sod1KO (n = 11) mice. Black line, wildtype saline, wildtype LLC, and Sod1KO saline. Blue line, Sod1KO LLC. LLC, Lewis lung carcinoma; WT, wild type.
Discussion
It is currently unknown if increased oxidative stress exacerbates cancer cachexia. The primary findings of our study are that knocking out the Sod1 gene, which codes for a critical antioxidant enzyme and superoxide anion scavenger, increases cancer mortality rates but does not exacerbate muscle loss, mitochondrial dysfunction, ROS production, or loss of oxidative phenotype in cachectic muscle in tumour‐bearing mice. Moreover, our study shows that protein turnover changes in a way that leads to a gain in mitochondrial mass in Sod1KO mice when compared with WT mice and that tumour‐bearing mice have increased protein degradation leading to a loss of mitochondrial content. We further found that induction of cancer exacerbates metabolic enzyme dysregulation and NMJ fragmentation in Sod1KO mice.
The pre‐clinical model we have elected to use in our study is implanting LLC cells (1 × 10⁶ cells) into the hind flank of mice. This model has been used by multiple laboratories to induce cancer cachexia. 54 , 55 , 56 Several laboratories have noted that implanting 1 × 10⁶ LLC cells into the hind flank of mice induces a moderate to severe cancer cachexia phenotype (~20% body mass lost and ~30–45% gastrocnemius muscle mass lost) after approximately 30 days of tumour growth. 54 , 55 , 56 In our model, we measured muscle mass loss 3 weeks after tumour implantation because of the abrupt deaths experienced in the Sod1KO mice at that time point. Both WT and Sod1KO mice display a similar degree of muscle wet weight and CSA (~10% smaller muscle wet weights and a ~25% decrease in mean CSA). We would consider this a mild cancer cachexia phenotype based on more severe phenotypes commonly being observed in other studies and models 57 , 58 , 59 ; however, we could not extend the study longer based on the survival of the Sod1KO mice. Further, female mice are less susceptible to cancer cachexia in pre‐clinical models and in cachectic patients, 60 , 61 , 62 which could be another reason why our phenotype is not as severe as other studies. Despite a 20% decrease in muscle mass in Sod1KO mice, fibre CSA was not different when compared with saline‐injected WT mice. This would suggest that the smaller muscle size observed in Sod1KO mice at this age is primarily due to loss of fibre number, which has previously been reported in the Sod1KO mouse model. 63 , 64 To our surprise, tumour implantation did not decrease EDL contractility in either WT or Sod1KO mice. It is possible that the discrepancies between our data and other cancer cachexia contractility reports are due to the severity of phenotype observed in these studies and the fibre type of the muscle used. 57 , 65 Based on these results, elevated oxidative stress may not exacerbate cancer‐related loss of muscle mass and function; however, if cancer cachexia was allowed to further progress, it is possible that loss of Sod1 could exacerbate the phenotype at a later time point.
Skeletal muscle atrophy occurs by an imbalance of myofibrillar protein turnover favouring protein degradation over protein synthesis. According to our data, tumour‐bearing mice have increased degradation in myofibrillar fractions and decreased protein synthesis in cytosolic fractions. To our knowledge, this is the first time long‐term protein degradation has been assessed (rather than markers) in a tumour model. It should also be noted that rates of myofibrillar protein degradation were higher in tumour‐bearing Sod1KO mice when compared with tumour‐bearing WT mice. However, this did not exacerbate the cancer cachexia phenotype in Sod1KO mice possibly due to higher rates of myofibrillar protein synthesis. The Sod1KO mouse is used as an accelerated aging and frailty model, 9 and similar to the Sod1KO mouse model, myofibrillar protein synthesis is elevated in aged muscle. 66 Prior studies show that atrogenes and autophagy machinery is up‐regulated in tumour‐bearing mice, which corresponds with our direct measurement of protein breakdown. 67 , 68 , 69 Further, proteolytic markers are elevated in the Sod1KO mouse model, 29 so this may contribute to our direct measurement showing increased protein degradation in tumour‐bearing Sod1KO mice even when compared with tumour‐bearing WT mice. It is possible that pathways that contribute to protein breakdown are even further elevated in tumour‐bearing Sod1KO mice. Our protein turnover measurements in myofibrillar and cytosolic fractions highlight the need to assess both aspects of dynamic protein turnover (not markers) during non‐steady state conditions such as cancer cachexia, which allows for a more robust interpretation than just measurements of protein turnover with markers.
Mitochondria are critical for the maintenance of muscle mass and function 70 , 71 , 72 ; therefore, we examined skeletal muscle mitochondrial properties and hydroperoxide production in tumour‐bearing WT and Sod1KO mice. Maximally stimulated respiration (state 3 respiration) was reduced in cachectic muscle in WT mice; however, cancer did not alter mitochondrial respiration in Sod1KO mice. Also, we observed increased ROS production ranging from 10% to 200% based on the substrate/inhibitor used. It is well established that mitochondrial damage/dysfunction and chronically elevated ROS generation lead to muscle wasting. 73 , 74 , 75 , 76 , 77 , 78 , 79 Based on these results and previous findings, it is likely that mitochondrial damage is involved in cancer‐induced muscle loss. More research is required to show if mitochondrial dysfunction directly contributes to cancer cachexia.
Both total mitochondrial content and mitochondrial turnover are key drivers of respiratory capacity in skeletal muscle; therefore, we measured mitochondrial turnover in tumour‐bearing WT and Sod1KO mice. Loss of oxidative phenotype (SDH stain) and mitochondrial content (Prdx3, MnSOD, and CoxIV) occurs in WT tumour‐bearing mice, but not tumour‐bearing Sod1KO mice, which may contribute to the loss of respiratory capacity in tumour‐bearing mice. Mitochondrial protein synthesis is dramatically up‐regulated in Sod1KO mice and cancer completely blunts this increase in mitochondrial protein synthesis. Also, mitochondrial protein degradation is dramatically elevated in tumour‐bearing mice. These data are corroborated by the increase in mitochondria size in muscle from Sod1KO mice and reduced mitochondria volume in tumour‐bearing mice shown via electron microscopy images. These findings are consistent with previous studies showing that there is a loss of the oxidative phenotype in skeletal muscle of tumour‐bearing mice. 18 , 56 , 80
Because mitochondrial content is differentially affected by the Sod1KO mouse and tumour‐bearing mice, we used targeted proteomics to illustrate changes in metabolic and antioxidant proteins. Sod1KO mice have a global change in the protein content of metabolic enzymes and antioxidant enzymes, which is exacerbated in tumour‐bearing Sod1KO mice. Surprisingly, proteins involved in oxidative stress response are relatively unchanged in WT tumour‐bearing mice, which suggests that ROS was not chronically elevated enough for an oxidative stress response. However, oxidative stress response and dysregulation of metabolic enzymes are exacerbated in tumour‐bearing Sod1KO mice, showing that these mice may be more susceptible to tumour‐induced changes in metabolism.
Prior research from our laboratory clearly shows that muscle loss and contractile dysfunction can be driven by neuromuscular impairments; therefore, we assessed motor neuron function and NMJ integrity. There was a loss of myelin and axon diameter in tumour‐bearing mice and abnormal myelin profiles in Sod1KO mice. We also observed impaired sciatic nerve conduction velocity in both Sod1KO mice and tumour‐bearing mice, which indicates that nerve function is impaired. Motor neuron impairments have been shown to lead to muscle pathology. 81 , 82 This is especially prevalent in disorders such as Amyotrophic lateral sclerosis. At this point, it is not known if motor neuron dysfunction contributes to cancer‐induced muscle loss. Sod1KO mice have NMJ impairments that mirror what happens in aged mice. 83 NMJ fragmentation was further elevated in tumour‐bearing Sod1KO mice when compared with saline‐injected Sod1KO mice, which indicates that cancer could exacerbate NMJ impairments. These data would suggest that cancer in aged individuals may accelerate NMJ fragmentation, which would lead to sarcopenia.
In summary, this is the first study to investigate if increased oxidative stress and frailty exacerbates cancer cachexia in tumour‐bearing mice. Cancer in Sod1KO mice, a mouse model for oxidative stress and sarcopenia, did not exacerbate muscle wasting in tumour‐bearing mice. Also, we have revealed that the deletion of Sod1 does not exacerbate cancer‐mediated contractile dysfunction, cancer‐mediated mitochondrial dysfunction, and cancer‐mediated ROS production. Cancer differentially alters myofibrillar and mitochondrial degradation in Sod1KO mice when compared with WT mice. Also, we have found that cancer exacerbates metabolic enzyme dysregulation and NMJ fragmentation in Sod1KO mice. To our knowledge, this is the first study to show that cancer disrupts motor neuron function; however, it is not known if this contributes to muscle loss. Future studies should examine cancer cachexia in an aged population considering aging is the greatest risk factor for cancer.
Conflict of interest
All authors declare no conflicts of interest.
Ethical standards statement
Animal experiments were approved by the Institutional Animal Care and Use Committees and performed at the Oklahoma Medical Research Foundation.
Supporting information
Figure S1. Sample blots and sample activity gel. A. Sample blots for the quantitation displayed in figure 5G. B. Sample image of the activity gel ran to confirm the genotype of mice. Representative MnSod and CuZnSod enzyme activity gel in muscle, liver and brain. N of 6–8 per group was used.
Table S1: Forward and Reverse Sequences for Sybr primers.
Table S2: Statistical analysis for targeted proteomics dataset using LDA.
Acknowledgements
Support for this work has been provided by National Institute on Aging P01AG051442. Dr Van Remmen is the recipient of a VA Senior Research Career Scientist award (1 IK6 BX005234‐01). Contents of this publication are solely the responsibility of the authors and do not necessarily represent the official views of the NIH. The authors would like to thank the members of the Van Remmen Laboratory for their contributions to the experiments presented here. Dr Jacob L. Brown's and Dr Marcus M. Lawrence's post‐doctoral training is supported by NIA T32 AG052363. We would also like to extend our gratitude to the numerous other faculties, staff, and other researchers at the Oklahoma Medical Research Foundation and OUHSC for helpful discussions. The authors certify that they comply with the ethical guidelines for authorship and publishing of the Journal of Cachexia, Sarcopenia and Muscle. 84
Brown J. L., Lawrence M. M., Ahn B., Kneis P., Piekarz K. M., Qaisar R., Ranjit R., Bian J., Pharaoh G., Brown C., Peelor F. F. 3rd, Kinter M. T., Miller B. F., Richardson A., and Van Remmen H. (2020) Cancer cachexia in a mouse model of oxidative stress, Journal of Cachexia, Sarcopenia and Muscle, 11, 1688–1704, doi: 10.1002/jcsm.12615
References
- 1. Fearon KC, Glass DJ, Guttridge DC. Cancer cachexia: mediators, signaling, and metabolic pathways. Cell sMetab 2012;16:153–166. [DOI] [PubMed] [Google Scholar]
- 2. Fearon K, Strasser F, Anker SD, Bosaeus I, Bruera E, Fainsinger RL, et al. Definition and classification of cancer cachexia: an international consensus. Lancet Oncol 2011;12:489–495. [DOI] [PubMed] [Google Scholar]
- 3. Onesti JK, Guttridge DC. Inflammation based regulation of cancer cachexia. Biomed Res Int 2014;2014:168407. [DOI] [PMC free article] [PubMed] [Google Scholar]
- 4. Xiao J, Caan BJ, Weltzien E, Cespedes Feliciano EM, Kroenke CH, Meyerhardt JA, et al. Associations of pre‐existing co‐morbidities with skeletal muscle mass and radiodensity in patients with non‐metastatic colorectal cancer. J Cachexia Sarcopenia Muscle 2018;9:654–663. [DOI] [PMC free article] [PubMed] [Google Scholar]
- 5. Davis MP, Panikkar R. Sarcopenia associated with chemotherapy and targeted agents for cancer therapy. Ann Palliat Med 2019;8:86–101. [DOI] [PubMed] [Google Scholar]
- 6. Antoun S, Baracos VE, Birdsell L, Escudier B, Sawyer MB. Low body mass index and sarcopenia associated with dose‐limiting toxicity of sorafenib in patients with renal cell carcinoma. Ann Oncol 2010;21:1594–1598. [DOI] [PubMed] [Google Scholar]
- 7. Damiano S, Muscariello E, La Rosa G, Di Maro M, Mondola P, Santillo M. Dual role of reactive oxygen species in muscle function: can antioxidant dietary supplements counteract age‐related sarcopenia? Int J Mol Sci 2019;20. [DOI] [PMC free article] [PubMed] [Google Scholar]
- 8. Qaisar R, Bhaskaran S, Premkumar P, Ranjit R, Natarajan KS, Ahn B, et al. Oxidative stress‐induced dysregulation of excitation‐contraction coupling contributes to muscle weakness. J Cachexia Sarcopenia Muscle 2018;9:1003–1017. [DOI] [PMC free article] [PubMed] [Google Scholar]
- 9. Deepa SS, Bhaskaran S, Espinoza S, Brooks SV, McArdle A, Jackson MJ, et al. A new mouse model of frailty: the Cu/Zn superoxide dismutase knockout mouse. GeroScience 2017;39:187–198. [DOI] [PMC free article] [PubMed] [Google Scholar]
- 10. Kumar A, Davuluri G, Welch N, Kim A, Gangadhariah M, Allawy A, et al. Oxidative stress mediates ethanol‐induced skeletal muscle mitochondrial dysfunction and dysregulated protein synthesis and autophagy. Free Radic Biol Med 2019;145:284–299. [DOI] [PMC free article] [PubMed] [Google Scholar]
- 11. Ahn B, Ranjit R, Premkumar P, Pharaoh G, Piekarz KM, Matsuzaki S, et al. Mitochondrial oxidative stress impairs contractile function but paradoxically increases muscle mass via fibre branching. J Cachexia Sarcopenia Muscle 2019;10:411–428. [DOI] [PMC free article] [PubMed] [Google Scholar]
- 12. Flynn JM, Melov S. SOD2 in mitochondrial dysfunction and neurodegeneration. Free Radic Biol Med 2013;62:4–12. [DOI] [PMC free article] [PubMed] [Google Scholar]
- 13. Modi SR, Kokkola T. Strigolactone GR24 upregulates target genes of the cytoprotective transcription factor Nrf2 in skeletal muscle. F1000Res 2018;7:1459. [DOI] [PMC free article] [PubMed] [Google Scholar]
- 14. Olthoff JT, Lindsay A, Abo‐Zahrah R, Baltgalvis KA, Patrinostro X, Belanto JJ, et al. Loss of peroxiredoxin‐2 exacerbates eccentric contraction‐induced force loss in dystrophin‐deficient muscle. Nat Commun 2018;9:5104. [DOI] [PMC free article] [PubMed] [Google Scholar]
- 15. Sullivan‐Gunn MJ, Campbell‐O'Sullivan SP, Tisdale MJ, Lewandowski PA. Decreased NADPH oxidase expression and antioxidant activity in cachectic skeletal muscle. J Cachexia Sarcopenia Muscle 2011;2:181–188. [DOI] [PMC free article] [PubMed] [Google Scholar]
- 16. Muller FL, Song W, Liu Y, Chaudhuri A, Pieke‐Dahl S, Strong R, et al. Absence of CuZn superoxide dismutase leads to elevated oxidative stress and acceleration of age‐dependent skeletal muscle atrophy. Free Radic Biol Med 2006;40:1993–2004. [DOI] [PubMed] [Google Scholar]
- 17. Powers SK, Ji LL, Kavazis AN, Jackson MJ. Reactive oxygen species: impact on skeletal muscle. Compr Physiol 2011;1:941–969. [DOI] [PMC free article] [PubMed] [Google Scholar]
- 18. White JP, Baltgalvis KA, Puppa MJ, Sato S, Baynes JW, Carson JA. Muscle oxidative capacity during IL‐6‐dependent cancer cachexia. Am J Physiol Regul Integr Comp Physiol 2011;300:R201–R211. [DOI] [PMC free article] [PubMed] [Google Scholar]
- 19. Brown JL, Rosa‐Caldwell ME, Lee DE, Blackwell TA, Brown LA, Perry RA, et al. Mitochondrial degeneration precedes the development of muscle atrophy in progression of cancer cachexia in tumour‐bearing mice. J Cachexia Sarcopenia Muscle 2017;8:926–938. [DOI] [PMC free article] [PubMed] [Google Scholar]
- 20. Campbell MD, Duan J, Samuelson AT, Gaffrey MJ, Merrihew GE, Egertson JD, et al. Improving mitochondrial function with SS‐31 reverses age‐related redox stress and improves exercise tolerance in aged mice. Free Radic Biol Med 2019;134:268–281. [DOI] [PMC free article] [PubMed] [Google Scholar]
- 21. Kaur N, Gupta P, Saini V, Sherawat S, Gupta S, Dua A, et al. Cinnamaldehyde regulates H2 O 2 ‐induced skeletal muscle atrophy by ameliorating the proteolytic and antioxidant defense systems. J Cell Physiol 2019;234:6194–6208. [DOI] [PubMed] [Google Scholar]
- 22. Gao Y, Arfat Y, Wang H, Goswami N. Muscle atrophy induced by mechanical unloading: mechanisms and potential countermeasures. Front Physiol 2018;9:235. [DOI] [PMC free article] [PubMed] [Google Scholar]
- 23. Di Meo S, Reed TT, Venditti P, Victor VM. Role of ROS and RNS sources in physiological and pathological conditions. Oxid Med Cell Longev 2016;2016:1245049. [DOI] [PMC free article] [PubMed] [Google Scholar]
- 24. Zhang L, Kimball SR, Jefferson LS, Shenberger JS. Hydrogen peroxide impairs insulin‐stimulated assembly of mTORC1. Free Radic Biol Med 2009;46:1500–1509. [DOI] [PMC free article] [PubMed] [Google Scholar]
- 25. O'Loghlen A, Perez‐Morgado MI, Salinas M, Martin ME. N‐acetyl‐cysteine abolishes hydrogen peroxide‐induced modification of eukaryotic initiation factor 4F activity via distinct signalling pathways. Cell Signal 2006;18:21–31. [DOI] [PubMed] [Google Scholar]
- 26. Brown JL, Lee DE, Rosa‐Caldwell ME, Brown LA, Perry RA, Haynie WS, et al. Protein imbalance in the development of skeletal muscle wasting in tumour‐bearing mice. J Cachexia Sarcopenia Muscle 2018;9:987–1002. [DOI] [PMC free article] [PubMed] [Google Scholar]
- 27. Franzke B, Halper B, Hofmann M, Oesen S, Jandrasits W, Baierl A, et al. The impact of six months strength training, nutritional supplementation or cognitive training on DNA damage in institutionalised elderly. Mutagenesis 2015;30:147–153. [DOI] [PubMed] [Google Scholar]
- 28. Vasilaki A, Richardson A, Van Remmen H, Brooks SV, Larkin L, McArdle A, et al. Role of nerve‐muscle interactions and reactive oxygen species in regulation of muscle proteostasis with ageing. J Physiol 2017;595:6409–6415. [DOI] [PMC free article] [PubMed] [Google Scholar]
- 29. Sakellariou GK, McDonagh B, Porter H, Giakoumaki II, Earl KE, Nye GA, et al. Comparison of whole body SOD1 knockout with muscle‐specific SOD1 knockout mice reveals a role for nerve redox signaling in regulation of degenerative pathways in skeletal muscle. Antioxid Redox Signal 2018;28:275–295. [DOI] [PMC free article] [PubMed] [Google Scholar]
- 30. Ohyama K, Koike H, Katsuno M, Takahashi M, Hashimoto R, Kawagashira Y, et al. Muscle atrophy in chronic inflammatory demyelinating polyneuropathy: a computed tomography assessment. Eur J Neurol 2014;21:1002–1010. [DOI] [PubMed] [Google Scholar]
- 31. Jang YC, Van Remmen H. Age‐associated alterations of the neuromuscular junction. Exp Gerontol 2011;46:193–198. [DOI] [PMC free article] [PubMed] [Google Scholar]
- 32. Elchuri S, Oberley TD, Qi W, Eisenstein RS, Roberts LJ, Van Remmen H, et al. CuZnSOD deficiency leads to persistent and widespread oxidative damage and hepatocarcinogenesis later in life. Oncogene 2005;24:367–380. [DOI] [PubMed] [Google Scholar]
- 33. Ahn B, Pharaoh G, Premkumar P, Huseman K, Ranjit R, Kinter M, et al. Nrf2 deficiency exacerbates age‐related contractile dysfunction and loss of skeletal muscle mass. Redox Biol 2018;17:47–58. [DOI] [PMC free article] [PubMed] [Google Scholar]
- 34. Brooks SV, Faulkner JA. Contractile properties of skeletal muscles from young, adult and aged mice. J Physiol 1988;404:71–82. [DOI] [PMC free article] [PubMed] [Google Scholar]
- 35. Drake JC, Bruns DR, Peelor FF 3rd, Biela LM, Miller RA, Hamilton KL, et al. Long‐lived crowded‐litter mice have an age‐dependent increase in protein synthesis to DNA synthesis ratio and mTORC1 substrate phosphorylation. Am J Physiol Endocrinol Metab 2014;307:E813–E821. [DOI] [PMC free article] [PubMed] [Google Scholar]
- 36. Drake JC, Peelor FF III, Biela LM, Watkins MK, Miller RA, Hamilton KL, et al. Assessment of mitochondrial biogenesis and mTORC1 signaling during chronic rapamycin feeding in male and female mice. J Gerontol A Biol Sci Med Sci 2013;68:1493–1501. [DOI] [PMC free article] [PubMed] [Google Scholar]
- 37. Drake JC, Bruns DR, Peelor FF III, Biela LM, Miller RA, Miller BF, et al. Long‐lived Snell dwarf mice display increased proteostatic mechanisms that are not dependent on decreased mTORC1 activity. Aging Cell 2015;14:474–482. [DOI] [PMC free article] [PubMed] [Google Scholar]
- 38. Busch R, Kim YK, Neese RA, Schade‐Serin V, Collins M, Awada M, et al. Measurement of protein turnover rates by heavy water labeling of nonessential amino acids. Biochim Biophys Acta 2006;1760:730–744. [DOI] [PubMed] [Google Scholar]
- 39. Miller BF, Wolff CA, Peelor FF III, Shipman PD, Hamilton KL. Modeling the contribution of individual proteins to mixed skeletal muscle protein synthetic rates over increasing periods of label incorporation. J Appl Physiol (1985) 2015;118:655–661. [DOI] [PMC free article] [PubMed] [Google Scholar]
- 40. Miller BF, Hamilton KL, Majeed ZR, Abshire SM, Confides AL, Hayek AM, et al. Enhanced skeletal muscle regrowth and remodelling in massaged and contralateral non‐massaged hindlimb. J Physiol 2018;596:83–103. [DOI] [PMC free article] [PubMed] [Google Scholar]
- 41. Lawrence MM, Van Pelt DW, Confides AL, Hunt ER, Hettinger ZR, Laurin JL, et al. Massage as a mechanotherapy promotes skeletal muscle protein and ribosomal turnover but does not mitigate muscle atrophy during disuse in adult rats. Acta Physiol (Oxf) 2020;e13460. [DOI] [PMC free article] [PubMed] [Google Scholar]
- 42. Lyons CN, Mathieu‐Costello O, Moyes CD. Regulation of skeletal muscle mitochondrial content during aging. The Journals of Gerontology: Series A 2006;61:3–13. [DOI] [PubMed] [Google Scholar]
- 43. Wyckelsma VL, Levinger I, McKenna MJ, Formosa LE, Ryan MT, Petersen AC, et al. Preservation of skeletal muscle mitochondrial content in older adults: relationship between mitochondria, fibre type and high‐intensity exercise training. J Physiol 2017;595:3345–3359. [DOI] [PMC free article] [PubMed] [Google Scholar]
- 44. Greene NP, Lee DE, Brown JL, Rosa ME, Brown LA, Perry RA, et al. Mitochondrial quality control, promoted by PGC‐1α, is dysregulated by Western diet‐induced obesity and partially restored by moderate physical activity in mice. Physiol Rep 2015;3. [DOI] [PMC free article] [PubMed] [Google Scholar]
- 45. Rindler PM, Plafker SM, Szweda LI, Kinter M. High dietary fat selectively increases catalase expression within cardiac mitochondria. J Biol Chem 2013;288:1979–1990. [DOI] [PMC free article] [PubMed] [Google Scholar]
- 46. Pharaoh G, Sataranatarajan K, Street K, Hill S, Gregston J, Ahn B, et al. Metabolic and stress response changes precede disease onset in the spinal cord of mutant SOD1 ALS mice. Front Neurosci 2019;13:487. [DOI] [PMC free article] [PubMed] [Google Scholar]
- 47. Brown JL, Rosa‐Caldwell ME, Lee DE, Brown LA, Perry RA, Shimkus KL, et al. PGC‐1alpha4 gene expression is suppressed by the IL‐6‐MEK‐ERK 1/2 MAPK signalling axis and altered by resistance exercise, obesity and muscle injury. Acta Physiol (Oxf) 2017;220:275–288. [DOI] [PubMed] [Google Scholar]
- 48. Walsh ME, Sloane LB, Fischer KE, Austad SN, Richardson A, Van Remmen H. Use of Nerve Conduction Velocity to Assess Peripheral Nerve Health in Aging Mice. J Gerontol A Biol Sci Med Sci 2015;70:1312–1319. [DOI] [PMC free article] [PubMed] [Google Scholar]
- 49. Van Remmen H, Salvador C, Yang H, Huang TT, Epstein CJ, Richardson A. Characterization of the antioxidant status of the heterozygous manganese superoxide dismutase knockout mouse. Arch Biochem Biophys 1999;363:91–97. [DOI] [PubMed] [Google Scholar]
- 50. Muller FL, Song W, Jang YC, Liu Y, Sabia M, Richardson A, et al. Denervation‐induced skeletal muscle atrophy is associated with increased mitochondrial ROS production. Am J Physiol Regul Integr Comp Physiol 2007;293:R1159–R1168. [DOI] [PubMed] [Google Scholar]
- 51. Bhattacharya A, Muller FL, Liu Y, Sabia M, Liang H, Song W, et al. Denervation induces cytosolic phospholipase A2‐mediated fatty acid hydroperoxide generation by muscle mitochondria. J Biol Chem 2009;284:46–55. [DOI] [PMC free article] [PubMed] [Google Scholar]
- 52. Shi Y, Ivannikov MV, Walsh ME, Liu Y, Zhang Y, Jaramillo CA, et al. The lack of CuZnSOD leads to impaired neurotransmitter release, neuromuscular junction destabilization and reduced muscle strength in mice. PLoS One 2014;9:e100834. [DOI] [PMC free article] [PubMed] [Google Scholar]
- 53. Hamilton RT, Bhattacharya A, Walsh ME, Shi Y, Wei R, Zhang Y, et al. Elevated protein carbonylation, and misfolding in sciatic nerve from db/db and Sod1(−/−) mice: plausible link between oxidative stress and demyelination. PLoS One 2013;8:e65725. [DOI] [PMC free article] [PubMed] [Google Scholar]
- 54. Lee DE, Brown JL, Rosa‐Caldwell ME, Blackwell TA, Perry RA Jr, Brown LA, Khatri B, Seo D, Bottje WG, Washington TA, Wiggs MP, Cancer cachexia‐induced muscle atrophy: evidence for alterations in microRNAs important for muscle size. Physiol Genomics, 2017: p. physiolgenomics.00006.2017. [DOI] [PubMed] [Google Scholar]
- 55. Puppa MJ, Gao S, Narsale AA, Carson JA. Skeletal muscle glycoprotein 130's role in Lewis lung carcinoma‐induced cachexia. FASEB J 2014;28:998–1009. [DOI] [PMC free article] [PubMed] [Google Scholar]
- 56. Pin F, Busquets S, Toledo M, Camperi A, Lopez‐Soriano FJ, Costelli P, et al. Combination of exercise training and erythropoietin prevents cancer‐induced muscle alterations. Oncotarget 2015;6:43202–43215. [DOI] [PMC free article] [PubMed] [Google Scholar]
- 57. VanderVeen BN, Hardee JP, Fix DK, Carson JA. Skeletal muscle function during the progression of cancer cachexia in the male Apc (Min/+) mouse. J Appl Physiol (1985) 2018;124:684–695. [DOI] [PMC free article] [PubMed] [Google Scholar]
- 58. Narsale AA, Puppa MJ, Hardee JP, VanderVeen BN, Enos RT, Murphy EA, et al. Short‐term pyrrolidine dithiocarbamate administration attenuates cachexia‐induced alterations to muscle and liver in ApcMin/+ mice. Oncotarget 2016;7:59482–59502. [DOI] [PMC free article] [PubMed] [Google Scholar]
- 59. Lee DE, Brown JL, Rosa‐Caldwell ME, Blackwell TA, Perry RA Jr, Brown LA, et al. Cancer cachexia‐induced muscle atrophy: evidence for alterations in microRNAs important for muscle size. Physiol Genomics 2017;49:253–260. [DOI] [PubMed] [Google Scholar]
- 60. Montalvo RN, Counts BR, Carson JA. Understanding sex differences in the regulation of cancer‐induced muscle wasting. Curr Opin Support Palliat Care 2018;12:394–403. [DOI] [PMC free article] [PubMed] [Google Scholar]
- 61. Hetzler KL, Hardee JP, LaVoie HA, Murphy EA, Carson JA. Ovarian function's role during cancer cachexia progression in the female mouse. Am J Physiol Endocrinol Metab 2017;312:E447–e459. [DOI] [PMC free article] [PubMed] [Google Scholar]
- 62. Clocchiatti A, Cora E, Zhang Y, Dotto GP. Sexual dimorphism in cancer. Nat Rev Cancer 2016;16:330–339. [DOI] [PubMed] [Google Scholar]
- 63. Larkin LM, Davis CS, Sims‐Robinson C, Kostrominova TY, Remmen HV, Richardson A, et al. Skeletal muscle weakness due to deficiency of CuZn‐superoxide dismutase is associated with loss of functional innervation. Am J Physiol Regul Integr Comp Physiol 2011;301:R1400–R1407. [DOI] [PMC free article] [PubMed] [Google Scholar]
- 64. Kostrominova TY, Pasyk KA, Van Remmen H, Richardson AG, Faulkner JA. Adaptive changes in structure of skeletal muscles from adult Sod1 homozygous knockout mice. Cell Tissue Res 2007;327:595–605. [DOI] [PubMed] [Google Scholar]
- 65. Roberts BM, Frye GS, Ahn B, Ferreira LF, Judge AR. Cancer cachexia decreases specific force and accelerates fatigue in limb muscle. Biochem Biophys Res Commun 2013;435:488–492. [DOI] [PMC free article] [PubMed] [Google Scholar]
- 66. Miller BF, Baehr LM, Musci RV, Reid JJ, Peelor FF III, Hamilton KL, et al. Muscle‐specific changes in protein synthesis with aging and reloading after disuse atrophy. J Cachexia Sarcopenia Muscle 2019;10:1195–1209. [DOI] [PMC free article] [PubMed] [Google Scholar]
- 67. Lee K, Ochi E, Song H, Nakazato K. Activation of AMP‐activated protein kinase induce expression of FoxO1, FoxO3a, and myostatin after exercise‐induced muscle damage. Biochem Biophys Res Commun 2015;466:289–294. [DOI] [PubMed] [Google Scholar]
- 68. Wilhelm K, Happel K, Eelen G, Schoors S, Oellerich MF, Lim R, et al. FOXO1 couples metabolic activity and growth state in the vascular endothelium. Nature 2016;529:216–220. [DOI] [PMC free article] [PubMed] [Google Scholar]
- 69. Aversa Z, Pin F, Lucia S, Penna F, Verzaro R, Fazi M, et al. Autophagy is induced in the skeletal muscle of cachectic cancer patients. Sci Rep 2016;6:30340. [DOI] [PMC free article] [PubMed] [Google Scholar]
- 70. Kunzke T, Buck A, Prade VM, Feuchtinger A, Prokopchuk O, Martignoni ME, et al. Derangements of amino acids in cachectic skeletal muscle are caused by mitochondrial dysfunction. J Cachexia Sarcopenia Muscle 2020;11:226–240. [DOI] [PMC free article] [PubMed] [Google Scholar]
- 71. Trevino MB, Zhang X, Standley RA, Wang M, Han X, Reis FCJ, et al. Loss of mitochondrial energetics is associated with poor recovery of muscle function but not mass following disuse atrophy. Am J Physiol Endocrinol Metab 2019;317:E899–E910. [DOI] [PMC free article] [PubMed] [Google Scholar]
- 72. de Castro GS, Simoes E, Lima JD, Ortiz‐Silva M, Festuccia WT, Tokeshi F, et al. Human cachexia induces changes in mitochondria, autophagy and apoptosis in the skeletal muscle. Cancers (Basel) 2019;11. [DOI] [PMC free article] [PubMed] [Google Scholar]
- 73. Anderson EJ, Lustig ME, Boyle KE, Woodlief TL, Kane DA, Lin CT, et al. Mitochondrial H2O2 emission and cellular redox state link excess fat intake to insulin resistance in both rodents and humans. J Clin Invest 2009;119:573–581. [DOI] [PMC free article] [PubMed] [Google Scholar]
- 74. Koves TR, Ussher JR, Noland RC, Slentz D, Mosedale M, Ilkayeva O, et al. Mitochondrial overload and incomplete fatty acid oxidation contribute to skeletal muscle insulin resistance. Cell Metab 2008;7:45–56. [DOI] [PubMed] [Google Scholar]
- 75. Debold EP. Potential molecular mechanisms underlying muscle fatigue mediated by reactive oxygen and nitrogen species. Front Physiol 2015;6:239. [DOI] [PMC free article] [PubMed] [Google Scholar]
- 76. Lamb GD, Westerblad H. Acute effects of reactive oxygen and nitrogen species on the contractile function of skeletal muscle. J Physiol 2011;589:2119–2127. [DOI] [PMC free article] [PubMed] [Google Scholar]
- 77. Sivakumar AS, Hwang I. Effects of Sunphenon and Polyphenon 60 on proteolytic pathways, inflammatory cytokines and myogenic markers in H2O2‐treated C2C12 cells. J Biosci 2015;40:53–59. [DOI] [PubMed] [Google Scholar]
- 78. Liu J, Peng Y, Wang X, Fan Y, Qin C, Shi L, et al. Mitochondrial dysfunction launches dexamethasone‐induced skeletal muscle atrophy via AMPK/FOXO3 signaling. Mol Pharm 2016;13:73–84. [DOI] [PubMed] [Google Scholar]
- 79. Max SR. Disuse atrophy of skeletal muscle: loss of functional activity of mitochondria. Biochem Biophys Res Commun 1972;46:1394–1398. [DOI] [PubMed] [Google Scholar]
- 80. Carson JA, Hardee JP, VanderVeen BN. The emerging role of skeletal muscle oxidative metabolism as a biological target and cellular regulator of cancer‐induced muscle wasting. Semin Cell Dev Biol 2016;54:53–67. [DOI] [PMC free article] [PubMed] [Google Scholar]
- 81. Zhou J, Li A, Li X, Yi J. Dysregulated mitochondrial Ca(2+) and ROS signaling in skeletal muscle of ALS mouse model. Arch Biochem Biophys 2019;663:249–258. [DOI] [PMC free article] [PubMed] [Google Scholar]
- 82. Elahi B, Laughlin RS, Litchy WJ, Milone M, Liewluck T. Neuromuscular transmission defects in myopathies: rare but worth searching for. Muscle Nerve 2019;59:475–478. [DOI] [PubMed] [Google Scholar]
- 83. Ivannikov MV, Van Remmen H. Sod1 gene ablation in adult mice leads to physiological changes at the neuromuscular junction similar to changes that occur in old wild‐type mice. Free Radic Biol Med 2015;84:254–262. [DOI] [PMC free article] [PubMed] [Google Scholar]
- 84. von Haehling S, Morley JE, Coats AJS, Anker SD. Ethical guidelines for publishing in the Journal of Cachexia, Sarcopenia and Muscle: update 2019. J Cachexia Sarcopenia Muscle 2019;10:1143–1145. [DOI] [PMC free article] [PubMed] [Google Scholar]
Associated Data
This section collects any data citations, data availability statements, or supplementary materials included in this article.
Supplementary Materials
Figure S1. Sample blots and sample activity gel. A. Sample blots for the quantitation displayed in figure 5G. B. Sample image of the activity gel ran to confirm the genotype of mice. Representative MnSod and CuZnSod enzyme activity gel in muscle, liver and brain. N of 6–8 per group was used.
Table S1: Forward and Reverse Sequences for Sybr primers.
Table S2: Statistical analysis for targeted proteomics dataset using LDA.