

Abstract
Background
Inter‐individual variance in skeletal muscle is closely related to genetic architecture and epigenetic regulation. Studies have examined genetic and epigenetic relationships with characteristics of ageing muscle separately, while no study has combined both genetic and epigenetic profiles in ageing muscle research. The aim of this study was to evaluate the association between combined genetic and methylation scores and skeletal muscle phenotypes in older women.
Methods
Forty‐eight older Caucasian women (aged 65–79 years) were included in this study. Biceps brachii thickness and vastus lateralis anatomical cross‐sectional area (ACSAVL) were measured by ultrasonography. Maximum isometric elbow flexion (MVCEF) and knee extension (MVCKE) torques were measured by a customized dynamometer. The muscle‐driven genetic predisposition score (GPSSNP) was calculated based on seven muscle‐related single nucleotide polymorphisms (SNPs). DNA methylation levels of whole blood samples were analysed using Infinium MethylationEPIC BeadChip arrays. The DNA methylation score was calculated as a weighted sum of methylation levels of sarcopenia‐driven CpG sites (MSSAR) or an overall gene‐wise methylation score (MSSNP, the mean methylation level of CpG sites located in muscle‐related genes). Linear regression models were built to study genetic and epigenetic associations with muscle size and strength. Three models were built with both genetic and methylation scores: (1) MSSAR + GPSSNP, (2) MSSNP + GPSSNP, and (3) gene‐wise combined scores which were calculated as the ratio of the SNP score to the mean methylation level of promoters in the corresponding gene. Additional models with only a genetic or methylation score were also built. All models were adjusted for age and BMI.
Results
MSSAR was negatively associated with ACSAVL, MVCEF, and MVCKE and explained 10.1%, 35.5%, and 40.1% of the variance, respectively. MSSAR explained more variance in these muscular phenotypes than GPSSNP, MSSNP, and models including both genetic and methylation scores. MSSNP and GPSSNP accounted for less than 8% and 5% of the variance in all muscular phenotypes, respectively. The genotype and methylation level of CNTF was positively related to MVCKE (P = 0.03) and explained 12.2% of the variance. The adjusted R 2 and Akaike information criterion showed that models with only a MSSAR performed the best in explaining inter‐individual variance in muscular phenotypes.
Conclusions
Our results improve the understanding of inter‐individual variance in muscular characteristics of older women and suggest a possible application of a sarcopenia‐driven methylation score to muscle strength estimation in older women while the combination with a genetic score still needs to be further studied.
Keywords: DNA methylation score, Genetic score, Older women, Model evaluation, Muscle size, Muscle strength
Introduction
Muscle mass and strength are two crucial factors in healthy ageing. 1 Older people with lower muscle mass and muscle strength are more likely to have a greater loss of mobility 2 and an increased risk of falls. 3 A 10‐year follow‐up study by Balogun et al. 4 found that lower limb muscle mass and muscle strength in older people were positively associated with health‐related quality of life.
Many heritability studies have shown a genetic contribution to body composition and muscle strength in older adults. An early twin study on postmenopausal women demonstrated that genetic characteristics account for 52%, 46%, and 30% of the variance in lean body mass, leg extensor strength, and grip strength, respectively. 5 An older male twin study conducted by Carmelli et al. 6 showed a decreased genetic association with handgrip strength from 35% to 22% over a 10‐year ageing process while the environmental influence increased from 39% to 45%. Furthermore, multiple association studies on athletes, young, and old populations have suggested some genetic variants that are closely related to body composition and muscle performance. For example, the D allele of the ACE I/D polymorphism is related to higher muscle strength. 7 Older people with the ACE DD genotype tend to have greater lean body mass and knee extensor strength than II carriers. 8 The R allele of the ACTN3 R/X polymorphism is also associated with greater muscle power. 9 Young people with the R allele had significantly higher knee strength and more type IIx fibres than those of XX genotype. 10 The T allele in FTO A/T polymorphism is predisposed to increase lean body mass and is more prevalent in elite rugby players, who rely more on appendicular lean mass for success, than other rugby athletes and non‐athletes. 11
To study the combined genetic association with physical phenotypes, a phenotype‐driven genetic predisposition score (GPS), which is calculated by adding up the number of predisposing alleles that are positively related to the corresponding phenotype, has been introduced by Williams and Folland. 12 With the application of the phenotype‐driven GPS, studies have been able to analyse associations between genetic architectures and physical performance based on multiple polymorphisms. Spanish athletes in endurance activities (e.g. running, road cycling, and rowing) were found with a higher endurance‐driven GPS than the general population. 13 , 14 Coronary artery disease patients 15 and older people 16 with higher muscle mass/strength‐driven GPS also demonstrated greater muscular improvement after resistance training.
Besides the genetic aspect, muscular phenotypes are also related to multiple external factors such as physical activity and nutrients, 1 which might affect muscle‐related gene expression through epigenetic regulation. 17 , 18 As a link between environment and genes, an epigenetic regulation modifies gene expression through several mechanisms, among which DNA methylation is the one that has been extensively studied. In the human genome, DNA methylation occurs almost exclusively at the 5′ position of cytosine in cytosine‐phosphate‐guanine (CpG) dinucleotides. 19 Many factors such as age, lifestyle, and nutrition can trigger DNA methylation changes. 20 DNA methylation in gene promoters is usually associated with a repression of corresponding gene expression, 21 while a recent study by Jeziorska et al. 22 has suggested a positive association between the CpG island methylation in intragenic regions and transcriptional activity. Because DNA methylation is a reflection of environmental exposures and gene expression status, methylation levels of several CpG sites have been suggested as biomarkers for cancer screening 23 and chronological age prediction. 24 A BMI‐related epigenetic score developed by Hamilton et al. 25 was found to be associated with body mass, aerobic capacity, type 2 diabetes, and cardiovascular disease. The accuracy and sensitivity of diagnostic 26 and prognostic 27 prediction of prostate cancer were also improved with the assistance of DNA methylation scores. Wei et al. 28 built a predictive model for clear cell renal cell carcinoma prognosis based on the methylation of five CpG sites and the model presented reliable predictions across several cohorts. Moreover, DNA methylation scores of specific CpG sites were introduced to the prediction of maternal smoking habit during pregnancy with high accuracy. 29
In skeletal muscle, epigenetic regulation can be found in development and differentiation processes. The expression of genes from the myogenic regulatory factor and the myocyte enhancer factor families partly rely on DNA methylation to modify skeletal muscle proliferation and differentiation. 30 Meanwhile, some epigenetic traits induced by enviromental stimuli can be maintained for a considerable period (e.g. 30 population doublings of cell culture, 31 7 weeks of detraining 32 ), a phenomenon known as ‘epigenetic memory’. 33 A recent study by Seaborne et al. 32 suggested four genes (RPL35a, UBR5, SETD3, and PLA2G16) that held epigenetic memory 7 weeks after resistance training. All these four genes were characterized by a similar pattern of decreased gene expression with DNA hypermethylation during detraining and dramatically enhanced gene expression with DNA hypomethylation after retraining. 32 Turner et al. 34 demonstrated five genes (FLNB, MYH9, SRGAP1, SRGN, and ZMIZ1) with increased gene expression in the acute/chronic resistant training and retained hyopmethylation status during 7 weeks of detraining, indicating an involvment of these five genes in epigenetic regulation of skeletal muscle characteristics. Lifelong regular physical activity is also associated with hypomethylated promoter regions in genes related to energy metabolism, myogenesis, and oxidative stree resistance in ageing muscle. 35 Notably, most methylation studies of skeletal muscle focus on identifying genes with various methylation changes under different intervention phases or between different populations, but the relationship between methylation levels and muscular phenotypes has not been reported.
Several studies have combined genetic and epigenetic profile scores to explore hereditary and environmental associations with physical conditions such as BMI and heart disease risk. Shah et al. found that regression models with only BMI‐derived genetic or methylation scores explained less than 10% of the inter‐individual variance in BMI, while a model combining both scores improved the explained variance to 13–18%. 36 Another model with integrated genetic and methylation scores also outperformed (13% more accuracy) conventional risk factors in predicting coronary heart disease. 37 Such an approach of combined genetic and epigenetic scores suggests a new approach of studying inter‐individual variance and long‐term changes in muscle mass and muscle strength. A better understanding of genetic and epigenetic associations with muscular phenotypes can be beneficial to healthy ageing via improved estimation of the probability of muscle degeneration and thus prediction of frailty and sarcopenia. Therefore, our study was conducted to explore possible genetic and epigenetic connections with muscular phenotypes in a group of older women.
Methods
Participants
Genetic and epigenetic data of 48 older women (aged 65–79 years) were analysed in this study. These participants were conditionally selected from 247 independently living Caucasian women (aged 65–80 years) around Manchester Metropolitan University (Crewe, UK), which has been described in details in our previous paper. 38 Briefly, these 48 participants were generally age‐matched with no muscular or nervous system problems that would affect their physical performance. With cut‐off points of both skeletal muscle index (SMI) less than 6.75 kg/m2 39 and hand grip strength (HGS) less than 26 kg (the lower quintile of HGS in all recruited 247 participants), 24 participants were classified as sarcopenic (SMI: 6.00 ± 0.47 kg/m2, HGS: 23.2 ± 2.5 kg), and the remaining 24 participants were classified as non‐sarcopenic (SMI: 7.45 ± 0.67 kg/m2, HGS: 36.0 ± 3.7 kg). This study followed local ethics approval (Manchester Metropolitan University, Crewe, UK) and consent forms were signed by all participants.
DNA extraction
A 5 mL venous blood sample was collected from each participant and stored in an EDTA‐coated tube at −20°C for DNA extraction. DNA samples were extracted using a QIAcube® and QIAamp® DNA Blood Mini Kit (Qiagen, Crawley, UK) according to the manufacturer's instructions. The extracted DNA samples were stored at −20°C for genotyping and DNA methylation analysis.
Genotyping
Single nucleotide polymorphisms (SNPs) of seven genes were selected for genotyping. These SNPs have been reported in at least three papers as being related to muscle strength or muscle mass with a consistent direction of favourable alleles (Table S1). Duplicate genotyping was firstly made using a 192.24 Dynamic Array® IFC (Fluidigm Corp., South San Francisco, CA, US) and TaqMan SNP genotyping assays (Applied Biosystems, Paisley, UK) following the manufacturer's instructions. Briefly, a genotyping mix (4 μL) consisted of 2 μL assay loading reagent [2X] (Fluidigm), 1 μL SNP genotyping Assay Mix [40X] (Applied Biosystems), 0.2 μL ROX [50X] (Invitrogen, Carlsbad, CA, US), and 0.8 μL DNA‐free water (Qiagen). A sample mix (4 μL) contained 1.6 μL DNA samples, 2.0 μL GTXpress master mix [2X] (Applied Biosystems, PN 4401892), 0.2 μL Fast GT Sample Loading Reagent [20X] (Fluidigm, PN 100–3,065), and 0.2 μL DNA‐free water. All reaction mixes (7.75 μL, consisting of 3.75 μL genotyping mix and 4 μL sample mix) were loaded onto the Dynamic Array IFC following the manufacturer's instructions. The array was subsequently placed into a thermal cycler (FC1 Fluidigm, PN 100–1279 D1), and the GT 192.24 Fast v1.pcl protocol was performed. The thermal cycling protocol included an amplification at 95°C for 120 s followed by 45 cycles of denaturation for 2 s at 95°C and extension for 20 s at 60°C. Reporter dyes VIC and FAM were used for genotyping based on fluorescence detection.
About 1% of SNP‐sample data points showed unsuccessful detection or inconsistent genotype results using the Fluidigm system. These SNP samples were reassessed in duplicates using a StepOnePlus Real‐Time PCR system with TaqMan SNP genotyping assays and analysed using StepOnePlus analysis software (Applied Biosystems, version 2.3). The StepOnePlus reaction mix (10 μL) included 0.2 μL DNA sample, 5 μL GTXpress master mix, 4.3 μL nuclease‐free water, and 0.5 μL TaqMan SNP genotyping assay [20X]. Each reaction mix was amplified for 20 s at 95°C, followed by 50 cycles of denaturation for 3 s at 95°C and extension for 20 s at 60°C. Genotypes were identified based on fluorescence detection of reporter dyes (VIC and FAM).
DNA methylation analysis
DNA methylation was measured using Illumina® Infinium MethylationEPIC BeadChip arrays (Illumina Inc., San Diego, CA, US) at the Genomics Core facility (Center for Human Genetics, UZ/KU Leuven, Leuven, Belgium). Methylation signal data were read by R ‘Minfi’ package, 40 background signals were corrected by normal‐exponential out‐of‐band (‘Noob’) method, and methylation levels (defined as β values, methylation percentages at measured probes) were normalized for blood cell composition by R ‘FlowSorted.Blood.EPIC’ package. CpG sites were removed from the initial measurement under the following conditions: (i) with a low detection rate (P > 0.01 compared with background signal); (ii) containing SNPs at the CpG interrogation or at the single nucleotide extension as suggested in the ‘Minfi’ package (reference array: ‘Illumina Human Methylation EPIC’, annotated by ‘ilm10b4.hg19’); (iii) with cross‐reactivity reported in the first supplementary table of Pidsley's study. 41 A final 788 074 CpGs were kept for further analysis.
Muscular parameters
Biceps brachii thickness
B‐mode ultrasonography (7.5 MHz, linear array probe, 38 mm probe length, MyLab®Twice Esaote, Genoa, Italy) was used to measure biceps brachii (BB) thickness (THKBB) on the dominant side (Figure S1a). Participants sat with elbows extended and relaxed. Sagittal plane scans were taken and muscle thickness measured at three sites: 60% of the length from the acromion process of the scapula to the lateral epicondyle of the humerus 42 and the upper and lower sites 1 cm away from the 60% length site. Muscle thickness was measured using an image processing program (ImageJ, NIH) by the same investigator [intraclass correlation coefficient (ICC) = 0.98, based on duplicate measurements of six participants. The interrater reliability was based on a single scan assessed on two occasions. The following ICC tests were all based on the same participants]. The mean muscle thickness of the three sites was recorded as THKBB.
Vastus lateralis anatomical cross‐sectional area
With participants in a standing position, the vastus lateralis (VL) origin and insertion were identified at the proximal and distal myotendinous junction under the previously mentioned ultrasound. The VL anatomical cross‐sectional area (ACSAVL) was measured using an ultrasonography method developed by Reeves et al. 43 with a high reliability and validity compared with magnetic resonance imaging. In brief, participants sat while axial plane scans were taken at 50% muscle length of the VL and recorded in real time, with the ultrasound probe passing over echo‐absorptive markers placed over the skin of the VL (as described by Reeves 43 ). The acquired images were combined for ACSAVL measurement (Figure S1b). The ACSAVL was measured three times using ImageJ, and the mean value was recorded for further analysis. The ultrasound scan was made by the same investigator with good test consistency (ICC = 0.99).
Maximum isometric elbow flexion torque
Maximum isometric elbow flexion torque (MVCEF) on the dominant side was recorded using a customized dynamometer (MMU, UK), which was calibrated using loads of 0.5–5 kg (with 0.5 kg increments) prior to each strength measurement session. Participants were tested in a seated position with the upper arm parallel to the trunk and the elbow flexed at 60° (0° representing full extension). Participants were asked to hold a force transducer (connected to the dynamometer) and contract their elbow flexors with full effort. Verbal encouragement was given during the test. Three trials were performed with 1 min rest between each trial (ICC = 0.95), with the highest MVCEF used for analysis. Elbow force was recorded at 1000 Hz and analysed offline at a later date (Labview, National Instruments, Newbury, UK). MVCEF was calculated by the formula: MVCEF = Elbow force × Radius length × cos(30°) with force in N and length in metres.
Maximum isometric knee extension torque
Maximum isometric knee extension torque (MVCKE) on the dominant side was recorded using the same system as that used in MVCEF measurement. Participants were tested in a seated position with 60° knee flexion (0° representing full extension). The tested leg was fastened to a force transducer placed 5 cm above the lateral malleolus. Participants were instructed to extend the fastened leg, and verbal encouragement was given during the measurement. Three trials were performed with 1 min break between each trial (ICC = 0.96), with the highest MVCKE used for analysis. Knee force was recorded at 1000 Hz and analysed offline at a later date (Labview, National Instruments, Newbury, UK). MVCKE was calculated by the formula: MVCEF = Knee force × (Tibia length – 0.05) × cos(30°) with force in N and length in metres.
Statistics, model building, and model evaluation
Statistics
SAS 9.4 (SAS Institute, Cary, NC, US) and Python (version 3.7.3) were used for data management and data analysis. Comparisons of muscular phenotypes and methylation scores between the sarcopenic and non‐sarcopenic groups were made using independent t‐tests. Fisher's exact test was used to compare the distribution of GPS between the two groups. To study combined genetic and epigenetic associations with skeletal muscle, three linear regression models (Models 1–3, Figure 1) were built with muscular phenotypes (THKBB, ACSAVL MVCEF, and MVCKE) as dependent variables and genetic and epigenetic scores as independent variables. Linear models (Models 4–6) with only a genetic or methylation score were also built to study the single genetic or methylation association with muscular phenotypes. All models were adjusted for age and BMI. Data are presented as mean and standard deviation.
FIGURE 1.
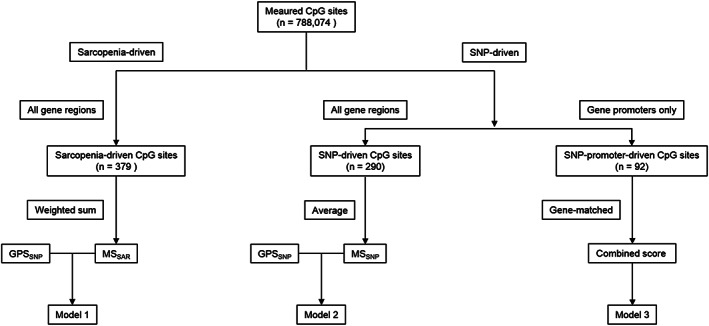
Workflow for model building (Model 1–3).
Model building
-
Model 1:
muscular phenotypes ∼ sarcopenia‐driven methylation score (MSSAR) + muscle‐driven genetic predisposition score (GPSSNP)
This model aimed to analyse the association between muscular phenotypes, muscle‐related genetic architecture and sarcopenia‐driven methylation levels using a muscle‐driven genetic score and a sarcopenia‐driven methylation score as independent variables. The least absolute shrinkage and selection operator (LASSO) logistic regression was used for sarcopenia‐driven CpG sites selection. The LASSO method combines a linear regression with a L1 penalty on independent variable coefficients to improve prediction accuracy and reduce overfitting. 44 Through a shrinkage parameter tuning, the LASSO method aims to minimize residual sum of squares by setting some coefficients of independent variables to zeros. 44 Therefore, the LASSO method is a powerful tool of selecting strong independent variables from a large set of candidate variables when the amount of independent variables greatly outnumbers the amount of observations. 44 Cross validation is usually used to find an optimal shrinkage parameter.
In the current study, the sarcopenia status was used as the dependent variable (sarcopenia coded as 1 and non‐sarcopenia coded as 0) and the methylation levels (β values) at measured CpG sites were used as independent variables. A six‐fold cross validation (with the log loss score, the accuracy score and the F1 score as metrics) was used for shrinkage parameter tuning (Figure S2, Supplementary Table S2A). The sarcopenia‐driven LASSO regression with an optimal shrinkage parameter selected CpGs (with non‐zero coefficients) that were strongly associated with sarcopenia status. The MSSAR was calculated as a weighted sum of the selected CpG methylation levels (the weight for each CpG site was the coefficient from the LASSO regression, Supplementary Table S2B, codes in Supplementary File 1). The ‘gene symbols’ of selected CpG sites were further analysed by gene ontology (GO) and KEGG analysis (databases until June 2019) using Partek Genomics Suite V.7.18 (Partek Inc., St. Louis, MO, US) (‘HumanMethylation850’ reference, ‘MethylationEPIC_v‐1‐0_B4’ annotation file, ‘Homo sapiens’ species and hg19 genome build) with a false discovery rate (FDR) control at 0.05.
A summed score of the seven muscle‐related SNPs (Table S1) was calculated as GPSSNP. Each SNP score was represented by the number of muscle‐favourable alleles. For example, the C allele is a muscle‐favourable allele in the ACTN3 rs1815739. Therefore, the SNP score of the ACTN3 rs1815739 is 2 for a CC genotype, 1 for a CT genotype and 0 point for a TT homozygote.
-
Model 2:
muscular phenotypes ∼ SNP‐driven methylation score (MSSNP) + GPSSNP
To evaluate the association between muscle‐related genes and muscular phenotypes, this model only included genetic and methylation scores within genes where the seven muscle‐related SNPs locate (Table S2C). Because each muscle‐related gene contained different amounts of measured CpGs, the mean methylation level of each gene was firstly calculated and the MSSNP was later calculated as the mean of the mean methylation levels of the seven muscle‐related genes. Using ni to represent the number of measured CpGs in the ith gene, to represent the methylation level of the jth measured CpG in the ith gene, then the calculation of the MSSNP can be represented as:
-
Model 3:
muscular phenotypes ∼ seven gene‐wise combined genetic and methylation scores
This model examined each of the seven selected muscle‐related gene and studied its association with muscular phenotypes by building a gene‐wise combined genetic and methylation profile score. In this model, a methylation score was calculated as the mean methylation level of promoters in each gene because, compared to other gene regions, increased methylation in gene promoters has been more strongly associated with a repression of gene expression. 21 The gene‐wise combined score was later calculated as the ratio of a SNP score to the mean methylation level in promoters of the corresponding gene (Table S2D) so that a participant with a higher SNP score and a lower methylation score would have a higher gene‐wise combined score. For instance, there were five measured CpG sites located in the promoters of MSTN. Given that one participant has a MSTN SNP (rs1805086) score of 2 and a mean methylation level of 0.32 at the five CpG sites located in MSTN promoters, the MSTN‐wise combined score will be 6.26; if another participant has a MSTN SNP score of 1 and a mean promoter methylation level of 0.4, then the MSTN‐wise combined score will be 2.5. Similar calculations were carried out in the other six genes and therefore, there were seven gene‐wise combined scores (representing each of the seven muscle‐related genes) as independent variables in Model 3.
-
Model 4:
muscular phenotypes ∼ MSSAR
This model only studied the association between the sarcopenia‐driven methylation and muscular phenotypes.
-
Model 5:
muscular phenotypes ∼ MSSNP
This model only studied the association between the methylation of muscle‐related genes and muscular phenotypes.
-
Model 6:
muscular phenotypes ∼ GPSSNP
This model only studied the association between the muscle‐related genetic architecture and muscular phenotypes.
Model interpretation and evaluation
Adjusted coefficient of determination (R 2) was used to interpret the explained variance in muscular phenotypes by each linear model. Because a model with more independent variables usually has a higher R 2, the adjusted R 2 is introduced as a modification of the R 2 controlled for the number of independent variables in the corresponding model. In this study, a partial R 2 was also used to illustrate the phenotype variance that an independent variable accounted for in a linear model. The Akaike information criterion (AIC) was used to evaluate the quality of each model with the same muscular phenotype as the dependent variable. The AIC assesses the relative amount of information lost by a given model; 45 therefore, the model with the smallest AIC will be the best model (among all candidate models). Empirically, if another model has an AIC value that is less than two units from the smallest AIC, then that model also has considerable ability to explain variability in the corresponding dependent variable. In that case, more data are needed for model evaluation or a combined model should be created for a better prediction. 46
Results
Characteristics of participants
Descriptive characteristics of participants are presented in Table 1. Participants in the sarcopenic group had lower body mass (P = 0.003) and BMI (P = 0.005) than the non‐sarcopenic group. Values of muscular phenotypes in the sarcopenic group were lower (P < 0.001) than in the non‐sarcopenic group, except for THKBB (P = 0.283).
TABLE 1.
Characteristics of participants (n = 48)
| Participants | Age (year) | Body mass (kg) | Height (m) | BMI (kg/m2) | HGS (kg) | SMI (kg/m2) | THKBB (cm) | ACSAVL (cm2) | MVCEF (N·m) | MVCKE (N·m) |
|---|---|---|---|---|---|---|---|---|---|---|
| Total (n = 48) | 71 ± 4 | 66.6 ± 12.3 | 1.59 ± 0.06 | 26.2 ± 4.5 | 29.6 ± 7.1 ** | 6.72 ± 0.93 ** | 1.82 ± 0.35 | 16.4 ± 3.9 | 25.0 ± 5.8** | 58.8 ± 19.9* |
| Sarcopenic (n = 24) | 73 ± 4 | 61.5 ± 9.4 ** | 1.56 ± 0.11 | 24.4 ± 3.4 ** | 23.2 ± 2.5 ** | 6.00 ± 0.47 ** | 1.76 ± 0.38 | 14.3 ± 3.0** | 21.2 ± 4.8** | 44.9 ± 10.2* |
| Non‐sarcopenic (n = 24) | 70 ± 3 | 71.7 ± 12.8 | 1.60 ± 0.05 | 28.0 ± 4.9 | 36.0 ± 3.7 | 7.45 ± 0.67 | 1.88 ± 0.33 | 18.2 ± 3.7 | 28.7 ± 4.1 | 71.0 ± 18.3 |
Lower than non‐sarcopenic group (P < 0.05).
Lower than non‐sarcopenic group (P < 0.01).
Comparisons of methylation scores are presented in Table 2. The sarcopenic group had a higher MSSAR than the non‐sarcopenic group (P < 0.001, Figure 2A), and the combined genetic and methylation score in VDR was lower in the sarcopenic group (P = 0.02). The mode and median values of GPSSNP were both 9 in the non‐sarcopenic group, and the mode and median values of GPSSNP in the sarcopenic group were 7 and 8, respectively. Fisher's exact test for the distribution of GPSSNP between the sarcopenic and non‐sarcopenic group showed no difference (P = 0.67, Figure 2C).
TABLE 2.
Description of genetic and methylation profile scores in different groups.
| Participants | MSSAR | MSSNP | Gene‐wise combined genetic and methylation scores | ||||||
|---|---|---|---|---|---|---|---|---|---|
| ACTN3_combined | ACE_combined | CNTF_combined | FTO_combined | HIF1A_combined | MSTN_combined | VDR_combined | |||
| Total (n = 48) | 0.02 ± 5.26 # | 0.64 ± 0.01 | 7.27 ± 5.78 | 2.73 ± 1.73 | 2.14 ± 0.46 | 3.73 ± 2.88 | 1.02 ± 2.15 | 2.16 ± 0.02 | 5.43 ± 2.93 |
| Sarcopenic (n = 24) | 5.21 ± 0.53 # | 0.64 ± 0.01 | 7.53 ± 6.02 | 2.68 ± 1.59 | 2.12 ± 0.49 | 3.90 ± 3.06 | 0.91 ± 2.08 | 2.16 ± 0.02 | 4.46 ± 2.93* |
| Non‐sarcopenic (n = 24) | −5.17 ± 0.37 | 0.64 ± 0.01 | 7.01 ± 5.65 | 2.78 ± 1.88 | 2.16 ± 0.44 | 3.55 ± 2.73 | 1.13 ± 2.26 | 2.16 ± 0.02 | 6.39 ± 2.65 |
Lower than non‐sarcopenic group (P < 0.05).
Greater than non‐sarcopenic group (P < 0.01).
FIGURE 2.
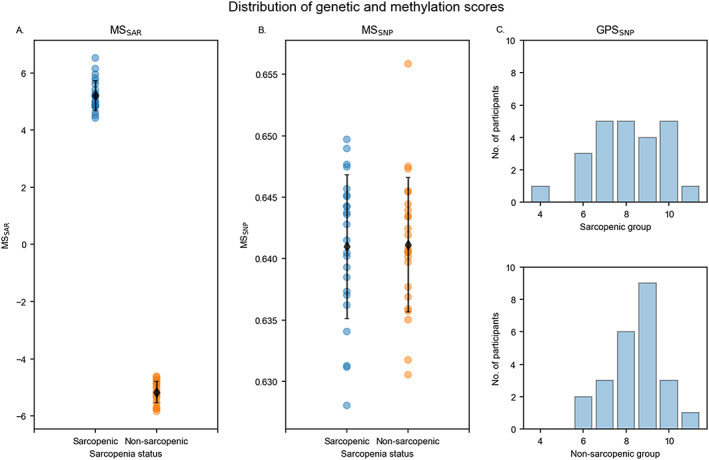
Distribution of genetic and methylation profile scores. (A) MSSAR based on CpGs selected by sarcopenia‐driven LASSO regression is higher in the sarcopenic than the non‐sarcopenic group (p < 0.01). Black diamond markers represent the mean MSSAR in each group. (B) MSSNP is not different between the sarcopenic and non‐sarcopenic groups (p = 0.96). (C) Fisher's exact test for the distribution of GPSSNP showed no difference between the sarcopenic and non‐sarcopenic group (p = 0.67).
CpG sites selected from the sarcopenia‐driven LASSO logistic regression
Three hundred seventy‐nine CpG sites were selected from the sarcopenia‐driven LASSO logistic regression, indicating a possible association between these CpGs and sarcopenia. These selected CpGs located in 190 genes, with the PIWIL1 gene contributing most (n = 4) CpGs (Table S3A). GO analysis on the identified genes showed that 29 GO terms were enriched after FDR control (q value <0.05, Table S3B). Many of these GO terms were associated with protein binding (e.g. antigen binding and cell adhesion), MHC protein complex, signal transduction (e.g. receptor binding and transport vesicle membrane), and synapse structure (e.g. synapse assembly and synapse organization). The most enriched GO term was the ‘peptide antigen binding’ term (q value = 0.002), which included four hypermethylated (higher methylation in the sarcopenic group than non‐sarcopenic group) CpGs and three hypomethylated (lower methylation in the sarcopenic group) CpGs (Table S3C). KEGG analysis showed 46 pathways that were enriched (q value <0.05, Table S3D). Many pathways were related to immune system function (e.g. allograft rejection and T helper cells differentiation) and diseases (e.g. autoimmune thyroid disease and viral myocarditis), and chronic disorders (e.g. type I diabetes mellitus and rheumatoid arthritis). The most enriched pathway was the ‘Asthma’ pathway with three hypermethylated CpGs and four hypomethylated CpGs (Table S3E).
Muscular phenotypes with genetic and methylation scores
Main results of linear regression models with both genetic and methylation scores are presented in Table 3 (complete results in Table S4). In Model 1, the MSSAR was negatively related to MVCEF and MVCKE (P < 0.01) and explained 33.2% and 39.4% of the variance, respectively. With one unit increase in the MSSAR, MVCEF and MVCKE decreased by 0.67 and 2.63 N·m, respectively. The GPSSNP was not significantly associated with any muscular phenotypes. In Model 2, neither the MSSNP nor the GPSSNP was significantly correlated to muscular phenotypes. In Model 3, only the combined genetic and methylation score in the CNTF was positively related to MVCKE (P = 0.03) and explained 12.2% of the MVCKE variance. A one‐score addition in the CNTF combined score was associated with 15.7 N·m increase in MVCKE.
TABLE 3.
Main results of linear models (Models 1–3) with combined genetic and methylation scores
| Model 1 | Model 2 | Model 3 | |||||||||
|---|---|---|---|---|---|---|---|---|---|---|---|
| MSSAR | GPSSNP | Age | BMI | MSSNP | GPSSNP | Age | BMI | CNTF_combined | Age | BMI | |
| THKBB | |||||||||||
| Coef | <0.01 | −0.01 | 0.03 | 0.04 | −16.47 | −0.02 | 0.04 | 0.04 | 0.09 | 0.03 | 0.04 |
| Partial R 2 | 0.002 | 0.003 | 0.145 | 0.201 | 0.080 | 0.007 | 0.198 | 0.270 | 0.017 | 0.142 | 0.258 |
| P | 0.76 | 0.74 | 0.01 | <0.01 | 0.07 | 0.60 | <0.01 | <0.01 | 0.44 | 0.02 | <0.01 |
| ACSAVL | |||||||||||
| Coef | −0.16 | 0.16 | −0.02 | 0.57 | −97.93 | 0.26 | −0.02 | 0.64 | 1.33 | −0.04 | 0.73 |
| Partial R 2 | 0.080 | 0.008 | 0.001 | 0.499 | 0.041 | 0.023 | 0.001 | 0.591 | 0.052 | 0.004 | 0.614 |
| P | 0.07 | 0.56 | 0.89 | <0.01 | 0.20 | 0.34 | 0.84 | <0.01 | 0.18 | 0.72 | <0.01 |
| MVCEF | |||||||||||
| Coef | −0.67 | 0.29 | −0.05 | 0.08 | −23.51 | 0.78 | −0.27 | 0.37 | 2.02 | −0.24 | 0.42 |
| Partial R 2 | 0.332 | 0.009 | 0.001 | 0.006 | 0.001 | 0.042 | 0.033 | 0.086 | 0.023 | 0.026 | 0.094 |
| P | <0.01 | 0.55 | 0.81 | 0.62 | 0.88 | 0.18 | 0.23 | 0.05 | 0.36 | 0.33 | 0.06 |
| MVCKE | |||||||||||
| Coef | −2.63 | −0.37 | −0.58 | −0.53 | 193.22 | 1.56 | −1.30 | 0.72 | 15.68 | −0.99 | 1.70 |
| Partial R 2 | 0.394 | 0.001 | 0.019 | 0.021 | 0.003 | 0.014 | 0.053 | 0.028 | 0.122 | 0.042 | 0.142 |
| P | <0.01 | 0.82 | 0.38 | 0.36 | 0.74 | 0.45 | 0.14 | 0.29 | 0.03 | 0.22 | 0.02 |
Results of linear models with only a genetic/methylation score are presented in Table 4 (complete results in Table S4). The MSSAR alone (Model 4) was negatively associated with ACSAVL, MVCEF, and MVCKE, and explained 10.1%, 35.5%, and 40.1% of the variance, respectively. The MSSNP and GPSSNP were not associated with any muscular phenotypes. Specifically, the MSSNP explained less than 8% of the variance in muscle size and less than 1% of the variance in muscle strength. The GPSSNP accounted for less than 5% of the variance in all muscular phenotypes.
TABLE 4.
Main results of linear models (Models 4–6) with only genetic or methylation scores
| Model 4 | Model 5 | Model 6 | |||||||
|---|---|---|---|---|---|---|---|---|---|
| MSSAR | Age | BMI | MSSNP | Age | BMI | GPSSNP | Age | BMI | |
| THKBB | |||||||||
| Coef | <0.01 | 0.03 | 0.04 | −15.80 | 0.04 | 0.04 | −0.01 | 0.03 | 0.04 |
| Partial R 2 | 0.001 | 0.147 | 0.211 | 0.075 | 0.194 | 0.272 | 0.002 | 0.147 | 0.248 |
| P | 0.82 | 0.01 | <0.01 | 0.07 | <0.01 | <0.01 | 0.80 | 0.01 | <0.01 |
| ACSAVL | |||||||||
| Coef | −0.17 | <0.01 | 0.57 | −107.42 | <0.01 | 0.64 | 0.31 | −0.07 | 0.64 |
| Partial R 2 | 0.101 | <0.001 | 0.496 | 0.048 | <0.001 | 0.583 | 0.031 | 0.009 | 0.579 |
| P | 0.04 | 1.00 | <0.01 | 0.16 | 0.98 | <0.01 | 0.26 | 0.54 | <0.01 |
| MVCEF | |||||||||
| Coef | −0.69 | −0.02 | 0.06 | −51.35 | −0.22 | 0.34 | 0.79 | −0.28 | 0.37 |
| Partial R 2 | 0.355 | <0.001 | 0.004 | 0.003 | 0.022 | 0.074 | 0.044 | 0.036 | 0.087 |
| P | <0.01 | 0.90 | 0.69 | 0.73 | 0.33 | 0.07 | 0.17 | 0.21 | 0.05 |
| MVCKE | |||||||||
| Coef | −2.60 | −0.61 | −0.51 | 115.81 | −1.17 | 0.68 | 1.45 | −1.21 | 0.72 |
| Partial R 2 | 0.401 | 0.022 | 0.020 | 0.001 | 0.044 | 0.026 | 0.013 | 0.051 | 0.029 |
| P | <0.01 | 0.34 | 0.37 | 0.84 | 0.18 | 0.31 | 0.47 | 0.15 | 0.28 |
Explained variance of muscular phenotypes by the six models are presented in Table 5. Model 1 with both the MSSAR and GPSSNP explained less phenotype variance than Model 4, which included only an MSSAR, and more variance in muscle strength than Model 6, which included only a GPSSNP. Model 2 with the MSSNP and GPSSNP explained less variance in muscle size than Model 5. When compared with Model 6, Model 2 explained more variance in muscle size but less variance in muscle strength. Models with an MSSAR (Models 1 and 4) explained more variance in muscle strength (MVCEF and MVCKE) than models without MSSAR. When comparing models with genetic and methylation profile scores within the preselected seven muscle‐related genes, Model 3 explained less variance than Model 2 in all muscular phenotypes except for MVCKE. Notably, the explained variance in muscle size (THKBB and ACSAVL) was similar across all models. This was possibly because BMI was closely related to muscle size and explained a considerable percentage (20.1% to 61.4%) of the variance (Tables 3 and 4).
TABLE 5.
Adjusted R 2 and AIC of linear models
| Model 1 | Model 2 | Model 3 | Model 4 | Model 5 | Model 6 | |
|---|---|---|---|---|---|---|
| THKBB | ||||||
| Adj R 2 | 0.240 | 0.299 | 0.255 | 0.256 | 0.311 | 0.256 |
| AIC | −103.5 | −107.2 | −100.4 | −105.4 | −108.9 | −105.4 |
| ACSAVL | ||||||
| Adj R 2 | 0.585 | 0.568 | 0.561 | 0.592 | 0.568 | 0.560 |
| AIC | 86.4 | 88.3 | 92.9 | 84.8 | 87.3 | 88.1 |
| MVCEF | ||||||
| Adj R 2 | 0.371 | 0.060 | −0.013 | 0.380 | 0.042 | 0.081 |
| AIC | 148.4 | 167.3 | 174.8 | 146.8 | 167.3 | 165.3 |
| MVCKE | ||||||
| Adj R 2 | 0.392 | <.001 | 0.112 | 0.406 | 0.010 | 0.021 |
| AIC | 251.4 | 273.8 | 272.5 | 249.5 | 272.5 | 272.0 |
In the aspect of model evaluation, Model 5, which included only an MSSNP, explained the most variance in THKBB (with the highest adjusted R 2 value) and outperformed other models in the prediction of THKBB (with the lowest AIC value). Model 4, which includes only an MSSAR, explained the most variance in ACSAVL, MVCEF, and MVCKE (with the highest adjusted R 2 values), and performed better than other models in the prediction of those muscular phenotypes (ACSAVL, MVCEF, and MVCKE) (with the lowest AIC values). Notably, the AIC differences were smaller than two between Models 2 and 5 (in THKBB), and Models 1 and 4 (in ACSAVL, MVCEF, and MVCKE), indicating that more data might be needed before deciding if GPSSNP should be included into a model.
Correlation and regression analysis on actual and predicted muscle size values inferred by Model 4
As Model 4 is the most powerful model in predicting muscular phenotypes than the rest models in Table 5, correlation analysis was made between actual and predicted muscle size inferred by Model 4. Moderate correlations ranging between 0.55 and 0.79 were found (Figure 3, Supplementary Table 4F).
FIGURE 3.
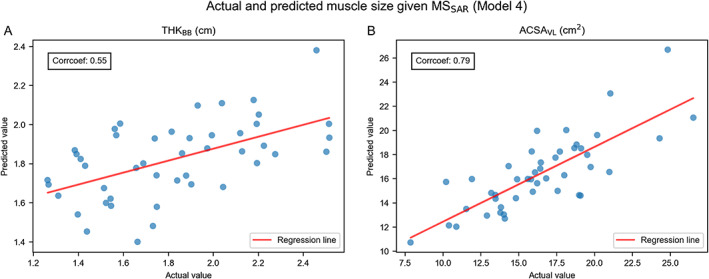
Plots of actual and predicted muscle size inferred by Model 4. (A) Actual and predicted THKBB values are moderately correlated (r = 0.55). (B) Actual and predicted ACSAVL values are moderately correlated (r = 0.79).
Discussion
The current study explored the association between muscular phenotypes, genetic architecture, and DNA methylation via linear regression models in sarcopenic and non‐sarcopenic elderly women. Genetic architecture was represented as a GPS that was calculated from seven muscle‐related SNPs. The DNA methylation was represented as either a sarcopenia‐driven methylation score, which was calculated as a weighted sum of the methylation levels of 379 sarcopenia‐driven CpG sites, or a gene‐wise methylation score, which was calculated as an average of the methylation levels within muscle‐related genes. Based on the six linear models used in this study, the sarcopenia‐driven methylation score was negatively related to ACSAVL, MVCEF, and MVCKE, and explained more variance in these muscular phenotypes than the GPS, the gene‐wise methylation score and the models with combined genetic and methylation scores. The adjusted R 2 and AIC showed that models with only a methylation score had the best performance in explaining inter‐individual variance in muscular phenotypes while more data are needed to determine the inclusion of GPS into the models. Moreover, the model with gene‐wise combined genetic and methylation scores demonstrated that the genotype and methylation level in CNTF was closely related to knee extensor strength, indicating a close association between CNTF and knee strength.
Sarcopenia‐driven CpG sites
DNA methylation changes have been examined in studies of ageing and resistance training, but no study has reported the DNA methylation association with sarcopenia. Using the sarcopenia‐driven LASSO logistic regression, our study identified 379 CpG sites that were possibly related to sarcopenia. Zykovich et al. 24 identified 5963 CpG sites that were related to ageing based on skeletal muscle tissue. Bell et al. 47 found 490 ageing‐associated CpGs from blood samples. However, none of those ageing‐related CpGs were found among the sarcopenia‐driven CpGs identified in our study. Seaborne et al. studied DNA methylation changes in skeletal muscle during resistance training and identified 2445 CpG sites that were differentially methylated after a 7‐week loading stimuli and 1883 CpGs that were association with an unloading phase. We shared one CpG site in each of the loading and unloading phase, with both CpGs located in the intergenic region (Table S5A). We further compared our CpGs with those identified by Turner et al., 34 who analysed transcriptome and methylome associations after acute/chronic resistance training, but no common CpG was found. Notably, Turner et al. reported three genes (ETF1, ETV1, and SH3KBP1) that were up‐regulated after acute/chronic resistance training 34 while some hypermethylated sarcopenia‐driven CpGs identified in our study were found to locate in promoter regions of those three genes (Tables S5B,C, S3 ).
The gene ETF1 is a member of the human transcriptional enhancer family. Recent research on human liver HepG2 cell line showed that the ETF1 gene was involved in the regulation of transcript stability. 48 The gene ETV1 is involved in multiple cellular activities that are related to physical performance. ETV1 knockout mice demonstrated abnormal cardiac conduction 49 and neuromuscular impairment. 50 The gene SH3KBP1 belongs to a gene group of putative motility modifiers, and the knocking down of SH3KBP1 leads to reduced cell migration in scratch wound assays. 51 Because it has been established that hypermethylated gene promoters are associated with repressed gene expression, 52 the identification of hypermethylated CpGs in promoters of these three genes (ETF1, ETV1, and SH3KBP1) in our study indicates possible down‐regulated cellular activity in association with sarcopenia. Yet further transcriptome analysis on corresponding genes are still needed to confirm the down‐regulation in gene expression.
Evaluation of linear models
In our study, the sarcopenia‐driven methylation score (MSSAR) was closely related to muscle strength and explained 33.2% to 40.1% of inter‐individual variance in all models (Models 1 and 4). This indicates a possible application of the MSSAR to the estimation of skeletal muscle strength in older women. Meanwhile, we should be aware that the participants in this study belong to two groups (i.e. sarcopenic and non‐sarcopenic groups) which have significant difference in muscle strength (Table 1) and MSSAR (Table 2). Therefore, when applying the MSSAR to a population with less variability in muscle strength (e.g. a group with only physically fit older people or a group with only sarcopenic participants), the corresponding muscular variance explained by the MSSAR might decrease to some extent. In fact, the MSSAR was found to explain less than 8% of the muscular variance within the sarcopenic or non‐sarcopenic group when analysed separately (Table S4E). Clearly, future studies on larger cohorts are still needed to evaluate the feasibility of applying the MSSAR for muscle strength evaluation.
Additionally, we found that genetic profile scores based on seven selected genes (GPSSNP) explained up to 4.4% of the variance in muscle size and strength, methylation levels in the seven selected genes (MSSNP) explained up to 8% in the studied phenotypes, while the MSSAR explained 10.1–40.1% of the individual differences in muscle size and strength in our sample of older women. These results showed that genetic and methylation profiles on several representative genes only explained limited muscular variability. Moreover, by comparing the AIC, the model with only an MSSAR showed the best performance in explaining the variance in muscle size and strength. This, again, indicated that using the data from a small set of representative genes might not well explain muscular variability. Notably, previous studies have demonstrated that even based on a larger candidate pool of more than 100 genetic variants, the data‐driven GPS only explained up to 7% of the variance in muscle mass and strength. 16 , 53 Therefore, it is possible that the genetic architecture only accounts for a small portion of muscular variability during ageing—or we have not yet used the optimal methodology to include all contributing genetic factors, while a larger proportion of the variance is taken up by DNA methylation. Because DNA methylation is representing the sum of short‐term and long‐term environmental factors, the finding that methylation levels explains a larger proportion of the variance in muscle morphology and strength than genetic profiles might indicate that environmental elements account for more variance than genetic factors in skeletal muscle during ageing, which is in line with the findings of previous heritability studies. 6 , 54 , 55
Notably, the model with gene‐wise combined genetic and methylation score (Model 3) showed that the genotype and methylation level in CNTF was closely related to knee extensor strength. The CNTF gene encodes ciliary neurotrophic factor, a polypeptide that promotes neuronal cell differentiation and neurite outgrowth, and exerts a neuroprotective effect by preventing motor neuron degeneration. 56 Indeed, CNTF G allele carriers have shown higher knee strength than A allele homozygotes at both slow and fast contraction speed across a large age span (20–90 years). 57 Our finding provides supportive evidence for the association between CNTF and knee strength.
Limitations
We acknowledge that, despite presenting signficant associations, our study has a limited sample size. Because of the limited sample size, we could only use adjusted R 2 and AIC for model evaluation. Therefore, our results still need to be examined in different cohorts with large sample sizes. Moreover, DNA methylation is only one mechanism of epigenetic regulation. Future models including other epigenetic mechanisms (e.g. histome methylation and acetylation), genome conformation, and transcriptome analysis might make the model more reliable. Additionally, the current study still remains descriptive and only reports the CpG sites that might be associated with sarcopenia based on the results of statistical analysis. Further transcriptome analysis on the genes, where these sarcopenia‐driven CpG sites (identified in the current study) located, should give more insight into the DNA methylation association with gene expression in respect of skeletal muscle condition among older women.
Another limitation is that the methylation data used in this study were based on blood samples. It is well known that DNA methylation is tissue‐specific, 58 so the methylation data obtained from blood might not fully represent the methylation status in other tissues. Although venous blood is more easily obtained, methylation status could be more informative if DNA was derived from skeletal muscle tissue. Meanwhile, the Illumina MethylationEPIC BeadChip used for methylation analysis in our study only covers 850 K CpG sites, which is a small proportion of the 28 million CpG sites in the human genome, and is not always informative because many CpG sites are omitted. 41 Therefore, a methylome‐wide association study should be more powerful in identifying sarcopenia‐driven or muscle‐related CpG sites for model building.
Conclusions
Our study combined genotypes and DNA methylation levels to evaluate their associations with muscle size and strength in older women. We found that a sarcopenia‐driven methylation score explained more inter‐individual variance in muscle strength and thigh muscle size than a genetic score or models with both genetic and methylation scores. Our results suggest a possible application of a sarcopenia‐driven methylation score to identify older adults who are at risk of muscle weakness conditions (e.g. sarcopenia and frailty) using routine blood samples, while the combination with a genetic score still needs to be further studied.
Conflict of interest
The authors declare no conflicts of interest. The authors certify that they comply with the ethical guidelines for publishing in the Journal of Cachexia, Sarcopenia and Muscle: update 2017. 59
Supporting information
Data S1. Supporting information
Table S1 SNPs selected in our study
Table S2. Supporting information
Table S3. Supporting information
Table S4. Supporting information
Table S5. Supporting information
Figure S1. Ultrasound images of the upper arm and the thigh. a. Ultrasound image of the upper arm (Sagittal); b. Ultrasound image of the thigh (cross‐sectional).
Figure S2. Shrinkage parameter tuning for sarcopenia‐driven LASSO logistic regression. The red line represents the mean value of corresponding metric in a six‐fold cross validation. The light blue area between the two blue dash lines marks out the range one standard deviation away from the mean value. The orange line demonstrates the optimal shrinkage parameter (C) with the best metric value. a. Changes of the log loss score with the shrinkage parameter. The log loss score reaches an optimal value of 0.69 when C is 65.13; b. Changes of the accuracy score with the shrinkage parameter. The accuracy score reaches an optimal value of 0.6 when C is 65.13; c. Changes of the F1 score with the shrinkage parameter. The F1 score reaches an optimal value of 0.63 when C is 65.13.
Figure S3. CpG sites (cg24840200, cg17629006, cg21402738 and cg18811601 shared with Turners study) located in gene promoters. The location information is obtained using UCSC Genome Browser on Human Feb. 2009 (GRCh37/hg19) Assembly. Gene annotation is provided by RefSeq Transcripts 92. Each plot consists of three layers. The top layer shows the gene location on the chromosome. The middle layer presents the gene regions and the promoter region where the CpG site is located. The bottom layer demonstrates the beta value of each participant (marked by the sarcopenic and non‐sarcopenic groups).
Acknowledgements
This study is supported by the Research Foundation—Flanders (FWO) [grant G.0898.15] and a PhD grant to Lingxiao He and Praval Khanal by the Erasmus Mundus ‘Move‐AGE’ joint doctorate program.
He L., Khanal P., Morse C. I., Williams A., and Thomis M. (2020) Associations of combined genetic and epigenetic scores with muscle size and muscle strength: a pilot study in older women, Journal of Cachexia, Sarcopenia and Muscle, 11, 1548–1561, 10.1002/jcsm.12585
References
- 1. McLeod M, Breen L, Hamilton DL, Philp A. Live strong and prosper: the importance of skeletal muscle strength for healthy ageing. Biogerontology 2016;17:1–14. [DOI] [PMC free article] [PubMed] [Google Scholar]
- 2. Visser M, Goodpaster BH, Kritchevsky SB, Newman AB, Nevitt M, Rubin SM, et al. Muscle mass, muscle strength, and muscle fat infiltration as predictors of incident mobility limitations in well‐functioning older persons. Journals Gerontol ‐ Ser A Biol Sci Med Sci 2005;60:324–333. [DOI] [PubMed] [Google Scholar]
- 3. Landi F, Liperoti R, Russo A, Giovannini S, Tosato M, Capoluongo E, et al. Sarcopenia as a risk factor for falls in elderly individuals: results from the ilSIRENTE study. Clin Nutr 2012;31:652–658. [DOI] [PubMed] [Google Scholar]
- 4. Balogun S, Winzenberg T, Wills K, Scott D, Jones G, Callisaya ML, et al. Prospective associations of low muscle mass and strength with health‐related quality of life over 10‐year in community‐dwelling older adults. Exp Gerontol 2019;118:65–71. [DOI] [PubMed] [Google Scholar]
- 5. Arden NK, Spector TD. Genetic influences on muscle strength, lean body mass, and bone mineral density: a twin study. J Bone Miner Res 1997;12:2076–2081. [DOI] [PubMed] [Google Scholar]
- 6. Carmelli D, Reed T. Stability and change in genetic and environmental influences on hand‐grip strength in older male twins. J Appl Physiol 2000;89:1879–1883. [DOI] [PubMed] [Google Scholar]
- 7. Puthucheary Z, Skipworth JRA, Rawal J, Loosemore M, Van Someren K, Montgomery HE. The ACE gene and human performance: 12 years on. Sport Med 2011;41:433–448. [DOI] [PubMed] [Google Scholar]
- 8. Charbonneau DE, Hanson ED, Ludlow AT, Delmonico MJ, Hurley BF, Roth SM. ACE genotype and the muscle hypertrophic and strength responses to strength training. Med Sci Sports Exerc 2008;40:677–683. [DOI] [PMC free article] [PubMed] [Google Scholar]
- 9. Erskine RM, Williams AG, Jones DA, Stewart CE, Degens H. The individual and combined influence of ACE and ACTN3 genotypes on muscle phenotypes before and after strength training. Scand J Med Sci Sports 2014;24:642–648. [DOI] [PubMed] [Google Scholar]
- 10. Vincent B, De Bock K, Ramaekers M, Van den Eede E, Van Leemputte M, Hespel P, et al. ACTN3 (R577X) genotype is associated with fiber type distribution. Physiol Genomics 2007;32:58–63. [DOI] [PubMed] [Google Scholar]
- 11. Heffernan SM, Stebbings GK, Kilduff LP, Erskine RM, Day SH, Morse CI, et al. Fat mass and obesity associated (FTO) gene influences skeletal muscle phenotypes in non‐resistance trained males and elite rugby playing position. BMC Genet 2017;18:1–9. [DOI] [PMC free article] [PubMed] [Google Scholar]
- 12. Williams AG, Folland JP. Similarity of polygenic profiles limits the potential for elite human physical performance. J Physiol 2008;586:113–121. [DOI] [PMC free article] [PubMed] [Google Scholar]
- 13. Ruiz JR, Gómez‐Gallego F, Santiago C, González‐Freire M, Verde Z, Foster C, et al. Is there an optimum endurance polygenic profile? J Physiol 2009;587:1527–1534. [DOI] [PMC free article] [PubMed] [Google Scholar]
- 14. Santiago C, Ruiz JR, Muniesa CA, González‐Freire M, Gómez‐Gallego F, Lucia A. Does the polygenic profile determine the potential for becoming a world‐class athlete? Insights from the sport of rowing. Scand J Med Sci Sport 2010;20:e188–e194. [DOI] [PubMed] [Google Scholar]
- 15. Thomaes T, Thomis M, Onkelinx S, Goetschalckx K, Fagard R, Lambrechts D, et al. Genetic predisposition scores associate with muscular strength, size, and trainability. Med Sci Sports Exerc 2013;45:1451–1459. [DOI] [PubMed] [Google Scholar]
- 16. He L, Van Roie E, Bogaerts A, Morse CI, Delecluse C, Verschueren S, et al. Genetic predisposition score predicts the increases of knee strength and muscle mass after one‐year exercise in healthy elderly. Exp Gerontol 2018;111:17–26. [DOI] [PubMed] [Google Scholar]
- 17. Jaenisch R, Bird A. Epigenetic regulation of gene expression: how the genome integrates intrinsic and environmental signals. Nat Genet 2003;33:245–254. [DOI] [PubMed] [Google Scholar]
- 18. Tammen SA, Friso S, Choi SW. Epigenetics: the link between nature and nurture. Mol Aspects Med 2013;34:753–764. [DOI] [PMC free article] [PubMed] [Google Scholar]
- 19. Ehrlich M, Gama‐Sosa MA, Huang LH, Midgett RM, Kuo KC, McCune RA, et al. Amount and distribution of 5‐methylcytosine in human DNA from different types of tissues of cells. Nucleic Acids Res 1982;10:2709–2721. [DOI] [PMC free article] [PubMed] [Google Scholar]
- 20. Martin EM, Fry RC. Environmental influences on the epigenome: exposure‐associated DNA methylation in human populations. Annu Rev Public Health 2018;39:309–333. [DOI] [PubMed] [Google Scholar]
- 21. Deaton AM, Bird A. CpG islands and the regulation of transcription. Genes Dev 2011;25:1010–1022. [DOI] [PMC free article] [PubMed] [Google Scholar]
- 22. Jeziorska DM, Murray RJS, De Gobbi M, Gaentzsch R, Garrick D, Ayyub H, et al. DNA methylation of intragenic CpG islands depends on their transcriptional activity during differentiation and disease. Proc Natl Acad Sci 2017;114:E7526–E7535. [DOI] [PMC free article] [PubMed] [Google Scholar]
- 23. Mikeska T, Craig JM. DNA methylation biomarkers: cancer and beyond. Genes (Basel) 2014;5:821–864. [DOI] [PMC free article] [PubMed] [Google Scholar]
- 24. Zykovich A, Hubbard A, Flynn JM, Tarnopolsky M, Fraga MF, Kerksick C, et al. Genome‐wide DNA methylation changes with age in disease‐free human skeletal muscle. Aging Cell 2014;13:360–366. [DOI] [PMC free article] [PubMed] [Google Scholar]
- 25. Hamilton OKL, Zhang Q, McRae AF, Walker RM, Morris SW, Redmond P, et al. An epigenetic score for BMI based on DNA methylation correlates with poor physical health and major disease in the Lothian Birth Cohort. Int J Obes (Lond) 2019;43:1795–1802. [DOI] [PMC free article] [PubMed] [Google Scholar]
- 26. Ahmad AS, Vasiljević N, Carter P, Berney DM, Møller H, Foster CS, et al. A novel DNA methylation score accurately predicts death from prostate cancer in men with low to intermediate clinical risk factors. Oncotarget 2016;7. [DOI] [PMC free article] [PubMed] [Google Scholar]
- 27. Zhao S, Leonardson A, Geybels MS, McDaniel AS, Yu M, Kolb S, et al. A five‐CpG DNA methylation score to predict metastatic‐lethal outcomes in men treated with radical prostatectomy for localized prostate cancer. Prostate 2018;78:1084–1091. [DOI] [PMC free article] [PubMed] [Google Scholar]
- 28. Wei JH, Haddad A, Wu KJ, Zhao HW, Kapur P, Zhang ZL, et al. A CpG‐methylation‐based assay to predict survival in clear cell renal cell carcinoma. Nat Commun 2015;6:1–11. [DOI] [PMC free article] [PubMed] [Google Scholar]
- 29. Reese SE, Zhao S, Wu MC, Joubert BR, Parr CL, Håberg SE, et al. DNA methylation score as a biomarker in newborns for sustained maternal smoking during pregnancy. Environ Health Perspect 2017;125:760–766. [DOI] [PMC free article] [PubMed] [Google Scholar]
- 30. Bharathy N, Ling BMT, Taneja R. Epigenetic regulation of skeletal muscle development and differentiation In Epigenetics: Development and Disease; 2013. p 139–150. [DOI] [PubMed] [Google Scholar]
- 31. Sharples AP, Polydorou I, Hughes DC, Owens DJ, Hughes TM, Stewart CE. Skeletal muscle cells possess a ‘memory’ of acute early life TNF‐α exposure: role of epigenetic adaptation. Biogerontology 2016;17:603–617. [DOI] [PubMed] [Google Scholar]
- 32. Seaborne RA, Strauss J, Cocks M, Shepherd S, O'Brien TD, van Someren KA, et al. Human skeletal muscle possesses an epigenetic memory of hypertrophy. Sci Rep 2018;8:1898. [DOI] [PMC free article] [PubMed] [Google Scholar]
- 33. Sharples AP, Stewart CE, Seaborne RA. Does skeletal muscle have an ‘epi’‐memory? The role of epigenetics in nutritional programming, metabolic disease, aging and exercise. Aging Cell 2016;15:603–616. [DOI] [PMC free article] [PubMed] [Google Scholar]
- 34. Turner DC, Seaborne RA, Sharples AP. Comparative transcriptome and methylome analysis in human skeletal muscle anabolism, hypertrophy and epigenetic memory. Sci Rep 2019;9:1–12. [DOI] [PMC free article] [PubMed] [Google Scholar]
- 35. Sailani MR, Halling JF, Møller HD, Lee H, Plomgaard P, Pilegaard H, et al. Lifelong physical activity is associated with promoter hypomethylation of genes involved in metabolism, myogenesis, contractile properties and oxidative stress resistance in aged human skeletal muscle. Sci Rep 2019;9:1–11. [DOI] [PMC free article] [PubMed] [Google Scholar]
- 36. Shah S, Bonder MJ, Marioni RE, Zhu Z, McRae AF, Zhernakova A, et al. Improving phenotypic prediction by combining genetic and epigenetic associations. Am J Hum Genet 2015;97:75–85. [DOI] [PMC free article] [PubMed] [Google Scholar]
- 37. Dogan MV, Grumbach IM, Michaelson JJ, Philibert RA. Integrated genetic and epigenetic prediction of coronary heart disease in the Framingham Heart Study. PLoS One 2018;13:1–18. [DOI] [PMC free article] [PubMed] [Google Scholar]
- 38. He L, Khanal P, Morse CI, Williams A, Thomis M. Differentially methylated gene patterns between age‐matched sarcopenic and non‐sarcopenic women. J Cachexia Sarcopenia Muscle 2019;jcsm.12478. [DOI] [PMC free article] [PubMed] [Google Scholar]
- 39. Janssen I, Baumgartner RN, Ross R, Rosenberg IH, Roubenoff R. Skeletal muscle cutpoints associated with elevated physical disability risk in older men and women. Am J Epidemiol 2004;159:413–421. [DOI] [PubMed] [Google Scholar]
- 40. Aryee MJ, Jaffe AE, Corrada‐Bravo H, Ladd‐Acosta C, Feinberg AP, Hansen KD, et al. Minfi: a flexible and comprehensive Bioconductor package for the analysis of Infinium DNA methylation microarrays. Bioinformatics 2014;30:1363–1369. [DOI] [PMC free article] [PubMed] [Google Scholar]
- 41. Pidsley R, Zotenko E, Peters TJ, Lawrence MG, Risbridger GP, Molloy P, et al. Critical evaluation of the Illumina MethylationEPIC BeadChip microarray for whole‐genome DNA methylation profiling. Genome Biol 2016;17:208. [DOI] [PMC free article] [PubMed] [Google Scholar]
- 42. Ogasawara R, Thiebaud RS, Loenneke JP, Loftin M, Abe T. Time course for arm and chest muscle thickness changes following bench press training. Interv Med Appl Sci 2012;4:217–220. [DOI] [PMC free article] [PubMed] [Google Scholar]
- 43. Reeves ND, Maganaris CN, Narici MV. Ultrasonographic assessment of human skeletal muscle size. Eur J Appl Physiol 2004;91:116–118. [DOI] [PubMed] [Google Scholar]
- 44. Tibshirani R. Regression shrinkage and selection via the lasso. J R Stat Soc Ser B 1996;58:267–288. [Google Scholar]
- 45. Akaike H. A new look at the statistical model identification. IEEE Trans Automat Contr 1974;19:716–723. [Google Scholar]
- 46. Burnham KP, Anderson DR. Multimodel inference. Sociol Methods Res 2004;33:261–304. [Google Scholar]
- 47. Bell JT, Tsai P, Yang T, Pidsley R, Nisbet J, Glass D, et al. Epigenome‐wide scans identify differentially methylated regions for age and age‐related phenotypes in a healthy ageing population. PLoS Genet 2012;8:e1002629. [DOI] [PMC free article] [PubMed] [Google Scholar]
- 48. Singh P, James RS, Mee CJ, Morozov IY. mRNA levels are buffered upon knockdown of RNA decay and translation factors via adjustment of transcription rates in human HepG2 cells. RNA Biol 2019;0:1–9. [DOI] [PMC free article] [PubMed] [Google Scholar]
- 49. Shekhar A, Lin X, Liu F, Zhang J, Mo H, Bastarache L, et al. Transcription factor ETV1 is essential for rapid conduction in the heart. J Clin Invest 2016;126:4444–4459. [DOI] [PMC free article] [PubMed] [Google Scholar]
- 50. Arber S, Ladle DR, Lin JH, Frank E, Jessell TM. ETS gene Er81 controls the formation of functional connections between group Ia sensory afferents and motor neurons. Cell 2000;101:485–498. [DOI] [PubMed] [Google Scholar]
- 51. Bai SW, Herrera‐Abreu MT, Rohn JL, Racine V, Tajadura V, Suryavanshi N, et al. Identification and characterization of a set of conserved and new regulators of cytoskeletal organization, cell morphology and migration. BMC Biol 2011;9:54. [DOI] [PMC free article] [PubMed] [Google Scholar]
- 52. Cedar H, Bergman Y. Linking DNA methylation and histone modification: patterns and paradigms. Nat Rev Genet 2009;10:295–304. [DOI] [PubMed] [Google Scholar]
- 53. Charlier R, Caspers M, Knaeps S, Mertens E, Lambrechts D, Lefevre J, et al. Limited potential of genetic predisposition scores to predict muscle mass and strength performance in Flemish Caucasians between 19 and 73 years of age. Physiol Genomics 2017;49:160–166. [DOI] [PubMed] [Google Scholar]
- 54. Tiainen K, Sipilä S, Alen M, Heikkinen E, Kaprio J, Koskenvuo M, et al. Heritability of maximal isometric muscle strength in older female twins. J Appl Physiol 2004;96:173–180. [DOI] [PubMed] [Google Scholar]
- 55. Tiainen K, Sipilä S, Kauppinen M, Kaprio J, Rantanen T. Genetic and environmental effects on isometric muscle strength and leg extensor power followed up for three years among older female twins. J Appl Physiol 2009;106:1604–1610. [DOI] [PubMed] [Google Scholar]
- 56. Pasquin S, Sharma M, Gauchat JF. Ciliary neurotrophic factor (CNTF): new facets of an old molecule for treating neurodegenerative and metabolic syndrome pathologies. Cytokine Growth Factor Rev 2015;26:507–515. [DOI] [PubMed] [Google Scholar]
- 57. Roth SM, Schrager MA, Ferrell RE, Riechman SE, Metter EJ, Lynch NA, et al. CNTF genotype is associated with muscular strength and quality in humans across the adult age span. J Appl Physiol 2001;90:1205–1210. [DOI] [PubMed] [Google Scholar]
- 58. Lokk K, Modhukur V, Rajashekar B, Märtens K, Mägi R, Kolde R, et al. DNA methylome profiling of human tissues identifies global and tissue‐specific methylation patterns. Genome Biol 2014;15:3248. [DOI] [PMC free article] [PubMed] [Google Scholar]
- 59. von Haehling S, Morley JE, Coats AJS, Anker SD. Ethical guidelines for publishing in the journal of cachexia, sarcopenia and muscle: update 2019. J Cachexia Sarcopenia Muscle 2019;10:1143–1145. [DOI] [PMC free article] [PubMed] [Google Scholar]
Associated Data
This section collects any data citations, data availability statements, or supplementary materials included in this article.
Supplementary Materials
Data S1. Supporting information
Table S1 SNPs selected in our study
Table S2. Supporting information
Table S3. Supporting information
Table S4. Supporting information
Table S5. Supporting information
Figure S1. Ultrasound images of the upper arm and the thigh. a. Ultrasound image of the upper arm (Sagittal); b. Ultrasound image of the thigh (cross‐sectional).
Figure S2. Shrinkage parameter tuning for sarcopenia‐driven LASSO logistic regression. The red line represents the mean value of corresponding metric in a six‐fold cross validation. The light blue area between the two blue dash lines marks out the range one standard deviation away from the mean value. The orange line demonstrates the optimal shrinkage parameter (C) with the best metric value. a. Changes of the log loss score with the shrinkage parameter. The log loss score reaches an optimal value of 0.69 when C is 65.13; b. Changes of the accuracy score with the shrinkage parameter. The accuracy score reaches an optimal value of 0.6 when C is 65.13; c. Changes of the F1 score with the shrinkage parameter. The F1 score reaches an optimal value of 0.63 when C is 65.13.
Figure S3. CpG sites (cg24840200, cg17629006, cg21402738 and cg18811601 shared with Turners study) located in gene promoters. The location information is obtained using UCSC Genome Browser on Human Feb. 2009 (GRCh37/hg19) Assembly. Gene annotation is provided by RefSeq Transcripts 92. Each plot consists of three layers. The top layer shows the gene location on the chromosome. The middle layer presents the gene regions and the promoter region where the CpG site is located. The bottom layer demonstrates the beta value of each participant (marked by the sarcopenic and non‐sarcopenic groups).