FIGURE 6.

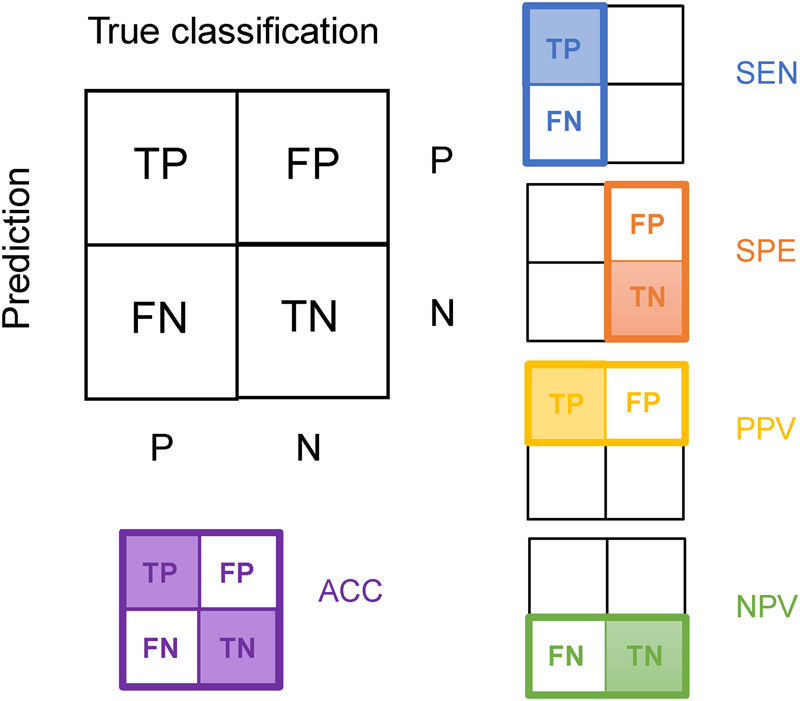
Metrics used to evaluate prediction results (except MCC). The value is calculated by dividing the predicted count in the shadowy box by the predicted count in the whole rectangle (or square) with a colored border.

Metrics used to evaluate prediction results (except MCC). The value is calculated by dividing the predicted count in the shadowy box by the predicted count in the whole rectangle (or square) with a colored border.