

Abstract
Voltage sensitive fluorescent dyes (VSDs) are important tools for probing signal transduction in neurons and other excitable cells. The impact of these highly lipophilic sensors has, however, been limited due to the lack of cell-specific targeting methods in brain tissue or living animals. We address this key challenge by introducing a non-genetic molecular platform for cell- and molecule-specific targeting of synthetic VSDs in the brain. We employ a dextran polymer particle to overcome the inherent lipophilicity of VSDs by dynamic encapsulation, and high-affinity ligands to target the construct to specific neuronal cells utilizing only native components of the neurotransmission machinery at physiological expression levels. Dichloropane, a monoamine transporter ligand, enables targeting of dense dopaminergic axons in the mouse striatum and sparse noradrenergic axons in the mouse cortex in acute brain slices. PFQX in conjunction with ligand-directed acyl imidazole chemistry enables covalent labeling of AMPA-type glutamate receptors in the same brain regions. Probe variants bearing either a classical electrochromic ANEP dye or state-of-the-art VoltageFluor-type dye respond to membrane potential changes in a similar manner to the parent dyes, as shown by whole-cell patch recording. We demonstrate the feasibility of optical voltage recording with our probes in brain tissue with one-photon and two-photon fluorescence microscopy and define the signal limits of optical voltage imaging with synthetic sensors under a low photon budget determined by the native expression levels of the target proteins. This work demonstrates the feasibility of a chemical targeting approach and expands the possibilities of cell-specific imaging and pharmacology.
Graphical Abstract

Introduction
Monitoring signal transmission between and within the cells of the nervous system has been and remains one of the key challenges in neuroscience. While whole cell electrophysiological recording techniques have provided unprecedented insight into neuronal function and remain the standard approach to probe membrane potential dynamics in excitable cells,1,2 optical techniques have emerged as a powerful complement to electrode-based methods. The development of calcium sensitive dyes (CaSDs)3,4 and voltage sensitive dyes (VSDs)5–8 has transformed neuroscience and cell biology at large; however, the key shortcoming of synthetic sensors has been the lack of targeting to specific cell types in brain tissue and in vivo.9–11 Consequently, the advancement of protein based calcium and voltage indicators have been intensely pursued, as these genetically encoded tools can be targeted to many neuronal cell types via cell-specific, promoter-based genetic methods.12–15
Synthetic dyes have several key advantages over fluorescent proteins, mainly the availability of the entire chemical space for choice, design, and direct modification of the fluorophore, enabling the tuning of photophysical and functional properties (e.g., absorption and emission profile, photostability, brightness, response magnitude (ΔF/F), and kinetics).8,16,17 Synthetic chemistry also allows for flexible design of sensors for other imaging modalities (e.g., short wave infrared (SWIR)18,19 fluorescence or photoacoustic (PA)20–22 imaging).
Synthetic voltage sensors are, however, exceptionally challenging to deliver to selected cell types due to their inherent lipophilicity, which causes high background staining and limited diffusibility in tissue. Successful attempts to target synthetic VSDs to specific cell types have been scarce. For example, a chemo-genetic approach taking advantage of cell-surface expression of alkaline phosphatase to dephosphorylate and thus induce membrane localization of an electrochromic aminonaphthyl-ethene-pyridinium (ANEP) VSD precursor was reported.23–25 A similar strategy was adopted recently using a porcine liver esterase to activate a fluorogenically silent precursor of VoltageFluor, a photoinduced electron transfer (PeT) based VSD.26 Ligand-tethering approaches were also utilized in recent studies using the acyl carrier protein (ACP)-tag27 or Spy-tag28 to target a Nile Red or a VoltageFluor VSD, respectively, to neurons genetically engineered to express the self-modifying enzyme. Targeting of rhodamine-based voltage reporters using genetically encoded HaloTag in mouse brain tissue has recently been introduced.29 However, no targeting strategies have yet been introduced that can be performed in the absence of genetic manipulation of the target cells in intact tissue preparations ex or in vivo.
We have pursued chemical targeting strategies to deliver synthetic fluorophores to specific neuronal cells and synaptic release sites in intact brain tissue, utilizing native components of the neurotransmission machinery. We developed fluorescent false neurotransmitters (FFNs), probes that act as substrates of relevant monoamine transporters, label dopaminergic or noradrenergic neurons and their synaptic vesicles, and enable optical recording of transmitter release at individual synaptic sites ex vivo and in vivo in rodents.30–35 For example, the probe FFN102 labels dopaminergic release sites in the mouse striatum with high selectivity, due to the selective transport of FFN102 by the dopamine transporter (DAT) into dopaminergic neurons.32 Encouraged by this approach, we hypothesized that endogenously expressed membrane proteins could enable the targeting of specific cell types in the brain with a variety of sensors and actuators, including lipophilic VSDs, by the means of high affinity ligands.
Targeting endogenously expressed components of the neurotransmitter machinery to deliver lipophilic VSDs poses a two-fold challenge in comparison to the overexpressed chemo-genetic handles (such as self-modifying enzymes). At the targeting level, the native membrane protein accommodates a relatively low number of sensor molecules, leading to significant background even from low levels of non-specific staining. At the voltage recording level, the low number of delivered VSD molecules limits their photon output, resulting in a relatively weak functional signal. We sought to define the limits of voltage recording with synthetic VSDs targeted to specific neuronal populations in the brains of wild-type animals. The embodiment of this goal required the use of small carbohydrate polymers to accommodate the high lipophilicity of VSDs and serve as a molecular carrier for both the VSD and the targeting ligand.
Here, we report a chemical platform which enables the targeting of lipophilic VSDs to monoaminergic projections and glutamatergic synapses in brain tissue. Our Voltage sensor–Ligand–Dextran probes, or VoLDe probes, integrate three modalities into one multifunctional construct to achieve this goal. We selected two VSDs for this exploratory study: di-2-ANEPEQ (1), a well-established electrochromic hemicyanine VSD;36,37 and dsRVF5 (disulfo Rhodol VoltageFluor-5, 2), a disulfonated38 version of a state-of-the-art VSD (Fig. 1a).39 As a second component – the targeting ligand – we used the tropane analog dichloropane (3) as a potent ligand of dopamine and norepinephrine transporters (DAT and NET respectively);40,41 and 6-pyrrolyl-7-trifluoromethyl-quinoxaline-2,3-dione (PFQX, 4) as a ligand for the α-amino-3-hydroxy-5-methyl-4-isoxazolepropionic acid (AMPA)-type glutamate receptor (AMPAR; Fig. 1b).42 Both the VSD and the ligand are appended to a dextran polymer carrier that compensates for the dye’s lipophilicity and decreases non-specific labeling in cell cultures and in the mammalian brain. Our probes enable not only cell-type specific but also molecule-specific targeting of VSDs by selectively binding the target membrane proteins. We demonstrate non-covalent targeting of DAT and NET using dichloropane (3) as a high affinity monoamine transporter ligand (“VoLDeMo” probe, Fig. 1c), and irreversible covalent labeling of the AMPAR by the means of the “chemical AMPAR modification” (CAM) strategy developed by Hamachi and coworkers43 (“VoLDeCAM” probe, Fig. 1d).
Figure 1. Components of the VoLDe targeting system.
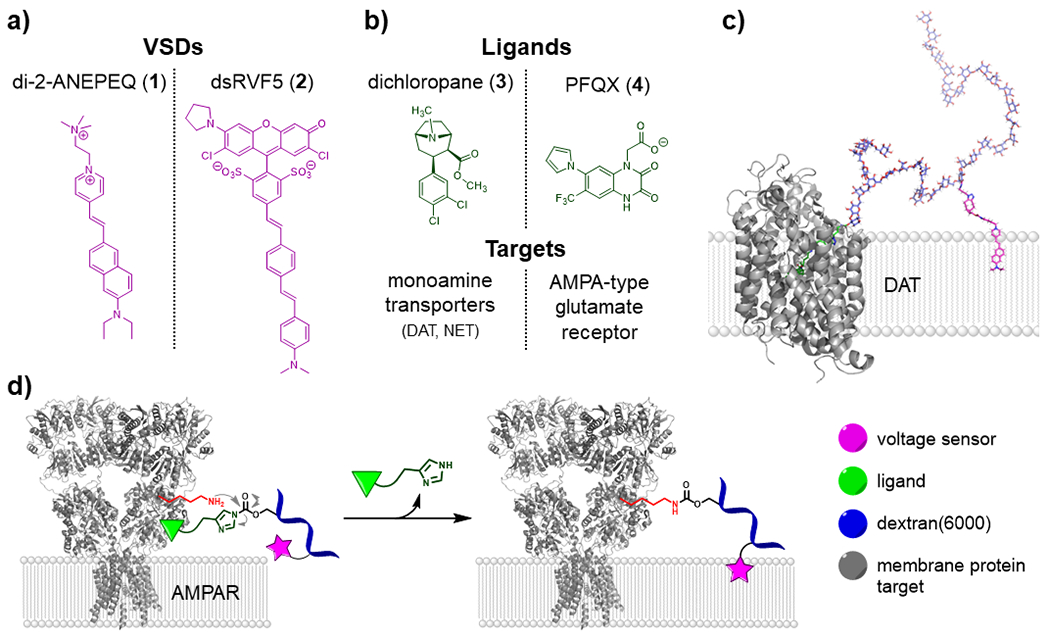
(a) Voltage sensitive dyes di-2-ANEPEQ (1),36,37 and dsRVF5 (2).38,39 (b) Dichloropane (3), a potent DAT and NET ligand;40,41 and PFQX (4), a selective AMPAR ligand.42 (c) A 3D model of the VoLDeMo targeting system. A di-2-ANEP VSD (pink) and dichloropane ligand (green) are attached through short linkers to a dextran polymer carrier (blue). The dichloropane ligand of the construct is shown bound to the dopamine transporter (grey; structure of drosophila DAT44 was used for the graphic), and the lipophilic VSD is inserted into the cell membrane. (d) VoLDeCAM targeting. The PFQX ligand (green) is attached to a dextran polymer carrier (blue) via an acyl imidazole linker.43 Upon binding to AMPAR (grey; taken from ref.45), a nearby nucleophilic amino acid residue (red) cleaves the acyl imidazole linker, thus covalently binding the probe, deploying the VSD (pink), and expelling the ligand.
Results
Establishment of dichloropane as a targeting ligand.
Based on previous reports and examination of DAT’s 3D structure,44,46 we hypothesized that introducing an N-Boc-4-aminobutyl linker instead of the methyl group on the bridgehead nitrogen of dichloropane (3) would largely conserve its affinity to monoamine transporters. Indeed, enantiomerically pure dichloropane analog 5 (Fig. 2a) blocked APP+ (an established DAT substrate47) uptake by HEK-293 cells stably transfected with human DAT (hDAT-HEK cells) with an IC50 of (11 ± 1) nM (Fig. S1). We further synthesized rhodamine-labeled dichloropane (6, Fig. 2a),48 which strongly labeled hDAT-HEK cells in a coronal fashion, compared to null transfected cells, and the labeling was efficiently blocked by the DAT inhibitor, nomifensine49 (Fig. S2). In addition, probe 6 blocked APP+ uptake by hDAT-HEK cells with an IC50 of (25 ± 1) nM (Fig. S3), comparable in potency to dichloropane analog 5. This system was employed as a positive control in subsequent VSD targeting studies.
Figure 2. Design and synthesis of DAT/NET-targeted fluorescent probes.

(a) Dichloropane ligand bearing a Boc-4-aminobutyl linker (5) and its transformation into probe 6. (b) Schematic illustration of ligand-dye fusion concepts. Left: a short linker separates the dye (pink) and the ligand (black anchor) targeting a membrane protein of interest (red). Right: The dye and the ligand are separated by a polymer carrier (blue) that enables insertion of the dye into the cell membrane (grey). (c) Synthesis of azidopropyl-carbamate-dextran(6000) (8-w). Number w reflects the degree of dextran functionalization with azidopropyl ligands (average number of azide functionalities per polymer molecule, see Supporting Information for details). (d) One-pot assembly of VoLDeMo via click chemistry by the reaction of N3-dextran 8-w (w = 3.25 or 2.15) with a 1:2 mixture of VSD 9 or 10 and ligand 11. Note: Dextran branching is omitted for clarity. Linker substitution on dextran is shown only in position 2; however, it is likely that positions 3, 4 and terminal 6 are also functionalized to a lower extent (see ref.50 and Supporting Information).
Design, synthesis, and characterization of a non-genetic platform for targeting VSDs to monoaminergic neurons.
Targetable probe 6 is schematically illustrated in Fig. 2b-left. The same concept cannot be applied to VSD targeting, since a short linker would not enable insertion of the fluorophore into the cell membrane. A long linker and/or polymer carrier is needed to separate the ligand and the VSD (Fig. 2b-right) and render the construct functional. The first logical choice for a long ligand–VSD separator was a poly(ethylene glycol) (PEG) chain. PEG is a widely used polymer in chemical biology due to its solubility, synthetic accessibility, and presumed low protein binding.51 It has been successfully applied previously for delivery of dye molecules 27,28,52 We therefore constructed a dichloropane–PEG(3400)–di-2-ANEP construct (S1, Fig. S4) and tested its targeting specificity in hDAT-HEK cells. However, DAT-independent cell labeling, as well as internalization of construct S1 was observed (Fig. S4). We thus concluded that PEG was unable to compensate for the lipophilic character of di-2-ANEP and render it targetable to specific membrane proteins.
We next turned our attention to dextran, a bacterial polysaccharide composed of glucopyranose units connected through α-1,6-glycosidic linkages with occasional 1,3- and less frequently 1,2- and 1,4-branching.53 Dextran was an attractive choice due to its clinical use, biocompatibility, slow degradation in mammals, and high diffusion rates in tissue including brain.54–56 Based on our exploratory studies, we chose dextran(6000) (avg. Mw = 6000 Da) as a compromise between a large-enough hydrophilic surface to compensate for the lipophilicity of the VSD and a relatively small size for sufficient diffusion in tissue (data not shown). We developed a functionalization protocol enabling attachment of 3-azidopropyl linker groups to dextran using activated carbamate 7 to provide azidopropyl-carbamate-dextran(6000) (8-w, Fig. 2c). This chemical labeling allowed for straightforward control of dextran coverage (average number of azide functionalities per polymer molecule – w; see Supporting Information for detailed protocol and discussion of this parameter) with N3-terminated linkers. Next, we used strain-promoted azide-alkyne cycloaddition click chemistry to attach functionalized di-2-ANEP (9) or dsRVF5 VSD (10) and dichloropane ligand (11). The position of the linker terminated with the clickable bicyclo[6.1.0]non-4-yn-9-yl)methyl (BCN) group was chosen based on the expected orientation of the VSD in the cell membrane. The ethylene–quaternary ammonium headgroup of di-2-ANEPEQ (1) was substituted with a flexible butylene linker terminated with carbamate-bound BCN in the functionalized dye 9 (linker attached via the pyridinium nitrogen). Similarly, dsRVF5 10 was functionalized with BCN at the pyrrolidine group, which faces the extracellular space upon membrane localization of the VSD. The sensors and ligand equipped with the strained alkyne moiety were reacted with the azide functionalized dextran 8-w to assemble the final di-2-ANEP-VoLDeMo (12) and dsRVF5-VoLDeMo (13) constructs, respectively (Fig. 2d). The coverage of the dextran polymer with ligands (y) and VSDs (z) was chosen as follows: to minimize the number of polymer molecules which would carry two or more lipophilic VSDs (increasing the probability of non-specific binding or fluorescence self-quenching due to short-range interactions), we aimed for y < 1; and to ensure that a vast majority of polymer molecules that carry a VSD also carry at least one dichloropane ligand, we aimed for z > 1 and y:z = 1:2. di-2-ANEP-VoLDeMo (12) was obtained with a coverage of 0.74 ANEP/polymer and 1.38 ligand/polymer as determined by 1H NMR (Fig. S5). dsRVF5-VoLDeMo (13) was synthesized twice – a coverage of 0.63 dsRVF5/polymer and 1.39 ligand/polymer was obtained for sample 1 and 0.74 dsRVF5/polymer and 1.45 ligand/polymer was obtained for sample 2 (Fig. S6 and S7).
Different concentration values of the VoLDeMo probes can be reported with respect to the dextran polymer, VSD or ligand, based on the coverages above. For example, a 100 nM di-2-ANEP-VoLDeMo (12) with respect to dextran is ~74 nM with respect to the VSD (see Supporting Information for details). Concentration values with respect to both dextran and VSD are specified in subsequent experiments.
A significant difference was observed between the 1H NMR spectra of VoLDeMo probes in D2O and DMSO-d6. While broad signals were observed in the aromatic region in D2O (Fig. 3a, Fig. S8a), much sharper peaks were observed in DMSO-d6 (Fig. 3b, Fig. S8b). This observation provides a clue about the conformational behavior of these constructs: the structure is likely folded in aqueous environments, wherein the lipophilic dye is concealed by the dextran polymer to minimize the unfavorable VSD–water interactions. Restricted flexibility of the VSD in such a folded state results in broadened peaks. Signals belonging to the dichlorophenyl group of the dichloropane ligand show significantly less broadening (green asterisks in Fig. 3a and Fig. S8a) reflecting less shielding by dextran. Only in the presence of a less polar (and aprotic dipolar) environment (DMSO-d6) the VoLDeMo probe favors an unfolded conformation. We therefore propose the following targeting model for the VoLDeMo sensors: in the bulk extracellular environment, the construct exists predominantly in a folded state with the VSD minimally exposed to the aqueous environment, which results in low non-specific binding. Association of the dichloropane ligand with DAT or NET increases the effective concentration of the VoLDeMo construct at the cell membrane, the conformational equilibrium is shifted, and the VSD partitions into the membrane (Fig. 3c).
Figure 3. Proposed conformational behavior and targeting model of VoLDeMo.
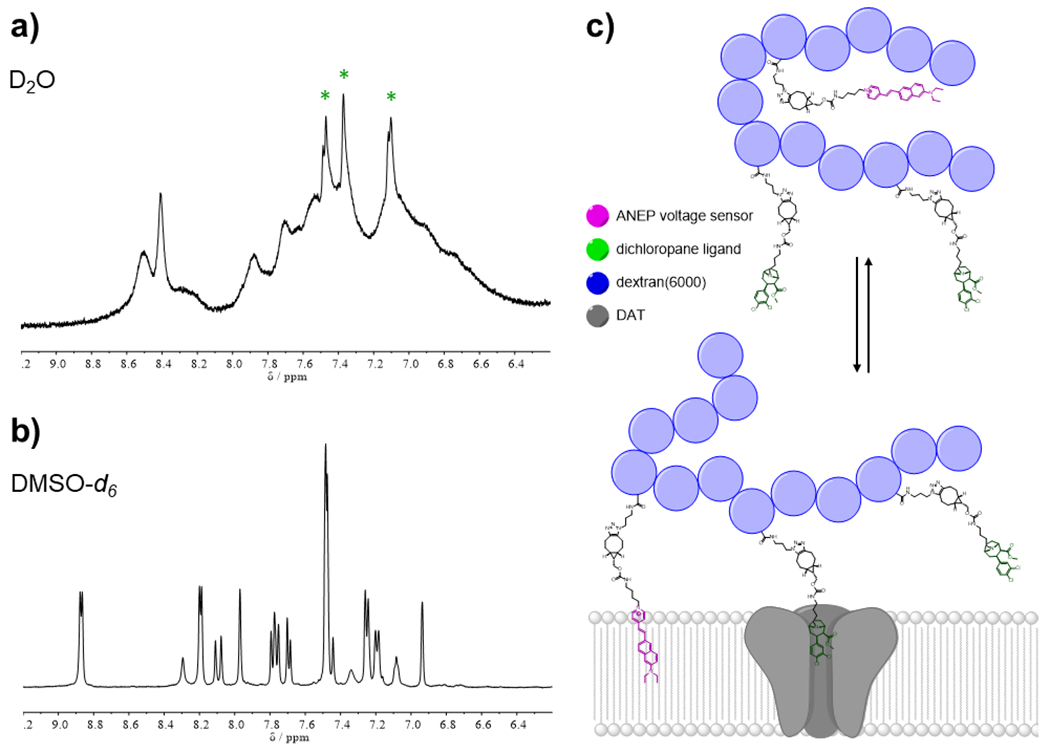
(a) 1H NMR (500 MHz, D2O) of di-2-ANEP-VoLDeMo (12), zoomed in aromatic region (6.2–9.2 ppm). Broadened peaks reflect restrained conformational freedom of the lipophilic VSD which is shielded by the dextran carrier. Green asterisks – signals of the dichloropane ligand which are significantly sharper, reflecting more conformational freedom of the ligand. (b) 1HNMR (500 MHz, DMSO-d6) of di-2-ANEP-VoLDeMo (12), zoomed in aromatic region (6.2–9.2 ppm). Sharp peaks indicate high conformational flexibility of the construct in the more solubilizing environment of DMSO. (c) Targeting model of VoLDeMo: Top – in bulk aqueous environment, the VSD (pink) is encapsulated by the dextran carrier (blue spheres) from the solvent. Bottom – after binding of the dichloropane ligand (green) to DAT (grey), the equilibrium is shifted and the VSD partitions into the cell membrane.
VoLDeMo selectively labels DAT-expressing cells and enables optical recording of membrane potential changes.
hDAT-HEK cells were incubated with di-2-ANEP-VoLDeMo (12; 100 nM dextran/74 nM VSD) or dsRVF5-VoLDeMo (13; 100 nM dextran/63 nM VSD) for 5 min or 15 min respectively at room temperature and washed, resulting in membrane-localized fluorescence staining. Upon pre- and co-treatment with the DAT inhibitor, nomifensine (2 μM), the membrane staining of hDAT-transfected cells was significantly diminished (20.2 ± 5.7 fold decrease, n = 30 cells from 3 experiments, P = 0.0013 for di-2-ANEP-VoLDeMo (12) and 3.4 ± 0.5 fold decrease, n = 30 cells from 3 experiments, P < 0.0001 for dsRVF5-VoLDeMo (13), two-tailed unpaired t-test). Additionally, coronal staining was not observed with null-transfected HEK cells under identical conditions (8.4 ± 1.5 fold decrease in fluorescence intensity with respect to hDAT-HEK cells, n = 30 cells from 3 experiments, P = 0.0018 for di-2-ANEP-VoLDeMo (12) and 6.0 ± 0.6 fold decrease, n = 30 cells from 3 experiments, P < 0.0001 for dsRVF5-VoLDeMo (13), two-tailed unpaired t-test), confirming that binding to DAT is required for localization of the probe to the surface of the membrane (Fig. 4a and d, Fig. S9). Higher signal to background ratio observed for di-2-ANEP-VoLDeMo (12) compared to dsRVF5-VoLDeMo (13) is likely a result of the lower lipophilicity of the di-2-ANEP VSD with respect to dsRVF5, which results in a lower extent of non-specific background staining. Interestingly, we observed significant difference in labeling selectivity when dsRVF5-VoLDeMo (13) was added to hDAT-HEK cells and null-HEK cells as a stock solution in H2O vs. DMSO (Fig. S10). Coronal staining of null-HEK cells (off-target staining) was lower by a factor of 3.7 ± 0.4 compared to labeling of hDAT-HEK cells (n = 15 cells from 3 experiments, P = 0.0001) when an aqueous solution of 13 (stock solution: 50 μM VSD, final concentration: 50 nM VSD) was applied. In contrast, addition of DMSO solution of 13 at the same concentration resulted in a 2.2 ± 0.8 fold decrease in coronal staining of null-HEK cells compared to hDAT-HEK cells (n = 15 cells from 3 experiments, P = 0.094). These findings support our targeting model of VoLDeMo probes proposed above (Fig. 3c): the labeling selectivity is greater when an aqueous solution of dsRVF5-VoLDeMo (13) is added to the cells where the VSD is shielded by the dextran, while direct application of a DMSO solution of the probe where the VSD is not sufficiently encapsulated (assuming slow folding kinetics) results in inferior labeling selectivity.
Figure 4. Labeling specificity and membrane potential sensitivity of VoLDeMo probes in hDAT-HEK cells.

(a, d) Brightfield (BF, top row) and corresponding fluorescence (Fluo, bottom row) images of HEK cells labeled with di-2-ANEP- (a) and dsRVF5-VoLDeMo (d) probes (100 nM dextran/74 nM or 63 nM VSD, respectively). Labeling was compared in hDAT-HEK cells (left column), hDAT-HEK cells pre-incubated with the DAT inhibitor nomifensine (2 μM; middle column), and null-transfected HEK cells (right column). All fluorescence images are equally contrasted for each VoLDeMo probe. Note: bright spots in some fluorescence images likely correspond to non-specifically labeled dead cells or cellular fragments, (b, e) Representative concatenated traces of the fractional change in fluorescence of di-2-ANEP- (b) and dsRVF5-VoLDeMo (e) probes (100 nM dextran/74 nM or 63 nM VSD, respectively) versus time of a voltage-clamped HEK cell, held at −60 mV and then subjected to 100 ms voltage holdings ranging from −100 mV (blue trace) to +80 mV (red trace) in 30 mV intervals. (c, f) Plots of percent fluorescence change of di-2-ANEP- (c) and dsRVF5-VoLDeMo (f) probes (100 nM dextran/74 nM or 63 nM VSD respectively) versus membrane voltage. ΔF/F per 100 mV = (−4.7 ± 1.1)%, SNR = 4.5 ± 0.5, n = 5; mean ± SEM for di-2-ANEP-VoLDeMo (12). ΔF/F per 100 mV = (13.1 ± 3.7)%, SNR = 14.2 ± 2.9, n = 5; mean ± SEM for dsRVF5-VoLDeMo (13).
Next, we quantified the binding of VoLDeMo probes to hDAT. Both di-2-ANEP-VoLDeMo (12) and dsRVF5-VoLDeMo (13) inhibited APP+ uptake into hDAT-HEK cells with the following IC50 values: (74 ± 3) nM for 12, corresponding to (55 ± 3) nM with respect to the VSD and (103 ± 5) nM with respect to the ligand; and (45 ± 2) nM for 13, corresponding to (34 ± 1) nM VSD and (63 ± 2) nM ligand (Fig. S11), showing only a minor loss in DAT inhibitory potency (as a measure of binding affinity) compared to those of dichloropane derivative 5 and rhodamine probe 6.
We further verified that di-2-ANEP and dsRVF5 dyes remain voltage sensitive when attached to dextran as a part of VoLDeMo probes. hDAT-HEK cells labeled with di-2-ANEP-VoLDeMo (12; 100 nM dextran/74 nM VSD) or dsRVF5-VoLDeMo (13; 100 nM dextran/63 nM VSD) were whole-cell voltage clamped. The cells were first held at −60 mV to mimic the resting membrane potential of neurons, then subjected to DC holding potential steps ranging from −100 mV to +80 mV in 30 mV intervals and imaged at 200 Hz (Fig. 4b and e). In the case of di-2-ANEP-VoLDeMo (12), we observed a decrease in fluorescence intensity following depolarization of the membrane potential, which is common for electrochromic VSDs when excited at the red edge of their absorption band.57 When the fractional fluorescence change was plotted against the membrane potential, a linear plot (R2 = 0.998) with a ΔF/F per 100 mV = (−4.7 ± 1.1)% was obtained (n = 5, Fig. 4c). This result was comparable to what was previously demonstrated for ANEP class dyes.57 For dsRVF5-VoLDeMo (13), we observed increased fluorescence intensity with increasing membrane potential, as expected for the PeT-based class of VSDs.39 The plot of fractional fluorescence change vs. membrane potential was found to be linear (R2 = 0.999) with a ΔF/F per 100 mV = (13.1 ± 3.7)% (n = 5, Fig. 4f).
Under whole-cell voltage clamp mode, hDAT-HEK cells were also subjected to simulated trains of rapid depolarizations to explore the temporal resolution of VoLDeMo probes in resolving AC voltage changes. Cells labeled with di-2-ANEP-VoLDeMo (12; 100 nM dextran/74 nM VSD) or dsRVF5-VoLDeMo (13; 100 nM dextran/63 nM VSD) were held at −60 mV and subjected to bursts of ten individual voltage spikes of 2 ms length and 100 mV magnitude to resemble the membrane action potential of a typical neuron. The ten voltage spikes within one burst were applied at 100 Hz in frequency. At 1 kHz imaging rate, both VoLDeMo probes 12 and 13 were able to detect and distinctively resolve individual voltage spikes within one burst (Fig. S12).
We compared the photostability of VoLDeMo probes 12 and 13 with that of the corresponding untethered VSDs 1 and 2, respectively. While no significant difference in photostability was observed between dsRVF5-VoLDeMo (13) and dsRVF5 (2) (605 nm illumination; Fig. S13b), di-2-ANEP-VoLDeMo (12) was significantly more photostable than di-2-ANEPEQ (1) (450 nm illumination; Fig. S13d). It has been previously shown that polymeric or macrocyclic materials including polysaccharides can increase the photostability of fluorescent dyes by decreasing the availability of the excited chromophore to the attack of nucleophilic species from the surrounding environment.58,59 We hypothesize that the dextran polymer carrier may be playing this protective role in the case of di-2-ANEP-VoLDeMo (12). In addition, although the core chromophore in probes 12 and 1 is identical, we note that the photostability of di-2-ANEPEQ (1) could be affected by the charged quaternary ammonium group in direct vicinity of the dye. The dextran-tethered di-2-ANEP-VoLDeMo (12) does not require this second charged group to prevent membrane crossing, while maintaining voltage sensitivity and showing higher photostability.
VoLDeMo probes deliver VSDs to dopamine and norepinephrine axons in mouse brain tissue.
The next key test for the targeted constructs was the examination of labeling specificity in acute mouse brain tissue. We specifically focused on two regions with vastly different density of catecholamine axons, the dorsal striatum and somatosensory cortex (Fig. 5). The dorsal striatum (dSTR) receives dense dopaminergic axonal projections from neurons originating in the substantia nigra compacta (SNc) in the midbrain that highly arborize at their target (Fig. 5a).60 Striatal brain slices (living slice preparations, see Supporting Information) incubated with di-2-ANEP-VoLDeMo (12, 100 nM dextran/74 nM VSD, 30 min) exhibited a string-like, punctate pattern of fluorescent labeling (Fig. 5b, Fig. S14a), typical for dopaminergic axons in this region.32 Quantitative colocalization with an established dopamine probe FFN102 gave a high level of colocalization (78.0% ± 3.5%, n = 3, Fig. S15), which was significantly higher than the respective scrambled control (17.3% ± 2.3%, P < 0.0001, two-tailed unpaired t-test). Furthermore, a high level of colocalization was observed with green fluorescent protein (GFP) expressed under the control of the tyrosine hydroxylase (TH, a marker of catecholamine neurons) promoter in the striatum of TH-GFP mice (Fig. S16a). As expected, pre-incubation and co-incubation with nomifensine (2 μM) diminished the targeting of dopamine axons and resulted in predominantly diffuse background labeling, indicating that the axonal labeling is dependent on DAT (Fig. 5b). To further demonstrate the high degree of VoLDeMo selectivity, we incubated striatal brain slices with untethered di-2-ANEPEQ (1, 100 nM, 30 min). As expected, a dramatically contrasting pattern corresponding to non-specific fluorescent labeling of cell membranes was observed (Fig. 5b).
Figure 5. Targeting of VoLDeMo probes to catecholamine axons in mouse brain slices.

(a) Nissl stained sagittal slice of a mouse brain (image credit: Allen Institute61,62) with a schematic representation of a dopaminergic neuron originating in the SNc and highly arborizing in the dSTR. The blue rectangle indicates the approximate region where the images in (b) and (c) were acquired via two-photon excitation microscopy. (b, c) Representative images of striatal slices labeled with di-2-ANEP and dsRVF5 probes, respectively. Left: striatal slice incubated with the targeted di-2-ANEP-VoLDeMo (12; 100 nM dextran/74 nM VSD, 30 min, 15 μm depth from the tissue surface) or dsRVF5-VoLDeMo (13; 100 nM dextran/63 nM VSD, 30 min, 15 μm depth), respectively; middle: an analogous experiment with pre- and co-incubation with the DAT/NET blocker nomifensine (2 μM); right: striatal slice incubated with untargeted di-2-ANEPEQ (1, 100 nM, 30 min, 15 μm depth) or dsRVF5 (2, 100 nM, 30 min, 15 μm depth), (d) Nissl stained sagittal slice of a mouse brain (image credit: Allen Institute61,62) with a schematic representation of a noradrenergic neuron originating in the LC with sparse axonal projections in the CTX. The blue rectangle indicates the approximate region in the somatosensory cortex where the images in (e) and (f) were acquired via two-photon excitation microscopy. (e, f) Representative images of cortical slices labeled with di-2-ANEP and dsRVF5 probes, respectively. Left: cortical slice incubated with the targeted di-2-ANEP-VoLDeMo (12; 100 nM dextran/74 nM VSD, 30 min, 15 μm depth) or dsRVF5-VoLDeMo (13; 100 nM dextran/63 nM VSD, 30 min, 15 μm depth), respectively; middle: an analogous experiment with pre- and co-incubation with nomifensine (2 μM); right: cortical slice incubated with untargeted di-2-ANEPEQ (1, 100 nM, 30 min, 15 μm depth) or dsRVF5 (2, 100 nM, 30 min, 15 μm depth). Images within the same panel were contrasted equally. ANEP probes 1 and 12 were excited at 920 nm and emission collected at 570–610 nm. dsRVF5 probes 2 and 13 were excited at 820 nm and emission collected at 570–610 nm.
We next tested the labeling of striatal slices with dsRVF5-VoLDeMo (13) bearing the more lipophilic and larger rhodol-based VSD. Remarkably, dSTR brain slices incubated with dsRVF5-VoLDeMo (13; 100 nM dextran/63 nM VSD, 30 min) exhibited a similar string-like pattern of fluorescent labeling as its di-2-ANEP counterpart (Fig. 5c, Fig. S14b). Pre-incubation and co-incubation with nomifensine (2 μM) produced a diffuse background staining (Fig. 5c). The high degree of dsRVF5-VoLDeMo (13) selectivity in striatal slice was further demonstrated by comparison to untethered dsRVF5 (2, 100 nM, 30 min, Fig. 5c), which labeled many cell membrane compartments.
To our knowledge, these are the first examples of selective delivery of diffusible VSDs to specific neuronal cell types in mammalian brain tissue via a purely chemical approach without any genetic manipulation, as well as the first direct targeting to specific axonal projections and release sites in brain tissue with such probes.
The somatosensory cortex (CTX), unlike the dSTR, contains a far lower density of catecholaminergic axons, which we recently reported are mostly noradrenergic extensions expressing NET34 originating in the locus coeruleus (LC) (Fig. 5d).63 These sparse projections represent a more challenging target for VoLDeMo probes, due to the far lower ratio of target noradrenergic cells to other non-target cells and tissue components. Despite this, cortical brain slices incubated with di-2-ANEP-VoLDeMo (12; 100 nM dextran/74 nM VSD, 30 min) exhibited a distinctive fluorescent labeling pattern (Fig. 5e, Fig. S14c) typical of noradrenergic axons in this brain area.34 There appeared to be no prominent non-specific uptake of the probes by resident cell bodies, either in the cortex or striatum. Similar to the striatum, a high level of colocalization was observed between di-2-ANEP-VoLDeMo (12) labeling and TH-GFP in the cortex (Fig. S16b). Similar control experiments were employed as in the striatal slices: pre-incubation and co-incubation with nomifensine (2 μM) nearly abolished the string-like labeling (Fig. 5e); and incubation of a cortical brain slice with untethered di-2-ANEPEQ (1, 100 nM, 30 min) produced a pattern corresponding to non-specific fluorescent labeling of the brain tissue (Fig. 5e). Consistent with appropriate targeting, dsRVF5-VoLDeMo (13; 100 nM dextran/63 nM VSD, 30 min) produced a sparse string-like fluorescent labeling pattern in the cortical slice (Fig. 5f, Fig. S14d), albeit with slightly higher background than di-2-ANEP-VoLDeMo (12; Fig. 5e). This construct also showed occasional bright punctate or tubular objects larger than the axonal strings or varicosities, which we ascribe to non-specific labeling and/or clustering of the probe. Despite the combination of a low density of noradrenergic projections in somatosensory cortex together with the higher lipophilicity of the dsRVF5 VSD, a dramatic contrast was observed compared to images obtained with nomifensine (2 μM) inhibition and unmodified dsRVF5 (2, 100 nM, 30 min, Fig. 5f).
Both di-2-ANEP- and dsRVF5-VoLDeMo constructs showed good diffusion in living tissue, capable of carrying the embodied lipophilic VSDs to depths typically used in our laboratories for imaging acute slices under standard experimental conditions. Diffusion to depths below 30 μm in the striatum could be achieved using higher probe concentrations while maintaining high labeling specificity (Fig. S17). In addition, the less lipophilic di-2-ANEP-VoLDeMo (12) generally penetrated deeper than dsRVF5-VoLDeMo (13) under the same conditions.
VoLDeMo probes also exhibited clear, ligand-dependent labeling in whole adult brains from Drosophila melanogaster. Incubation of ex vivo preparations of whole living fly brains with VoLDeMo probes resulted in a punctate labeling pattern, partially co-localizing with a dopaminergic marker, which was abolished by inhibition with dichloropane derivative 5 or when the non-targeted di-2-ANEPEQ (1) was used (Fig. S18 and Drosophila Brain section in the Supporting Information). This demonstrates the versatility of the VoLDeMo probes across different species and experimental preparations.
dsRVF5-VoLDeMo enables recording of evoked activity in striatal dopaminergic axons.
Compared to protein-based genetically encoded voltage indicators (GEVIs) or hybrid chemo-genetic voltage sensors relying on overexpressed membrane proteins, VoLDeMo probes are targeted only to a relatively small population of natively expressed monoamine transporters. Therefore, the ultimate challenge for VoLDeMo probes was to obtain functional recordings in ex vivo rodent brain slices with the limited photon output from these targeted sensors. We labeled mouse striatal slices with dsRVF5-VoLDeMo (13; 676 nM dextran/500 nM VSD, 30 min; Fig. 6a). Next, we performed electric stimulation (25 pulses at 50 Hz during a 0.5 s period) while recording two-photon fluorescence images with spiral scanning (Fig. 6b) at 30 Hz. This slow scanning approach does not provide recording of single action potentials but does enable recording of overall activity of the selected region (5.5 × 10³ μ2 in Fig. 6b). Indeed, we observed increase in fluorescence during the stimulation period upon averaging multiple trials (ΔF/F= (0.12 ± 0.03)%, mean ± SEM, n = 100 from 10 slices, P < 0.0001, two-tailed unpaired t-test) when referenced to an analogous experiment where tetrodotoxin (TTX, 1 μM, n = 50 from 5 slices) was used to block the propagation of action potentials (Fig. 6c, d; Fig. S19). Since a stimulation-dependent artifact (baseline-drift) was observed for all measurements (Fig. S19c), traces shown in big. 6c are represented as the difference between the measurement in the absence and in the presence of TTX – a normalization strategy which accounts for the stimulation-dependent drift while leaving the voltage-dependent signal unaffected. To our knowledge, this is the first example of optical voltage recording from a specifically targeted neuronal population in brain tissue without any genetic manipulation, as well as the first such recording specific to axons.
Figure 6. Two-photon fluorescence recording of evoked activity in striatal dopaminergic axons.

(a) Representative two-photon fluorescence image of a striatal slice labeled with dsRVF5-VoLDeMo (13; 676 nM dextran/500 nM VSD, 30 min, 35 μm depth from the tissue surface). (b) Representative image of a single two-photon spiral scan frame from the recording of evoked activity in panels (c) and (d), demonstrating the field of view and spatial resolution. (c) Fluorescence trace recorded at 30 Hz from striatal slices labeled with dsRVF5-VoLDeMo (13; 676 nM dextran/500 nM VSD, 30 min) with electric stimulation (25 pulses at 50 Hz, period highlighted in yellow). The trace is normalized to an analogous experiment conducted in the presence of TTX (1 μM) and is an average from multiple trials (n = 100 from 10 slices). A two-point moving average was applied to smooth the trace. (d) Mean fluorescence (± SEM) of the voltage recording from (c) during the stimulation and pre-stimulation periods. ΔF/F = (0.12 ± 0.03)% (n = 100 from 10 slices, P < 0.0001, two-tailed unpaired t-test).
Dextran is compatible with ligand-directed acyl imidazole chemistry.
A potential drawback of VoLDeMo design is the inherent perturbation of the system by the blockage of an important transporter protein upon ligand binding. Recent development in ligand-directed covalent labeling strategies provided tools to circumvent this issue.64 Among these, ligand-directed acyl imidazole (LDAI) chemistry developed by Hamachi and coworkers65 stood out as a highly efficient labeling strategy which has been employed in covalent labeling of membrane proteins in brain tissue.43,66 We therefore sought to investigate whether the cleavable acyl imidazole linker is compatible with a dextran polymer, a potentially nucleophilic polyol.
The N3 functional group, compared to its BCN click chemistry partner, is significantly more robust for incorporation into a broad range of molecular architectures, including acyl imidazoles. We therefore decided to reverse the click partners for these studies, using BCN-functionalized dextran(6000) and N3-functionalized ligand and probe. We used a similar strategy as introduced in Fig. 2c to incorporate BCN groups to the dextran polymer by a carbonate linkage (Fig. 7a). While we were still able to achieve good control over dextran coverage with BCN groups (w in compound 15-w), only 72-84% of the introduced groups were available for further functionalization by click chemistry (see Supporting Information for detailed discussion of this phenomenon). Next, we reacted 15-2.95 with model N3-functionalized acyl imidazole 16 in DMSO-d6 (Fig. 7b) while following the reaction progress by 1H NMR (Fig. 7c). The reaction reached 68% conversion within 30 min when the first NMR spectrum was taken and was fully completed within 6 h. The reaction mixture containing product 17 sealed in an NMR cuvette at room temperature was further monitored for 31 days during which no formation of ω-N-acetylhistamine (AcHA), the expected product of acyl imidazole decomposition, was observed (Fig. 7c). Acyl imidazoles covalently attached to dextran are therefore stable in DMSO-d6, solution at room temperature at least on the timescale of months. We then removed the DMSO-d6, solvent under high vacuum, redissolved product 17 in D2O, and monitored its stability by 1H NMR (Fig. S20, Table S1). While formation of AcHA was observed in the aqueous environment, a low extent of decomposition was observed in aqueous environment on the timescale of hours (16% decomposition at 3 hours, 40% at 24 h). We therefore concluded that acyl imidazoles covalently attached to dextran are sufficiently stable and thus compatible with a majority of labeling and imaging experiments.
Figure 7. Dextran is compatible with ligand-directed acyl imidazole chemistry.

(a) Synthesis of BCN-carbonate-dextran(6000) (15-w). Number w reflects the degree of dextran functionalization with BCN ligands (average number of BCN functionalities per polymer molecule, see Supporting Information for details). (b) Reaction of 15-2.95 with model acyl imidazole 16. (c) 1H NMR (500 MHz, DMSO-d6, c = 11 mM) monitoring of the reaction in panel (b) (diagnostic region 6.6 to 9.0 ppm). Three sets of signals (a, b and c as indicated in the structure) are well separated between the starting material (16, designated as *) and the product (17, designated as #). Dotted lines are a visual aid for peaks indicating disappearance of the starting material (16) signals over time. The bottom spectrum represents 1H NMR (500 MHz, DMSO-d6, c = 11 mM) of ω-N-acetylhistamine (AcHA), the expected product of acyl imidazole decomposition.
VoLDeCAM covalently targets voltage sensitive dyes to AMPA receptors in brain tissue.
We employed our VoLDe platform to covalently target the AMPA receptor (AMPAR), a major ionotropic glutamate receptor in the central nervous system, using the “Chemical AMPAR Modification” (CAM) strategy developed by Hamachi and coworkers (Fig. 1d).43 Although AMPAR is broadly expressed in many neuronal types, it represents an attractive target due to its synaptic localization.67 The distribution and localization of AMPAR is distinct from that of monoamine transporters targeted by VoLDeMo probes, representing yet another challenge for the targeting selectivity of the VoLDe platform. Striatal slices co-labeled with di-2-ANEP-VoLDeMo (12) and CAM2(Fl) (a fluorescent probe composed of an AMPAR selective PFQX ligand, an acyl imidazole linker and fluorescein as a polar fluorophore)43 demonstrated the contrast between the string-like pattern of DAT labeling and the punctate AMPAR labeling (Fig. S21).
We combined BCN-dextran 15-2.95 with N3-terminated dsRVF5 VSD (18) and the PFQX ligand with a suitable acyl imidazole linker43 (PFQX-Aclm, 19), providing the targetable dsRVF5-VoLDeCAM probe (21, Fig. 8a). The reaction was carried out in DMSO-d6 with 1H NMR monitoring, using 0.95 eq. of total N3 (18 + 19) with respect to BCN (Fig. S22. Without excess reagents, the reaction mixture provided pure product upon completion and could be directly used for imaging. Similarly as for the VoLDeMo probes, we used 0.7 eq. of dsRVF5 with respect to dextran(6000) to avoid the formation of polymer molecules carrying two or more VSDs. A 1:3 dsRVF5/PFQX-AcIm ratio was used to ensure sufficient ligand coverage. Analogously, we also synthesized control probe 22, containing a dummy ligand in place of PFQX-AcIm (Fig. 8a, Fig. S23).
Figure 8. Synthesis of dsRVF5-VoLDeCAM and its targeting in brain tissue.

(a) One-pot assembly of dsRVF5-VoLDeCAM (21) and the corresponding ligand-free control probe (22) via click chemistry by reacting BCN-dextran 15-2.95 with a 1:3 mixture of VSD 18 and the PFQX-AcIm ligand 19 or the dummy ligand 20, respectively. Note: Dextran branching is omitted for clarity. Linker substitution on dextran is shown only in position 2. (b, d) Nissl stained sagittal slices of a mouse brain (image credit: Allen Institute61,62). Highlighted in red are brain regions – somatosensory cortex (CTX) and dorsal striatum (dSTR) – from which images in panels (c) and (e), respectively, were taken, (c, e) Representative two-photon excitation microscopy images of cortical (c) and striatal (e) slices labeled with dsRVF5-VoLDeCAM. Left: slice incubated with the targeted dsRVF5-VoLDeCAM (21; 71 nM dextran/50 nM VSD; 2 h; 30 μm depth); middle: an analogous experiment with pre- and co-incubation with the AMPAR blocker NBQX (10 μm); right: the corresponding slice incubated with the untargeted control probe 22 (71 nM dextran/50 nM VSD; 2 h; 30 μm depth). Images within the same panel were contrasted equally. The probes were excited at 820 nm and emission collected at 570–610 nm. Scale bars are 20 μm.
As the CAM labeling strategy has been established in brain tissue,43 we investigated the use of our VoLDeCAM probes in mouse cortical and striatal slices. In contrast to the monoamine transporters targeted by the VoLDeMo probes, AMPAR is highly abundant in the nervous system. Consequently, a dense punctate labeling pattern was observed upon labeling cortical or striatal neurons with dsRVF5-VoLDeCAM (21; 71 nM dextran/50 nM VSD, 2 h; Fig. 8b–e), comparable to that of the control probe CAM2(F1) (Fig. S21).43 Potentially due to the increased density of AMPAR, longer incubation times (2 h) were required for sufficient penetration of dsRVF5-VoLDeCAM (21) through brain tissue than for VoLDeMo probes (30 min). The labeling was strongly diminished upon co-incubation with the AMPAR blocker NBQX or using the ligand-free control probe 22, demonstrating ligand-dependent delivery of dsRVF5 (Fig. 8c, e).
Next, we investigated whether labeling with dsRVF5-VoLDeCAM (21) affects the native function of AMPAR by whole-cell patch-clamp recordings from layer V pyramidal neurons in the prefrontal cortex. While selective labeling was observed in this region when incubating cortical slices with dsRVF5-VoLDeCAM (21) for 2 h at 10, 50 and 100 nM (concentrations with respect to VSD, Fig. S24), we observed concentration-dependent attenuation of electrically-evoked excitatory postsynaptic currents (eEPSCs; Fig. S25) by 32%, 58% and 86% respectively, which persisted even after washing (continuous perfusion with artificial cerebrospinal fluid, ACSF) of the slice for 1 h. We also recorded spontaneous excitatory postsynaptic currents (sEPSCs) of cortical slices labeled with dsRVF5-VoLDeCAM (21). sEPSC frequency was attenuated in a concentration-dependent manner (Fig. S26a, b, e), while sEPSC amplitude was affected only negligibly (Fig. S26c, d, e). This indicates that although partial blockage of AMPAR occurs, the remaining receptors are fully functional. Several factors could lead to such attenuation. Since 2.1 eq. of PFQX ligand per dextran polymer have been used to prepare dsRVF5-VoLDeMo (21), multivalent species are formed which could block AMPAR with a second ligand molecule even after covalent attachment. We also observed that high concentrations (1 μM) of PFQX derivative S2 (Fig. S26a) attenuated the sEPSC frequency under the same loading conditions (2 h incubation at ambient temperature followed by ACSF perfusion; Fig. S26a). This suggests that at high ligand concentrations, the internalization of AMPAR, a well-established phenomenon,68 likely occurs. The ligand-free control probe 22, loaded at high concentration which leads to non-specific membrane labeling (1 μM, 2 h), also partially attenuated sEPSC frequency (Fig. S26a). This suggests that loading the cell membrane with dextran-bound dsRVF5 can partially affect the excitability of cortical neurons in a ligand-independent manner. Although dsRVF5-VoLDeCAM (21) partially perturbs the native function of AMPAR in cortical tissue, the receptors nevertheless retain a significant fraction of their activity at probe concentrations that provide clear and selective labeling.
dsRVF5-VoLDeCAM enables two-photon fluorescence recording of evoked activity in cortical neurons.
Given the ability to record optical changes driven by evoked activity in striatal dopaminergic axons with dsRVF5-VoLDeMo (13), we tested whether dsRVF5-VoLDeCAM (21) enables similar analyses from AMPAR-expressing cortical neurons. We labeled mouse cortical slices with dsRVF5-VoLDeCAM (21; 143 nM dextran/100 nM VSD, 2 h; Fig. 9a). Electric stimulation (25 pulses at 50 Hz during a 0.5 s period) while recording two-photon fluorescence images with spiral scanning (Fig. 9b) at 30 Hz resulted in an increase in fluorescence with a ΔF/F of (0.28 ± 0.02)% (n = 50 from 5 slices, P < 0.0001, two-tailed unpaired t-test; Fig. 9c, d). The trace shown in Fig. 9c is normalized to an analogous experiment in the presence of 1 μM TTX (vide supra and Fig. S27).
Figure 9. Two-photon fluorescence recording of evoked activity in AMPAR-expressing cortical neurons.

(a) Representative two-photon fluorescence image of a cortical slice labeled with dsRVF5-VoLDeCAM (21; 143 nM dextran/100 nM VSD, 2 h, 35 μm depth from the tissue surface). (b) Representative image of a single two-photon spiral scan frame from the recording of evoked activity in panels (c) and (d), demonstrating the field of view and spatial resolution. (c) Fluorescence trace recorded at 30 Hz from cortical slices labeled with dsRVF5-VoLDeCAM (21; 143 nM dextran/100 nM VSD, 2 h) with electric stimulation (25 pulses at 50 Hz, period highlighted in yellow). The trace is normalized to an analogous experiment conducted in the presence of TTX (1 μm) and is an average from multiple trials (n = 50 from 5 slices). A two-point moving average was applied to smoothen the trace. (d) Mean fluorescence (± SEM) of voltage recording from (c) during the stimulation and pre-stimulation periods. dsRVF5-VoLDeCAM (21) exhibits a ΔF/F of (0.28 ± 0.02)% (n = 50 from 5 slices, P < 0.0001, two-tailed unpaired t-test).
dsRVF5-VoLDeCAM enables one-photon fluorescence recording of voltage holdings in patch clamped cortical neurons.
We then sought to employ dsRVF5-VoLDeCAM (21) to obtain recordings of membrane potential changes from single neurons under voltage clamp conditions. We labeled mouse cortical slices with dsRVF5-VoLDeCAM (>21; 143 nM dextran/100 nM VSD, 2 h) and performed whole-cell patch-clamp recordings of layer V pyramidal neurons. We held the neuron at −60 mV in the voltage clamp mode and subjected it to five 500 ms, 100 mV depolarization steps to +40 mV (Fig. 10a) while recording one-photon fluorescence from an ROI surrounding the neuronal body. We also performed control experiments where neurons were constantly held at −60 mV for 7 s (the entire duration of optical recording). Upon averaging recordings from n= 18 neurons, a clear increase in fluorescence intensity was observed during the depolarization steps (Fig. 10b, c), while no statistically significant change from baseline was observed in the control experiment at constant potential (Fig. 10b, d). A depolarization-dependent increase in fluorescence was observed in 17 of 18 neurons (Fig. 10e), while a 7/11 increase/decrease ratio was observed in the control experiment at constant potential (Fig. 10f). These results demonstrate that VoLDeCAM probes can be used to perform voltage recordings from individual neurons under voltage clamp conditions. We note that AMPAR targeting produces a dense label of neuropil surrounding the patch-clamped neuron (see labeling pattern in Fig. 8c) which contributes strongly to the background and likely reduces the magnitude of the signal.
Figure 10. One-photon fluorescence voltage recording from patch-clamped cortical neurons.

Mouse cortical slices were labeled with dsRVF5-VoLDeCAM (21; 143 nM dextran/100 nM VSD, 2 h) and layer V cortical neurons were subjected to whole-cell patch clamp. (a) Schematic of the stimulation profile used in this experiment. (b) One-photon fluorescence recording (50 Hz) of labeled cortical neurons subjected to the stimulation profile in (a) (blue) or constantly held at a resting potential of −60 mV (grey). Depolarization period highlighted in yellow. Averaged traces (n = 90 depolarization steps from 18 neurons) smoothened by a 5-point moving average. (c) dsRVF5-VoLDeCAM (21) exhibited a significant fluorescence increase (ΔF/F per 100 mV = (0.32 ± 0.12)%, n = 90 depolarization holdings from 18 neurons; mean ± SEM) during the 100 mV depolarization step (yellow in panel b) compared to resting potential (P < 0.0001, two-tailed unpaired t-test). (d) An insignificant difference in fluorescence was recorded during the corresponding timeframes when the neuron was constantly held at −60 mV (n = 90 periods from 18 neurons, P = 0.11, two-tailed unpaired t-test). Error bars represent ± SEM. (e) For each neuron subjected to five 100 mV depolarization waves, average fluorescence from the depolarization periods (red, also red in panel a) was compared to the average fluorescence from the resting periods (green, also green in panel a). A blue line connects corresponding datapoints. For 17 out of 18 neurons, increase in fluorescence was observed. (f) Analogous representation for neurons constantly held at −60 mV. Increase in fluorescence was observed in 7 cases, while decrease was observed in 11 cases.
Discussion
Here, we introduce a targeting platform to enable the delivery of lipophilic voltage sensitive dyes to specific neuronal cell types in brain tissue without genetic manipulation. Our system consists of three components combined into a macromolecular sensor: 1) A fluorescent indicator of membrane potential (lipophilic voltage sensitive dye). The classical electrochromic di-2-ANEP36,37 and state-of-the-art dsRVF538,39 probes were chosen as model VSDs. 2) A small molecule ligand that binds strongly to the target membrane protein from the extracellular side. The monoamine transporter ligand dichloropane40,41 and the AMPAR ligand PFQX42 (the latter in conjunction with a linker for ligand-directed acyl imidazole covalent labeling43) were used. 3) A polar polymer carrier represented by the polysaccharide dextran that compensates for the lipophilicity of the VSD by dynamic encapsulation, thus limiting non-specific binding of the probe to cell membranes while enabling diffusion through tissue.
In contrast to previous approaches which were successful only in targeting VSDs in cell23–25 or neuronal cultures26–28 while demanding high expression levels of genetically encoded protein targeting modalities, we designed VoLDe probes to target specific cell types in native brain tissue of wild-type rodent brain slices and whole Drosophila brains using endogenous membrane proteins at physiological expression levels. The delivery of a relatively small number of dye molecules dictated by native expression levels of the protein target poses a great challenge in terms of both targeting selectivity and voltage sensitivity.
Remarkably, the level of selectivity observed with VoLDeMo for dopaminergic axons in the striatum is comparable to that of the genetically-encoded GFP labeling under the control of the TH promoter, and to the small molecule, highly hydrophilic FFN102 probe.32 A similarly high selectivity was observed with VoLDeCAM targeting AMPAR-expressing terminals in the cortex and striatum. Although the binding selectivity of VoLDe probes is governed by a high affinity ligand, the dextran polymer carrier plays a crucial role in the targeting process. The high polarity of the dextran polymer compensates for the lipophilicity of the VSD, while its flexibility (and to some extent amphiphilic character) likely enables dynamic encapsulation of the dye, leading to relatively low background staining and high diffusion through the brain tissue. Such dynamic behavior will be studied further to optimize the targeting capacity and tissue diffusion of small polymers. Especially dsRVF5-VoLDeMo (13) will benefit from further optimization of the polymer carrier to improve the labeling specificity in highly challenging environments with sparse distribution of target cells and projections (such as noradrenergic axons in the cortex, see Fig. 5f).
Although state-of-the-art synthetic voltage sensors are superior to GEVIs in many photophysical parameters such as voltage sensitivity,69,70 photostability,71 and photon output,72 VoLDe probes cannot compete with overexpressed GEVIs or hybrid chemo-genetic tools73 in recording single action potentials. Here, we provide an initial examination of the limits of optical voltage imaging with synthetic sensors delivered to protein targets at native expression levels. Both VoLDeMo and VoLDeCAM probes were successfully used to record electrically evoked activity in striatal dopaminergic axons and cortical AMPA-expressing neurons respectively after signal averaging. In addition, VoLDeCAM was used to record depolarization steps in individual cortical neuronal bodies after averaging multiple trials. These results are, to our knowledge, the first examples of optical voltage recordings from specific cell types in brain tissue targeted via a pure chemical approach, without any genetic manipulation. This proof of concept study delineates the boundaries of targeted voltage imaging without the use of genetic manipulation and provides a baseline for future improvement of sensors, imaging software, and hardware to enable high fidelity optical voltage recordings in wild-type species. Specifically, the VoLDe platform suffers primarily from the low photon budget defined by the small number of protein targets to which the probe is delivered. Consequently, fast voltage imaging at kHz rates in brain tissue is currently impossible and compromises in spatial resolution were necessary to provide sufficient signal (see Fig. 6b, where a single pixel comprises 30 μm2, losing the resolution of individual ~1 μ2 dopamine release sites). Significantly brighter VSDs, as well as improved instrumentation enabling more efficient photon collection and noise attenuation would promote the practical applicability of VoLDe probes. Nevertheless, non-genetic targeting of probes is desirable especially in models of brain disorders which often require multiple genetic modifications74, making further manipulation in order to install GEVIs challenging. Overexpressed GEVIs can further face a variety of issues including toxicity or increased membrane capacitance.16
In the present recordings with the VoLDe probes in brain tissue, we record voltage changes that occur more slowly than single action potentials (~1 ms), specifically in the range of 10 to 1000 ms. This temporal regime could nevertheless be useful for studying many physiological processes such as behaviorally relevant changes in circuit activity. For example, midbrain dopamine cell bodies fire tonically at ~4 Hz with superimposed bursts at ~20 Hz that are triggered by environmental stimuli.75 The ability to measure changes due to burst firing promises a means to image the physiologically appropriate “language” of these neurons, and to do so from axons, the sites responsible for neurotransmitter release, is a goal that to date has eluded the field.
The modular design of dextran-based VoLDe probes offers many possibilities in terms of the potential applications and impact. Regarding the payload, we first focused on VSDs, since these sensors report on membrane potential changes – a fundamental process in the nervous system – and are exceptionally challenging to deliver to specific cells and neurites due to their high lipophilicity. In this sense, VSDs represent a high bar for testing the targeting efficacy of the designed molecular delivery constructs. Our findings indicate that the dextran platform promises a means to accommodate a wide variety of lipophilic cargo molecules. Imaging modalities such as photoacoustic (PA) imaging20–22 and short-wave infrared (SWIR) fluorescence imaging18,19 also utilize lipophilic synthetic imaging agents, while few genetically-encoded PA probes76,77 and no genetically encoded SWIR probes have been developed to date. The concept of the VoLDe targeting platform may therefore offer a promising solution to cell specific targeting of PA and SWIR probes in the brain. Our platform may also be applied to include actuators, signaling modulators, and drugs, thus unlocking chemical and chemogenetic approaches to cell specific imaging and pharmacology.78
In terms of the cell-targeting component of VoLDe probes, dichloropane and PFQX can be substituted for a variety of ligands, unlocking the possibilities of targeting phenotype/pathology-associated cell surface molecules. Furthermore, the VoLDe system will be readily adaptable to chemo-genetic targeting using covalent tagging strategies (e.g. SNAP-tag79, Halo-tag,80 or TMP-tag81) by substituting the ligand for a suitable electrophile. In the current version of the VoLDeMo system, targeting DAT or NET by the dichloropane ligand perturbs the experimental system by blocking these native neurotransmitter transporters. This is a general problem with receptor ligands, as the agonist/antagonist activity of these compounds perturbs the system under study. We tackled this issue in the VoLDeCAM system by employing a recently developed ligand-directed acyl imidazole covalent labeling approach,43 which we show is compatible with the potentially nucleophilic dextran polymer carrier. Although full “tracelessness” was not achieved in VoLDeCAM, partial retention of native AMPAR function was achieved under conditions which provided clear and specific labeling with our sensor. We hypothesize that improvement of the traceless labeling strategy will be possible by developing more specific functionalization of the dextran polymer, which will not lead to stochastic multivalent species but rather well-defined assemblies containing one ligand molecule per polymer carrier.
For in vivo applications, a major issue is the delivery of exogenous diffusible chemical probes to the brain. In small laboratory animals, local injection into brain parenchyma is feasible.34 In the long term, less invasive methods are required for research in animals and to pave the way toward clinical applications – one of the major rationales for developing chemically targeted imaging and pharmacological agents. These may include intrathecal administration that circumvents the blood-brain barrier (BBB), or intravenous administration coupled with BBB penetration approaches, based on either temporary physical disruption of BBB (e.g., focused ultrasound methods) or exploitation of native transporter systems.
In summary, VoLDe probes represent the first non-genetic platform for targeting lipophilic voltage sensitive dyes to specific neuronal cells and their axons in brain tissue. We show that voltage recording from specific cell populations in wild-type mammalian brain tissue is feasible and define the frontier of optical voltage recording with probes targeted to endogenous membrane proteins at their native expression levels. Although many issues remain to be addressed in terms of functional parameters and practical applicability of targeted VSDs, small carbohydrate polymers show great promise as the molecular platform for cell-selective imaging and pharmacology. We have demonstrated the feasibility of a chemical targeting approach that will be applicable to other lipophilic sensors, actuators or drugs.
Methods
All experimental procedures are described in detail in the Supporting Information.
Supplementary Material
Acknowledgements
This paper is dedicated to the memory of James H. Handelman (the G. Harold & Leila Y. Mathers Charitable Foundation). We thank Prof. Rafael Yuste (Department of Biological Sciences, Columbia University) and Dr. Yuki Bando (Department of Biological Sciences, Columbia University; current address: Department of Organ and Tissue Anatomy, Hamamatsu University School of Medicine, Japan) for their generous help with electrophysiology experiments in cell cultures. We also thank Christopher Hwu (Department of Chemistry, Columbia University) for assistance with DAT inhibition experiments, Matthew Ding (Department of Chemistry, Columbia University) for assistance with compound synthesis, and Dr. Brandon Fowler (Department of Chemistry, Columbia University) for HRMS analysis. T.F. is the recipient of the Alfred Bader Fellowship in Organic Chemistry. This work was supported by the G. Harold & Leila Y. Mathers Charitable Foundation (to D. Sames), The National Institute of Mental Health (NIMH) of the National Institutes of Health (NIH), grant R01MH122470 (to D. Sames and D. Sulzer), the Collaborative and Multidisciplinary Pilot Research (CaMPR) award (to D.M.M.), the National Institute on Drug Abuse (NIDA) of NIH, grant R01DA07418 (to D. Sulzer) and the JPB Foundation (to D. Sulzer). The work in Drosophila brain was supported by John F. and Nancy A. Emmerling Fund of The Pittsburgh Foundation (to Z.F.), start-up funds from the University of Pittsburgh Department of Psychiatry (to Z.F.), start-up funds from the University of Pittsburgh Department of Neurobiology (to C.E.C. and Z.F.), and funding from the NIH: R21AG059386 (to M.J.P.), R01GM108073 (to M.J.P.), and R21NS095614 (to M.J.P.).
Footnotes
Competing interests
The authors declare no competing financial interest.
Supporting Information
Supporting figures as referenced in the main text; experimental details, including synthetic schemes and protocols, excitation and emission spectra, infrared spectra, NMR spectra, protocols for biological characterizations and data analysis.
References
- (1).Sakmann B; Neher E Patch Clamp Techniques for Studying Ionic Channels in Excitable Membranes. Annual Review of Physiology 1984, 46 (1), 455–472. 10.1146/annurev.ph.46.030184.002323. [DOI] [PubMed] [Google Scholar]
- (2).Segev A; Garcia-Oscos F; Kourrich S Whole-Cell Patch-Clamp Recordings in Brain Slices. JoVE (Journal of Visualized Experiments) 2016, No. 112, e54024 10.3791/54024. [DOI] [PMC free article] [PubMed] [Google Scholar]
- (3).Tsien RY A Non-Disruptive Technique for Loading Calcium Buffers and Indicators into Cells. Nature 1981, 290 (5806), 527–528. 10.1038/290527a0. [DOI] [PubMed] [Google Scholar]
- (4).Grynkiewicz G; Poenie M; Tsien RY A New Generation of Ca2+ Indicators with Greatly Improved Fluorescence Properties. J. Biol. Chem 1985, 260 (6), 3440–3450. [PubMed] [Google Scholar]
- (5).Cohen LB; Salzberg BM Optical Measurement of Membrane Potential In Reviews of Physiology, Biochemistry and Pharmacology, Volume 83; Reviews of Physiology, Biochemistry and Pharmacology; Springer, Berlin, Heidelberg, 1978; pp 35–88. 10.1007/3-540-08907-1_2. [DOI] [PubMed] [Google Scholar]
- (6).Peterka DS; Takahashi H; Yuste R Imaging Voltage in Neurons. Neuron 2011, 69 (1), 9–21. 10.1016/j.neuron.2010.12.010. [DOI] [PMC free article] [PubMed] [Google Scholar]
- (7).Loew LM Design and Use of Organic Voltage Sensitive Dyes In Membrane Potential Imaging in the Nervous System and Heart; Advances in Experimental Medicine and Biology; Springer, Cham, 2015; pp 27–53. 10.1007/978-3-319-17641-3_2. [DOI] [PubMed] [Google Scholar]
- (8).Miller EW Small Molecule Fluorescent Voltage Indicators for Studying Membrane Potential. Current Opinion in Chemical Biology 2016, 33, 74–80. 10.1016/j.cbpa.2016.06.003. [DOI] [PMC free article] [PubMed] [Google Scholar]
- (9).Grinvald A; Hildesheim R VSDI: A New Era in Functional Imaging of Cortical Dynamics. Nat Rev Neurosci 2004, 5 (11), 874–885. 10.1038/nrn1536. [DOI] [PubMed] [Google Scholar]
- (10).Kuhn B; Denk W; Bruno RM In Vivo Two-Photon Voltage-Sensitive Dye Imaging Reveals Top-down Control of Cortical Layers 1 and 2 during Wakefulness. PNAS 2008, 105 (21), 7588–7593. 10.1073/pnas.0802462105. [DOI] [PMC free article] [PubMed] [Google Scholar]
- (11).Airan RD; Meltzer LA; Roy M; Gong Y; Chen H; Deisseroth K High-Speed Imaging Reveals Neurophysiological Links to Behavior in an Animal Model of Depression. Science 2007, 317 (5839), 819–823. 10.1126/science.1144400. [DOI] [PubMed] [Google Scholar]
- (12).Storace D; Rad MS; Han Z; Jin L; Cohen LB; Hughes T; Baker BJ; Sung U Genetically Encoded Protein Sensors of Membrane Potential In Membrane Potential Imaging in the Nervous System and Heart; Advances in Experimental Medicine and Biology; Springer, Cham, 2015; pp 493–509. 10.1007/978-3-319-17641-3_20. [DOI] [PubMed] [Google Scholar]
- (13).Sepehri Rad M; Choi Y; Cohen LB; Baker BJ; Zhong S; Storace DA; Braubach OR Voltage and Calcium Imaging of Brain Activity. Biophysical Journal 2017, 113 (10), 2160–2167. 10.1016/j.bpj.2017.09.040. [DOI] [PMC free article] [PubMed] [Google Scholar]
- (14).Xu Y; Zou P; Cohen AE Voltage Imaging with Genetically Encoded Indicators. Current Opinion in Chemical Biology 2017, 39, 1–10. 10.1016/j.cbpa.2017.04.005. [DOI] [PMC free article] [PubMed] [Google Scholar]
- (15).Platisa J; Pieribone VA Genetically Encoded Fluorescent Voltage Indicators: Are We There Yet? Current Opinion in Neurobiology 2018, 50, 146–153. 10.1016/j.conb.2018.02.006. [DOI] [PMC free article] [PubMed] [Google Scholar]
- (16).Kulkarni RU; Miller EW Voltage Imaging: Pitfalls and Potential. Biochemistry 2017, 56 (39), 5171–5177. 10.1021/acs.biochem.7b00490. [DOI] [PMC free article] [PubMed] [Google Scholar]
- (17).Lavis LD Chemistry Is Dead. Long Live Chemistry! Biochemistry 2017, 56 (39), 5165–5170. 10.1021/acs.biochem.7b00529. [DOI] [PubMed] [Google Scholar]
- (18).Treger JS; Priest MF; Iezzi R; Bezanilla F Real-Time Imaging of Electrical Signals with an Infrared FDA-Approved Dye. Biophysical Journal 2014, 107 (6), L09–L12. 10.1016/j.bpj.2014.07.054. [DOI] [PMC free article] [PubMed] [Google Scholar]
- (19).Carr JA; Franke D; Caram JR; Perkinson CF; Saif M; Askoxylakis V; Datta M; Fukumura D; Jain RK; Bawendi MG; Bruns OT Shortwave Infrared Fluorescence Imaging with the Clinically Approved Near-Infrared Dye Indocyanine Green. PNAS 2018, 115 (17), 4465–4470. 10.1073/pnas.1718917115. [DOI] [PMC free article] [PubMed] [Google Scholar]
- (20).Weber J; Beard PC; Bohndiek SE Contrast Agents for Molecular Photoacoustic Imaging. Nature Methods 2016, 13 (8), 639–650. 10.1038/nmeth.3929. [DOI] [PubMed] [Google Scholar]
- (21).Zhang HK; Yan P; Kang J; Abou DS; Le HND; Jha AK; Thorek DLJ; Kang JU; Rahmim A; Wong DF; Boctor EM; Loew LM Listening to Membrane Potential: Photoacoustic Voltage-Sensitive Dye Recording. JBO, JBOPFO 2017, 22 (4), 045006 10.1117/1.JBO.22.4.045006. [DOI] [PMC free article] [PubMed] [Google Scholar]
- (22).Rao B; Zhang R; Li L; Shao J-Y; Wang LV Photoacoustic Imaging of Voltage Responses beyond the Optical Diffusion Limit. Scientific Reports 2017, 7 (1), 2560 10.1038/s41598-017-02458-w. [DOI] [PMC free article] [PubMed] [Google Scholar]
- (23).Hinner MJ; Hübener G; Fromherz P Enzyme-Induced Staining of Biomembranes with Voltage-Sensitive Fluorescent Dyes. J. Phys. Chem. B 2004, 108 (7), 2445–2453. 10.1021/jp036811h. [DOI] [PubMed] [Google Scholar]
- (24).Hinner MJ; Hübener G; Fromherz P Genetic Targeting of Individual Cells with a Voltage-Sensitive Dye through Enzymatic Activation of Membrane Binding. ChemBioChem 2006, 7 (3), 495–505. 10.1002/cbic.200500395. [DOI] [PubMed] [Google Scholar]
- (25).Ng DN; Fromherz P Genetic Targeting of a Voltage-Sensitive Dye by Enzymatic Activation of Phosphonooxymethyl-Ammonium Derivative. ACS Chem. Biol 2011, 6 (5), 444–451. 10.1021/cb100312d. [DOI] [PubMed] [Google Scholar]
- (26).Liu P; Grenier V; Hong W; Muller VR; Miller EW Fluorogenic Targeting of Voltage-Sensitive Dyes to Neurons. J. Am. Chem. Soc 2017, 139 (48), 17334–17340. 10.1021/jacs.7b07047. [DOI] [PMC free article] [PubMed] [Google Scholar]
- (27).Sundukova M; Prifti E; Bucci A; Kirillova K; Serrao J; Reymond L; Umebayashi M; Hovius R; Riezman H; Johnsson K; Heppenstall PA A Chemogenetic Approach for the Optical Monitoring of Voltage in Neurons. Angewandte Chemie International Edition 2019, 58 (8), 2341–2344. 10.1002/anie.201812967. [DOI] [PMC free article] [PubMed] [Google Scholar]
- (28).Grenier V; Daws BR; Liu P; Miller EW Spying on Neuronal Membrane Potential with Genetically Targetable Voltage Indicators. J. Am. Chem. Soc 2019,141 (3), 1349–1358. 10.1021/jacs.8b11997. [DOI] [PMC free article] [PubMed] [Google Scholar]
- (29).Deal PE; Liu P; Al-Abdullatif SH; Muller VR; Shamardani K; Adesnik H; Miller EW Covalently Tethered Rhodamine Voltage Reporters for High Speed Functional Imaging in Brain Tissue. J. Am. Chem. Soc 2020, 142 (1), 614–622. 10.1021/jacs.9b12265. [DOI] [PMC free article] [PubMed] [Google Scholar]
- (30).Gubernator NG; Zhang H; Staal RGW; Mosharov EV; Pereira DB; Yue M; Balsanek V; Vadola PA; Mukheijee B; Edwards RH; Sulzer D; Sames D Fluorescent False Neurotransmitters Visualize Dopamine Release from Individual Presynaptic Terminals. Science 2009, 324 (5933), 1441–1444. 10.1126/science.1172278. [DOI] [PMC free article] [PubMed] [Google Scholar]
- (31).Lee M; Gubernator NG; Sulzer D; Sames D Development of PH-Responsive Fluorescent False Neurotransmitters. J. Am. Chem. Soc 2010, 132 (26), 8828–8830. 10.1021/ja101740k. [DOI] [PMC free article] [PubMed] [Google Scholar]
- (32).Rodriguez PC; Pereira DB; Borgkvist A; Wong MY; Barnard C; Sonders MS; Zhang H; Sames D; Sulzer D Fluorescent Dopamine Tracer Resolves Individual Dopaminergic Synapses and Their Activity in the Brain. PNAS 2013, 110(3), 870–875. 10.1073/pnas.1213569110. [DOI] [PMC free article] [PubMed] [Google Scholar]
- (33).Pereira DB; Schmitz Y; Mészáros J; Merchant P; Hu G; Li S; Henke A; Lizardi-Ortiz JE; Jr RJK; Morgenstem TJ; Sonders MS; Kanter E; Rodriguez PC; Mosharov EV; Sames D; Sulzer D Fluorescent False Neurotransmitter Reveals Functionally Silent Dopamine Vesicle Clusters in the Striatum. Nature Neuroscience 2016, 19 (4), 578–586. 10.1038/nn.4252. [DOI] [PMC free article] [PubMed] [Google Scholar]
- (34).Dunn M; Henke A; Clark S; Kovalyova Y; Kempadoo KA; Karpowicz RJ; Kandel ER; Sulzer D; Sames D Designing a Norepinephrine Optical Tracer for Imaging Individual Noradrenergic Synapses and Their Activity in Vivo. Nature Communications 2018, 9 (1), 2838 10.1038/s41467-018-05075-x. [DOI] [PMC free article] [PubMed] [Google Scholar]
- (35).Merchant P; Sulzer D; Sames D Synaptic Optical Imaging Platforms: Examining Pharmacological Modulation of Neurotransmitter Release at Discrete Synapses. Neuropharmacology 2015, 98, 90–94. 10.1016/j.neuropharm.2015.03.013. [DOI] [PMC free article] [PubMed] [Google Scholar]
- (36).Antic S; Zecevic D Optical Signals from Neurons with Internally Applied Voltage-Sensitive Dyes. J. Neurosci 1995, 15(2), 1392–1405. 10.1523/JNEUROSCI.15-02-01392.1995. [DOI] [PMC free article] [PubMed] [Google Scholar]
- (37).Tsau Y; Wenner P; O’Donovan MJ; Cohen LB; Loew LM; Wuskell JP Dye Screening and Signal-to-Noise Ratio for Retrogradely Transported Voltage-Sensitive Dyes. Journal of Neuroscience Methods 1996, 70 (2), 121–129. 10.1016/S0165-0270(96)00109-4. [DOI] [PubMed] [Google Scholar]
- (38).Kulkarni RU; Yin H; Pourmandi N; James F; Adil MM; Schaffer DV; Wang Y; Miller EW A Rationally Designed, General Strategy for Membrane Orientation of Photoinduced Electron Transfer-Based Voltage-Sensitive Dyes. ACS Chem. Biol 2017, 12 (2), 407–413. 10.1021/acschembio.6b00981. [DOI] [PMC free article] [PubMed] [Google Scholar]
- (39).Kulkarni RU; Kramer DJ; Pourmandi N; Karbasi K; Bateup HS; Miller EW Voltage-Sensitive Rhodol with Enhanced Two-Photon Brightness. PNAS 2017, 114 (11), 2813–2818. 10.1073/pnas.1610791114. [DOI] [PMC free article] [PubMed] [Google Scholar]
- (40).Meltzer PC; Liang AY; Brownell AL; Elmaleh DR; Madras BK Substituted 3-Phenyltropane Analogs of Cocaine: Synthesis, Inhibition of Binding at Cocaine Recognition Sites, and Positron Emission Tomography Imaging. J. Med. Chem 1993, 36 (7), 855–862. 10.1021/jm00059a010. [DOI] [PubMed] [Google Scholar]
- (41).Carroll FI; Mascarella SW; Kuzemko MA; Gao Y; Abraham P; Lewin AH; Boja JW; Kuhar MJ Synthesis, Ligand Binding, and QSAR (CoMFA and Classical) Study of 3.Beta.-(3’-Substituted Phenyl)-, 3.Beta.-(4’-Substituted Phenyl)-, and 3.Beta.-(3’,4’-Disubstituted Phenyl)Tropane-2.Beta.-Carboxylic Acid Methyl Esters. J. Med. Chem 1994, 37 (18), 2865–2873. 10.1021/jm00044a007. [DOI] [PubMed] [Google Scholar]
- (42).Lubisch W; Behl B; Hofmann HP Pyrrolylquinoxalinediones: A New Class of AMPA Receptor Antagonists. Bioorganic & Medicinal Chemistry Letters 1996, 6 (23), 2887–2892. 10.1016/S0960-894X(96)00534-3. [DOI] [Google Scholar]
- (43).Wakayama S; Kiyonaka S; Arai I; Kakegawa W; Matsuda S; Ibata K; Nemoto YL; Kusumi A; Yuzaki M; Hamachi I Chemical Labelling for Visualizing Native AMPA Receptors in Live Neurons. Nature Communications 2017, 8, 14850 10.1038/ncomms14850. [DOI] [PMC free article] [PubMed] [Google Scholar]
- (44).Wang KH; Penmatsa A; Gouaux E Neurotransmitter and Psychostimulant Recognition by the Dopamine Transporter. Nature 2015, 521 (7552), 322–327. 10.1038/nature14431. [DOI] [PMC free article] [PubMed] [Google Scholar]
- (45).Sobolevsky AI; Rosconi MP; Gouaux E X-Ray Structure, Symmetry and Mechanism of an AMPA-Subtype Glutamate Receptor. Nature 2009, 462 (7274), 745–756. 10.1038/nature08624. [DOI] [PMC free article] [PubMed] [Google Scholar]
- (46).Cha JH; Zou M-F; Adkins EM; Rasmussen SGF; Loland CJ; Schoenenberger B; Gether U; Newman AH Rhodamine-Labeled 2β-Carbomethoxy-3β-(3,4-Dichlorophenyl)Tropane Analogues as High-Affinity Fluorescent Probes for the Dopamine Transporter. J. Med. Chem 2005, 48 (24), 7513–7516. 10.1021/jm050431y. [DOI] [PubMed] [Google Scholar]
- (47).Karpowicz RJ; Dunn M; Sulzer D; Sames D APP+, a Fluorescent Analogue of the Neurotoxin MPP+, Is a Marker of Catecholamine Neurons in Brain Tissue, but Not a Fluorescent False Neurotransmitter. ACS Chem. Neurosci 2013, 4 (5), 858–869. 10.1021/cn400038u. [DOI] [PMC free article] [PubMed] [Google Scholar]
- (48).Eriksen J; Rasmussen SGF; Rasmussen TN; Vaegter CB; Cha JH; Zou M-F; Newman AH; Gether U Visualization of Dopamine Transporter Trafficking in Live Neurons by Use of Fluorescent Cocaine Analogs. J. Neurosci 2009, 29 (21), 6794–6808. 10.1523/JNEUROSCI.4177-08.2009. [DOI] [PMC free article] [PubMed] [Google Scholar]
- (49).Brogden RN; Heel RC; Speight TM; Avery GS Nomifensine: A Review of Its Pharmacological Properties and Therapeutic Efficacy in Depressive Illness. Drugs 1979, 18 (1), 1–24. 10.2165/00003495-197918010-00001. [DOI] [PubMed] [Google Scholar]
- (50).Dupayage L; Nouvel C; Six J-L Protected versus Unprotected Dextran Macroinitiators for ATRP Synthesis of Dex-g-PMMA. J. Polym. Sci. A Polym. Chem 2011, 49 (1), 35–46. 10.1002/pola.24409. [DOI] [Google Scholar]
- (51).Wu J; Zhao C; Lin W; Hu R; Wang Q; Chen H; Li L; Chen S; Zheng J Binding Characteristics between Polyethylene Glycol (PEG) and Proteins in Aqueous Solution. J. Mater. Chem. B 2014, 2 (20), 2983–2992. 10.1039/C4TB00253A. [DOI] [PubMed] [Google Scholar]
- (52).Prifti E; Reymond L; Umebayashi M; Hovius R; Riezman H; Johnsson K A Fluorogenic Probe for SNAP-Tagged Plasma Membrane Proteins Based on the Solvatochromic Molecule Nile Red. ACS Chem. Biol 2014, 9 (3), 606–612. 10.1021/cb400819c. [DOI] [PubMed] [Google Scholar]
- (53).Cheng HN; Neiss TG Solution NMR Spectroscopy of Food Polysaccharides. Polymer Reviews 2012, 52 (2), 81–114. 10.1080/15583724.2012.668154. [DOI] [Google Scholar]
- (54).Vercelli A; Repici M; Garbossa D; Grimaldi A Recent Techniques for Tracing Pathways in the Central Nervous System of Developing and Adult Mammals. Brain Research Bulletin 2000, 51 (1), 11–28. 10.1016/S0361-9230(99)00229-4. [DOI] [PubMed] [Google Scholar]
- (55).Syková E; Nicholson C Diffusion in Brain Extracellular Space. Physiological Reviews 2008, 88 (4), 1277–1340. 10.1152/physrev.00027.2007. [DOI] [PMC free article] [PubMed] [Google Scholar]
- (56).Xiao F; Nicholson C; Hrabe J; Hrabĕtová S Diffusion of Flexible Random-Coil Dextran Polymers Measured in Anisotropic Brain Extracellular Space by Integrative Optical Imaging. Biophysical Journal 2008, 95 (3), 1382–1392. 10.1529/biophysj.107.124743. [DOI] [PMC free article] [PubMed] [Google Scholar]
- (57).Fluhler E; Burnham VG; Loew LM Spectra, Membrane Binding, and Potentiometric Responses of New Charge Shift Probes. Biochemistry 1985, 24 (21), 5749–5755. 10.1021/bi00342a010. [DOI] [PubMed] [Google Scholar]
- (58).Mohanty J; Nau WM Ultrastable Rhodamine with Cucurbituril. Angewandte Chemie International Edition 2005, 44 (24), 3750–3754. 10.1002/anie.200500502. [DOI] [PubMed] [Google Scholar]
- (59).Yaseen MA; Yu J; Wong MS; Anvari B Stability Assessment of Indocyanine Green within Dextran-Coated Mesocapsules by Absorbance Spectroscopy. JBO 2007,12 (6), 064031 10.1117/1.2821423. [DOI] [PubMed] [Google Scholar]
- (60).Matsuda W; Furuta T; Nakamura KC; Hioki H; Fujiyama F; Arai R; Kaneko T Single Nigrostriatal Dopaminergic Neurons Form Widely Spread and Highly Dense Axonal Arborizations in the Neostriatum. J. Neurosci 2009, 29 (2), 444–453. 10.1523/JNEUROSCI.4029-08.2009. [DOI] [PMC free article] [PubMed] [Google Scholar]
- (61).Lein ES; Hawrylycz MJ; Ao N; Ayres M; Bensinger A; Bernard A; Boe AF; Boguski MS; Brockway KS; Byrnes EJ; Chen L; Chen L; Chen T-M; Chin MC; Chong J; Crook BE; Czaplinska A; Dang CN; Datta S; Dee NR; Desaki AL; Desta T; Diep E; Dolbeare TA; Donelan MJ; Dong H-W; Dougherty JG; Duncan BJ; Ebbert AJ; Eichele G; Estin LK; Faber C; Facer BA; Fields R; Fischer SR; Fliss TP; Frensley C; Gates SN; Glattfelder KJ; Halverson KR; Hart MR; Hohmann JG; Howell MP; Jeung DP; Johnson RA; Karr PT; Kawal R; Kidney JM; Knapik RH; Kuan CL; Lake JH; Laramee AR; Larsen KD; Lau C; Lemon TA; Liang AJ; Liu Y; Luong LT; Michaels J; Morgan JJ; Morgan RJ; Mortrud MT; Mosqueda NF; Ng LL; Ng R; Orta GJ; Overly CC; Pak TH; Parry SE; Pathak SD; Pearson OC; Puchalski RB; Riley ZL; Rockett HR; Rowland SA; Royall JJ; Ruiz MJ; Samo NR; Schaffnit K; Shapovalova NV; Sivisay T; Slaughterbeck CR; Smith SC; Smith KA; Smith BI; Sodt AJ; Stewart NN; Stumpf K-R; Sunkin SM; Sutram M; Tam A; Teemer CD; Thaller C; Thompson CL; Varnam LR; Visel A; Whitlock RM; Wohnoutka PE; Wolkey CK; Wong VY; Wood M; Yaylaoglu MB; Young RC; Youngstrom BL; Yuan XF; Zhang B; Zwingman TA; Jones AR Genome-Wide Atlas of Gene Expression in the Adult Mouse Brain. Nature 2007, 445 (7124), 168–176. 10.1038/nature05453. [DOI] [PubMed] [Google Scholar]
- (62).Interactive Atlas Viewer :: Atlas Viewer http://atlas.brain-map.org/atlas?atlas=2#atlas=2&plate=100884129&structure=549&x=7799.908447265625&y=4023.3484268188477&zoom=-3&resolution=16.11&z=5 (accessed Aug 7, 2018).
- (63).Sara SJ Locus Coeruleus in Time with the Making of Memories. Current Opinion in Neurobiology 2015, 35, 87–94. 10.1016/j.conb.2015.07.004. [DOI] [PubMed] [Google Scholar]
- (64).Tamura T; Hamachi I Chemistry for Covalent Modification of Endogenous/Native Proteins: From Test Tubes to Complex Biological Systems. J. Am. Chem. Soc 2019, 141 (7), 2782–2799. 10.1021/jacs.8b11747. [DOI] [PubMed] [Google Scholar]
- (65).Fujishima S; Yasui R; Miki T; Ojida A; Hamachi I Ligand-Directed Acyl Imidazole Chemistry for Labeling of Membrane-Bound Proteins on Live Cells. J. Am. Chem. Soc 2012, 134 (9), 3961–3964. 10.1021/ja2108855. [DOI] [PubMed] [Google Scholar]
- (66).Kiyonaka S; Sakamoto S; Wakayama S; Morikawa Y; Tsujikawa M; Hamachi I Ligand-Directed Chemistry of AMPA Receptors Confers Live-Cell Fluorescent Biosensors. ACS Chem. Biol 2018, 13 (7), 1880–1889. 10.1021/acschembio.7b01042. [DOI] [PubMed] [Google Scholar]
- (67).Huganir RL; Nicoll RA AMPARs and Synaptic Plasticity: The Last 25 Years. Neuron 2013, 80 (3), 704–717. 10.1016/j.neuron.2013.10.025. [DOI] [PMC free article] [PubMed] [Google Scholar]
- (68).Moretto E; Passafaro M Recent Findings on AMPA Receptor Recycling. Front. Cell. Neurosci 2018, 12 10.3389/fncel.2018.00286. [DOI] [PMC free article] [PubMed] [Google Scholar]
- (69).Fromherz P; Hübener G; Kuhn B; Hinner MJ ANNINE-6plus, a Voltage-Sensitive Dye with Good Solubility, Strong Membrane Binding and High Sensitivity. Eur Biophys J 2008, 37 (4), 509–514. 10.1007/s00249-007-0210-y. [DOI] [PMC free article] [PubMed] [Google Scholar]
- (70).Deal PE; Kulkarni RU; Al-Abdullatif SH; Miller EW Isomerically Pure Tetramethylrhodamine Voltage Reporters. J. Am. Chem. Soc 2016, 138 (29), 9085–9088. 10.1021/jacs.6b05672. [DOI] [PMC free article] [PubMed] [Google Scholar]
- (71).Huang Y-L; Walker AS; Miller EW A Photostable Silicon Rhodamine Platform for Optical Voltage Sensing. J. Am. Chem. Soc 2015, 137 (33), 10767–10776. 10.1021/jacs.5b06644. [DOI] [PMC free article] [PubMed] [Google Scholar]
- (72).Kulkarni RU; Vandenberghe M; Thunemann M; James F; Andreassen OA; Djurovic S; Devor A; Miller EW In Vivo Two-Photon Voltage Imaging with Sulfonated Rhodamine Dyes. ACS Cent. Set 2018, 4 (10), 1371–1378. 10.1021/acscentsci.8b00422. [DOI] [PMC free article] [PubMed] [Google Scholar]
- (73).Abdelfattah AS; Kawashima T; Singh A; Novak O; Liu H; Shuai Y; Huang Y-C; Campagnola L; Seeman SC; Yu J; Zheng J; Grimm JB; Patel R; Friedrich J; Mensh BD; Paninski L; Macklin JJ; Murphy GJ; Podgorski K; Lin B-J; Chen T-W; Turner GC; Liu Z; Koyama M; Svoboda K; Ahrens MB; Lavis LD; Schreiter ER Bright and Photostable Chemigenetic Indicators for Extended in Vivo Voltage Imaging. Science 2019, 365 (6454), 699–704. 10.1126/science.aav6416. [DOI] [PubMed] [Google Scholar]
- (74).Trancikova A; Ramonet D; Moore DJ Chapter 11 - Genetic Mouse Models of Neurodegenerative Diseases. In Progress in Molecular Biology and Translational Science; Chang KT, Min K-T, Eds.; Animal Models of Human Disease; Academic Press, 2011; Vol. 100, pp 419–482. 10.1016/B978-0-12-384878-9.00012-1. [DOI] [PubMed] [Google Scholar]
- (75).Sulzer D; Cragg SJ; Rice ME Striatal Dopamine Neurotransmission: Regulation of Release and Uptake. Basal Ganglia 2016, 6 (3), 123–148. 10.1016/j.baga.2016.02.001. [DOI] [PMC free article] [PubMed] [Google Scholar]
- (76).Deán-Ben XL; Sela G; Lauri A; Kneipp M; Ntziachristos V; Westmeyer GG; Shoham S; Razansky D Functional Optoacoustic Neuro-Tomography for Scalable Whole-Brain Monitoring of Calcium Indicators. Light Sci Appl 2016, 5 (12), e16201 10.1038/lsa.2016.201. [DOI] [PMC free article] [PubMed] [Google Scholar]
- (77).Gottschalk S; Degtyaruk O; Larney BM; Rebling J; Hutter MA; Deán-Ben XL; Shoham S; Razansky D Rapid Volumetric Optoacoustic Imaging of Neural Dynamics across the Mouse Brain. Nat Biomed Eng 2019, 3 (5), 392–401. 10.1038/s41551-019-0372-9. [DOI] [PMC free article] [PubMed] [Google Scholar]
- (78).Shields BC; Kahuno E; Kim C; Apostolides PF; Brown J; Lindo S; Mensh BD; Dudman JT; Lavis LD; Tadross MR Deconstructing Behavioral Neuropharmacology with Cellular Specificity. Science 2017, 356 (6333), eaaj2161 10.1126/science.aaj2161. [DOI] [PubMed] [Google Scholar]
- (79).Mollwitz B; Brunk E; Schmitt S; Pojer F; Bannwarth M; Schiltz M; Rothlisberger U; Johnsson K Directed Evolution of the Suicide Protein O6-Alkylguanine-DNA Alkyltransferase for Increased Reactivity Results in an Alkylated Protein with Exceptional Stability. Biochemistry 2012, 51 (5), 986–994. 10.1021/bi2016537. [DOI] [PubMed] [Google Scholar]
- (80).Los GV; Encell LP; McDougall MG; Hartzell DD; Karassina N; Zimprich C; Wood MG; Learish R; Ohana RF; Urh M; Simpson D; Mendez J; Zimmerman K; Otto P; Vidugiris G; Zhu J; Darzins A; Klaubert DH; Bulleit RF; Wood KV HaloTag: A Novel Protein Labeling Technology for Cell Imaging and Protein Analysis. ACS Chem. Biol 2008, 3 (6), 373–382. 10.1021/cb800025k. [DOI] [PubMed] [Google Scholar]
- (81).Chen Z; Jing C; Gallagher SS; Sheetz MP; Cornish VW Second-Generation Covalent TMP-Tag for Live Cell Imaging. J. Am. Chem. Soc 2012, 134 (33), 13692–13699. 10.1021/ja303374p. [DOI] [PMC free article] [PubMed] [Google Scholar]
Associated Data
This section collects any data citations, data availability statements, or supplementary materials included in this article.