

Abstract
Objectives:
Periodic limb movements in sleep (PLMS) are thought to be prevalent in elderly populations, but their impact on quality of life remains unclear. We examined the prevalence of PLMS, impact of age on prevalence, and association between PLMS and sleepiness.
Methods:
We identified limb movements in 2,335 Wisconsin Sleep Cohort polysomnograms collected over 12 years. Prevalence of periodic limb movement index (PLMI) ≥15 was calculated at baseline (n=l,084). McNemar's test assessed changes in prevalence over time. Association of sleepiness and PLMS evaluated using linear mixed modeling and generalized estimating equations. Models adjusted for confounders.
Results:
Prevalence of PLMI ≥15 at baseline was 25.3%. Longitudinal prevalence increased significantly with age (p=2.97x10⁻¹⁴). Sleepiness did not differ significantly between PLMI groups unless stratified by restless legs syndrome (RLS) symptoms. The RLS+/PLM+ group was sleepier than the RLS+/PLM− group. Multiple Sleep Latency Test trended towards increased alertness in the RLS−/PLM+ group compared to RLS−/PLM−.
Conclusions:
A significant number of adults have PLMS and prevalence increased with age. No noteworthy association between PLMI category and sleepiness unless stratified by RLS symptoms.
Significance:
Our results indicate that RLS and PLMS may have distinct clinical consequences and interactions that can help guide treatment approach.
Keywords: PLMS, prevalence, sleepiness, periodic, automatic scoring
1.0. Introduction
Periodic limb movements in sleep (PLMS)1 are repetitive bursts of muscle activity, typically in the lower limbs, which may be accompanied by an arousal or sleep fragmentation(Pollmacher et al. , 1993). Although PLMS are believed to increase with age(Ancoli-Israel et al. , 1985, Ferri et al. , 2008), until recently, the prevalence of PLMS in the general population had not been reliably estimated. Small studies have reported prevalence rates between 5 and 11%(Hornyak et al. , 2006, Scofield et al. , 2008), including a community-based sample of 592 participants recruited from the general population of tri-country Detroit which reported 7.6% (Hornyak et al. , 2006, Scofield et al. , 2008). A larger study documented a 3.9% prevalence in a cohort of 18,980 subjects from the general population between the ages of 15 and 100, but it used a telephone interview survey to identify PLMS which is less reliable than a polysomnography (PSG) data(Hornyak et al. , 2006). In 2016, a population based study on 2,162 subjects from the HypnoLaus Sleep Cohort Study found the prevalence of PLMS >15/hour to be 28.6% in adults (31.3% in men and 26% in women)(Haba-Rubio et al. , 2016), which is significantly higher than previously thought.
Periodic Limb Movement Disorder is defined as the presence of >15 PLMS per hour with a complaint of insomnia and/or excessive daytime sleepiness which cannot otherwise be explained(American Academy of Sleep Medicine, 2014). Periodic Limb Movement Disorder is still somewhat controversial as little is known about the cause of PLMS or their impact on wellbeing, daytime sleepiness, or insomnia symptoms (Hornyak et al. , 2006, Boehm et al. , 2009). For example, some studies have found PLMS present without a complaint of disturbed sleep or daytime sleepiness, especially in elderly populations(Hornyak et al. , 2004, Haba-Rubio et al. , 2016). Another study evaluated objective and subject sleepiness levels in 1,124 subjects with sleep disordered breathing and found that increased leg movements (Periodic Leg Movement Index [PLMI] >5) were actually associated with decreased objective sleepiness(Chervin, 2001). Other studies have shown individuals who have ≥15 PLMS per hour of sleep are more likely to report insomnia symptoms such as difficulty initiating or maintaining sleep than individuals without PLMS(Hornyak et al. , 2006, Scofield et al. , 2008).
PLMS are often associated with restless legs syndrome (RLS), but they are not the same. RLS is a movement disorder characterized by a strong urge to move the legs that is elevated in the evening and during periods of inactivity. It is thought that 80-90% of patients with RLS also present with PLMS (Ferri et al. , 2006).
The aims of the current study were to (1) estimate the prevalence of PLMS in an adult, community-based population, (2) longitudinally evaluate the impact of age on PLMS, and (3) examine the relationship between PLMS and subjective/objective sleepiness.
2.0. Methods
This work is a collaboration between Stanford University and the University of Wisconsin-Madison. Data used includes nocturnal PSGs, Multiple Sleep Latency Test (MSLT), and questionnaire data collected as part of the Wisconsin Sleep Cohort. The data was collected under a protocol approved by the University of Wisconsin-Madison Health Sciences Institutional Review Board and written informed consent was obtained from all subjects. A Determination of Human Subjects Research was submitted to the Stanford Univers ity Institutional Review Board, which ruled this project does not require a formal protocol.
2.1. Participant Population:
The Wisconsin Sleep Cohort is an ongoing, longitudinal, population-based study of the causes, consequences, and natural history of sleep disorders. It was established in 1988 from a sample of employees of four state agencies in south central Wisconsin, USA. Participants were aged 30-60 years (Young et al. , 1993, Young, 2009) and 96% of the population is non-Hispanic white(Peppard et al. , 2013). Participants were mailed questionnaires every five years asking about their sleep and medical history. A subsample was evaluated every four years using in-lab nocturnal polysomnography. Rationale and design of the Wisconsin Sleep Cohort study was published in 2009(Young, 2009).
This study used 1,084 participants who had in-lab, overnight sleep studies between 2000 and 2004 (n=1,084). The timeframe was chosen to align with the 2000 survey mailing, which contained questions on sleepiness and RLS symptoms(Winkelman et al. , 2006). The majority of these individuals had follow up sleep studies at four-year intervals, resulting in a total of 2,335 PSGs used in this analysis (up to 4 visits for any one person). Of the 1,084 participants, 344 (31.7%) had only 1 visit, 257 (23.7%) had a total of 2 visits, 455 (42.0%) had 3 visits, and 28 (2.6%) had data from all 4 visits.
2.2. Sleepiness:
Sleepiness was assessed both objectively, using the MSLT, and subjectively, using the Epworth Sleepiness Scale (ESS) and a 5 point scale rating frequency of excessive daytime sleepiness (EDS).
2.2.1. Multiple Sleep Latency Test (MSLT):
The MSLT consists of four to five 20-minute napping opportunities spaced at two-hour intervals throughout the day(Littner et al. , 2005). To account for variations in number of naps and ensure standardization, the main output was mean sleep latency of the first four nap trials. The mean sleep latency has a range of 0 to 20 minutes, with lower values indicating higher levels of sleepiness. A binary variable was created to differentiate individuals with a mean sleep latency <8 or ≥8 minutes. This cut-point is commonly used in the field and recommended in the American Academy of Sleep Medicine Practice Parameters(Littner et al. , 2005) with <8 minutes indicating clinically relevant sleepiness, defining, in part, both narcolepsy and idiopathic hypersomnia.
Of the 2335 overnight sleep studies, 1,627 had accompanying MSLTs, which were performed on 847 of the 1,084 individuals included in the analysis. Two MSLT protocols were used (503 experimental versus 1,124 clinical assessments), both in accordance with standard parameters and defining sleep by standard scoring criteria based on electroencephalogram, electrooculogram and electromyogram(Goldbart et al. , 2014). The primary difference is that the clinical MSLT protocol took place the night after in-laboratory PSG, while the experimental MSLT protocol took place on average 3 weeks after the PSG. Additionally, in the experimental MSLT, the participant was immediately woken up after sleep onset, whereas in the clinical MSLT, the subject was allowed to continue sleeping for up to 15 minutes to examine if a sleep onset rapid eye movement period occurred during the nap (Carskadon et al. , 1986, Littner et al. , 2005). In both protocols, participants went to bed at their usual bedtime on the night before testing. Participants also completed sleep logs prior to their MSLT, which were used to estimate total sleep time on the 2 nights preceding testing. Preceding sleep information was analyzed as a covariate, due to the possibility of sleep restriction before MSLT testing altering findings.
2.2.2. Epworth Sleepiness Scale (ESS):
The ESS is an extensively validated, self-administered, eight-question survey on the likelihood of dozing in various situations(Johns, 1992, 2000). The scores range from 0 to 24 points with higher scores indicating increased levels of sleepiness. We evaluated the ESS obtained from surveys collected the night of each PSG as both a continuous and binary variable, using >10 to indicate sleepiness, which is the standard cut point in the field (Johns, 2000).
2.2.3. Excessive Daytime Sleepiness (EDS):
The final sleepiness measure was from a questionnaire completed before each overnight PSG. The participants were asked “Do you have feelings of excessive daytime sleepiness?” Answer options included “Never,” “Rarely (once a month),” “Sometimes (2-4 times a month),” “Often (5-15 times a month),” and “4=Almost always (16-30 times a month).” Participants were categorized as having EDS if they answered ”Often” or “Almost always.”
2.3. Periodic Limb Movement Index (PLMI):
The 2007 American Academy of Sleep Medicine criteria define a leg movement as a burst of muscle activity lasting ≥0.5 seconds but <10 seconds where EMG activity (recorded from the left or right anterior tibialis) exceeded 8 μV above baseline and then fell below 2 μV from baseline(lber et al., 2007). PLMs are when four or more leg movements that are not related to a respiratory event occur consecutively with 5 to 90 seconds between each event.
This study identified PLMs using the validated Stanford PLM automatic detector, a rule-based PLM detection algorithm that uses manually scored staging and respiratory event files to determine PLMI(Moore et al. , 2014a). The detector was optimized to remove false signals, such as electrocardiogram contamination and fragmentary myoclonus-like patterns. It uses adaptive filtering and a unique, two-pass noise floor calculation to eliminate artifact and address intermittent or excessive baseline noise. It also uses a 0.05 second fall time to avoid mislabeling noise as true leg movements. Finally, it rejects leg movements within 5 second (rather than 0.5 second) of manually scored respiratory events. This alteration of respiratory exclusion rules was made after identifying that current 2007 American Academy of Sleep Medicine standards(Zucconi et al. , 2006) overly excluded leg movements during respiratory events and under-excluded leg movements before or after the event.
In another variation from standard definitions, the Stanford PLM automatic detector defines PLMI as the average number of leg movements that met the above criteria occurring per hour of sleep and intermittent wake (i.e. wake after sleep onset)(Moore et al. , 2014a). The decision to include events during wake after sleep onset was made during the development of the algorithm to optimize performance. The resulting algorithm was validated in the Wisconsin Sleep Cohort and a clinical sample against manually scored data(Moore et al. , 2014a).
This study used a PLMI cutoff of 15 to categorize participants as either PLM+ or PLM−. This cut point was chosen based on the literature and preliminary review of the data. Because the data was right-skewed, the PLMI was log transformed.
2.4. Other Baseline Characteristics and Measures:
2.4.1. Demographics:
Data on sex, age, height, and weight were examined as potential confounders. Body mass index was calculated as kilograms per meters squared. Participants reported on whether they had ever been told by a doctor that they had, or have, hypertension, coronary artery disease, or a heart attack.
2.4.2. RLS Symptoms:
Participants were identified as having “RLS symptoms” based on questionnaire responses from the Wisconsin Sleep Cohort 2000 survey. Patients were asked how often, when sitting or lying down, they had the following feelings in their legs: (a) repeated urge to move legs, (b) strange and uncomfortable feelings in the legs, and (c) the duration of several leg jumps or jerks. The choice of frequency included “never,” “less than once a month,” “monthly,” “weekly,” and “nightly.” If the participant answered more than “never” for these questions, they were asked: (d) Do these feelings get better when you start walking? (e) Do these feelings disrupt your sleep?
We are not able to ascertain whether participants meet RLS diagnostic criteria because the questionnaire did not ask whether symptoms were worse at night, which is part of the International Restless Legs Syndrome Study Group and National Institutes of Health RLS diagnostic criteria(Allen et al. , 2003). Instead, we identified individuals with RLS symptoms using a strategy employed by previous studies analyzing this data (Winkelman et al. , 2006, Moore et al. , 2014b, Li et al. , 2015) by separating subjects into groups based on survey responses. Group A, likely RLS symptoms, (184 subjects, 401 observations) included individuals who reported daily or weekly urges to move their legs that got better by walking and disrupted their sleep. Group B, possible RLS symptoms, (184 subjects, 428 observations) was comprised of subjects who had at least monthly urges to move legs relieved by walking that were not included in Group A. Group C, no RLS symptoms (513 subjects, 1,120 observations), included individuals whose symptoms occurred less than once a month or never. Remaining subjects (170 subjects, 353 observations) were dropped from the analysis because they had missing, contradictory, or inconclusive responses. Prior analyses of this cohort found correlations were similar between Groups A and B, so they were combined to create the RLS symptoms positive group(Moore et al. , 2014b, Li et al. , 2015) (RLS+). Group C was the RLS symptoms negative group (RLS−).
2.4.3. Nocturnal Polysomnography (PSG):
Nocturnal in-lab PSGs were collected using Grass-Telefactor Heritage digital sleep systems. The standard 16 channels of information were recorded, including: electroencephalogram, electrooculogram, and electromyogram from the submentalis muscle as well as the anterior tibialis muscles of each leg, electrocardiogram, snoring, breathing effort using respiratory inductance plethysmography, airflow from a nasal-oral thermistor and nasal pressure transducer, and oximetry. electroencephalogram, electrooculogram, and chin electromyogram were used to manually score sleep stages for each 30-second epoch using standard R&K criteria(Rechtschaffen and Kales, 1968).
2.4.4. Medications and Health Measures:
Medications were collected via questionnaire and categorized on whether they exacerbated or improved RLS symptoms. Drugs that exacerbate RLS symptoms included: antidepressants, antipsychotics, tricyclic antidepressants, selective serotonin reuptake inhibitors (e.g., fluoxetine hydrochloride, paroxetine), selective serotonin reuptake inhibitor antagonists (e.g., buspar), and antihistamines. Drugs that inhibited RLS symptoms were benzodiazepines, opioids, Parkinson’s drugs (e.g., levodopa/carbidopa, pramipexole) and anticonvulsants (e.g. gabapentin). Additional parameters of interest from the questionnaires included information on cardiovascular disease, coronary artery disease, hypertension, and alcohol use.
2.4.5. Mood Disorders:
Depression was assessed using the 20-item Zung Depression Scale(Zung, 1965). Scores on the Zung range from 20 to 100 (from not depressed to severe depression). Moderate to severe depression was classified as a Zung score greater than 50 or current use of antidepressant medication.
Trait anxiety was assessed by the State Trait Anxiety Inventory; a battery of 20 self-report questions(Spielberger, 1980). Individuals were coded as having an anxiety disorder if their trait anxiety score was in the top quartile or if they were taking antidepressants.
2.4.6. Other Sleep Measures:
Obstructive sleep apnea was evaluated based on apnea hypopnea index from PSG data in which the individual was not using positive airway pressure therapy. The apnea hypopnea index was also log-transformed because data were right-skewed. A binary variable was also used to include individuals using positive airway pressure therapy at home. Individuals were considered positive for obstructive sleep apnea if the apnea hypopnea index was >15 or they used positive airway pressure therapy during the overnight study. Total sleep time and sleep efficiency (total sleep time/total time in bed) were also evaluated.
Questionnaire responses were used to evaluate insomnia, shift work and self-reported average amount of sleep obtained per night (habitual sleep mean). Habitual sleep mean was evaluated as a continuous measure as well as a binary variable with participants categorized based on <6 or ≥6 hours of sleep per night.
2.5. Statistical Analysis:
The association between PLMI category (<15 or ≥15) and sleepiness in the Wisconsin Sleep Cohort was evaluated. The dataset has already been analyzed numerous times by the Wisconsin Sleep Cohort team, so outliers and missing values had already been investigated and resolved. The Wisconsin Sleep Cohort team provided advice and guidance on working with their data. All statistical analyses were performed using SAS 9.3 Enterprise Guide software 5.1.
Basic summary measures are reported as means ± standard error (SE) for continuous variables or counts and percentages for categorical variables. Standard deviation (SD) was used for age. Statistical significance was defined as p <0.05.
Descriptive statistics and frequency distributions were performed on age, gender, body mass index, cardiovascular disease, coronary artery disease, hypertension, alcohol use, medications, depression, anxiety, OSA, insomnia, shift work, habitual sleep (both as continuous and binary), RLS symptoms, PLMI, mean sleep latency (both as continuous and binary), ESS (both as continuous and binary), and EDS.
Crude bivariate analyses were performed to characterize PLM positive and negative groups as well as RLS symptoms positive and negative groups with respect to demographic characteristics, potential confounders and outcome measures. Variables that were right-skewed in their distribution were log-transformed. Odds ratios with 95% confidence intervals (95% CI) were reported for binary measures of sleepiness.
PLMS prevalence was calculated at the baseline visit by identifying the number of individuals with a PLMI ≥15 events/hour on their first PSG (n=1,084). Logistic regression models gauged the impact of age and gender on PLMI group in the baseline population using linear and quadratic functions. The longitudinal effect of increasing age on PLMS was evaluated by analyzing a subset of the baseline sample with at least 3 PSGs (n=455) plus 70 participants who were excluded from the main analysis due to missing questionnaire data (n=525). The significance of changing prevalence over time was assessed using McNemar’s test.
To assess sleepiness, all 2,335 PSGs were analyzed using linear mixed modeling and generalized estimating equations (GEE). The usage of GEEs allows for incorporation of repeated measures into modeling analyses by accounting for within-subject correlations of the measures at each time point, in order to avoid biasing analyses with individuals that have a higher number of observations. Compound symmetry correlation structure was used to account for variation/correlated errors within subjects over multiple time points. Other correlation structures (exchangeable and unstructured) were evaluated to confirm compound symmetry was the most appropriate. Robust variance estimates were used to account for within-person correlations. For categorical outcome measures, the logit link function, Type 3 analysis and a binary distribution were used.
Separate models were constructed to adjust for confounders using sleepiness status (e.g., EDS yes or no) as the dependent variable and PLMI category as the predictor. Criteria for entry into the PLM/Sleepiness models was a p-value <0.05 in the bivariate analysis of either PLMI category or one of the sleepiness measures. Criteria to remain in the model required either a p-value <0.05 in at least two of the five outcome models or clinical justification. For simplicity, the same variables were included in each sleepiness measure’s final outcome model.
A second set of models was created to evaluate sleepiness with RLS symptoms category (positive or negative) as the predictor. The process described above was used to build the RLS symptom/sleepiness models.
Finally, to examine whether RLS-symptoms category could be an effect modifier in the relationship between PLMI category and sleepiness, we examined sleepiness models with both main effects for PLMI category and RLS symptoms category and an interaction term of the two, adjusted for confounders. For models with significant interactions, the data were then stratified by RLS symptoms category to evaluate whether the clinical significance of PLMS differ in the RLS population.
3.0. Results
3.1. Participant Characteristics:
The sample for this study was composed of 1,084 adult individuals over the age of 40 from the Wisconsin Sleep Cohort who had at least one overnight sleep study. Data analyzed included no more than four visits per individual for a total of 2,335 observations with an average of 2.2 ± 0.03 (SE) visits per person. Age range across all observations was 37 to 81 with a mean age of 59.5 ± 8.4 (SD). Of the 2,335 total observations, 1,261 were from men and 1,074 were from women. Table 1 presents demographic and clinical characteristics of each observation dichotomized by PLMs status based on the first visit. As previously published, PLMI ≥15 were associated with male sex and older age(Moore et al. , 2014b). In addition, the data showed an association between PLMI ≥15 and cardiovascular disease, high blood pressure, coronary artery disease, and depression. In addition, mean total sleep time and sleep efficiency were lower for individuals with a PLMI ≥15.
TABLE 1.
Demographic and Clinical Characteristics of Periodic Leg Movement Index Category (PLMI <15 and PLMI ≥15)
| PLM Category† | |||
|---|---|---|---|
| PLMI <15 | PLMI ≥15 | ||
| Subjects/Observations (1084/2335) | 1572 observations (n=772) | 763 observations (n=312, 28.8%‡) | |
| Characteristic | n(%) or mean ± SE | n(%) or mean ± SE | p-value |
| Age (years) | 57.7 ± 0.3 | 60.7 ± 0.3 | p<0.0001 |
| Male | 795 (50.6%) | 466 (61.1%) | p=0.0003 |
| BMI (kg/m2) | 31.8 ± 0.2 | 31.7 ± 0.2 | p=0.40 |
| Cardiovascular disease | 118 (7.5%) | 95 (12.5%) | p=0.0058 |
| Coronary artery disease | 92 (5.9%) | 81 (10.6%) | p=0.0018 |
| Hypertension | 527 (33.5%) | 349 (45.7%) | p=0.0007 |
| Alcohol use (840/1784) | 4.6 ± 0.2 | 4.88 ± 0.24 | p=0.13 |
| Medication* | |||
| Exacerbates RLS Symptoms | 519 (33.1%) | 272 (36.0%) | p=0.0152 |
| Improves RLS Symptoms | 40 (2.6%) | 30 (4.0%) | p=0.33 |
| Depression (1075/2221) | 391 (25.9%) | 221 (31.1%) | p=0.0013 |
| Anxiety | 212 (13.5%) | 113 (14.8%) | p=0.77 |
| RLS Symptoms (881/1949)** | 499 (37.9%) | 330 (52.2%) | p<0.0001 |
| PLMI† | |||
| PLMI | 5.9 ± 0.2 | 33.8 ± 0.9 | p<0.0001 |
| Ln PLMI | 1.5 ± 0.0 | 3.3 ± 0.0 | p<0.0001 |
| Total Sleep Time | 370.4 ± 1.8 | 349.1 ± 2.7 | p<0.0001 |
| Sleep efficiency (%) | 81.1 ± 0.0 | 76.3 ± 0.0 | p<0.0001 |
| OSA | |||
| AHI adjusted (1037/2210)*** | 7.6 ± 0.3 | 7.5 ± 0.4 | p=0.91 |
| Ln AHI +1(1037/2210) | 1.6 ± 0.03 | 1.6 ± 0.04 | p=0.41 |
| AHI >15 | 278 (17.7%) | 158 (20.7%) | p=0.49 |
| Insomnia (at lab) | 754 (48.0%) | 410 (53.7%) | p=0.29 |
| Shift work | 83 (5.3%) | 37 (4.9%) | p=0.84 |
| Habitual sleep (mean) | 7.2 ± 0.0 | 7.3 ± 0.0 | p=0.45 |
| Habitual sleep (<6 hours) | 167 (10.6%) | 105 (13.8%) | p=0.31 |
Reported n (%) and mean ± standard error (SE) based on observations, not subjects. p-values based on F statistic or χ2 test for homogeneity.
PLMI Category based Stanford’s PLM detector,
n based on first visit,
See Methods Section for more information about medication categorization,
Presence of RLS symptoms, as described in the Methods Section,
positive airway pressure users not counted in AHI as continuous variable. PLMI, periodic leg movement index; BMI, body mass index; RLS, restless legs syndrome symptoms; Ln, natural logarithm, OSA, obstructive sleep apnea; AHI, apnea hypopnea index.
3.2. Prevalence of PLMI ≥15 per Individual
Of the 1,084 adult participants analyzed, 577 (53.2%) were men. At the time of their baseline overnight sleep study, the average age of all subjects was 56.1 ± 7.8 (SD) and 312 (28.8%, 95% CI 26.6%-31.1%) of the individuals had a PLMI ≥15. Prevalence was also evaluated longitudinally for individuals with at least 3 PSGs (n=525). At the first visit, the mean age was 56.7 ± 7.4 (SD) and 133 had a PLMI ≥15 for a prevalence of 25.3%. At the second visit, the mean age was 60.6 ± 7 2 (SD) and prevalence increased significantly to 30.1%, with 158 surpassing the PLMI cutoff of 15 (McNemar’S χ2(1) = 5.49, p=0.0192). By the third visit (~8 years after first visit), the mean age was 65.0 ± 7.1 (SD) and the prevalence was 43.4% (228 individuals), which is shown in Table 2. The prevalence at visit 3 was significantly higher when compared to visit 1 (McNemar’s χ2(1) =57.75, p=2. 97x10−14) which is an odds ratio (OR) of 2.26 (95% CI 1.74-2.94). This estimate is in the same direction but higher than that obtained using a cross-sectional model predicting percent PLMI ≥15 by block of 8 years adjusted by sex (OR=1.44, 95% CI 1.25-1.66).
Table 2:
Prevalence of Periodic Leg Movement Index Category (PLMI <15 and PLMI ≥15) at Baseline and Over Time
| Baseline Visit Entire Cohort | First Visit Longitudinal Cohort | Second Visit Longitudinal Cohort | Third Visit Longitudinal Cohort | |
|---|---|---|---|---|
| PLMI ≥15 | 312 (28.8%) | 133 (25.3%) | 158 (30.1%) | 228 (43.4%) |
| PLMI <15 | 772 (71.2%) | 392 (74.7%) | 367 (69.9%) | 297 (56.6%) |
| Total | 1084 | 525 | 525 | 525 |
| Mean Age ± SD | 56.1 ± 7.8 | 56.7 ± 7.4 | 60.6 ± 7.2 | 65.0 ± 7.1 |
Reported as n (%) and mean ± standard deviation (SD), PLMI Category based Stanford’s PLM detector.
3.3. Association of PLMI Category with Sleepiness:
As seen in Table 3, there were no significant differences in subjective or objective sleepiness scores between the <15 and ≥15 PLMI groups. All p-values were >0.05. Models were adjusted for age, gender, depression, habitual sleep time, insomnia, total sleep time, sleep efficiency, cardiovascular disease, and RLS symptoms to remove their influence on the outcome measures. Objective and subjective sleepiness still did not differ by PLMI group. Only EDS, defined by a positive response to the 3 sleepiness questions, showed a trend (p=0.076) towards significance with an OR of 1.26 for increased sleepiness in subjects with high PLM indices. Significance (but not effect size) was diminished when the effects of confounding variables were taken into account (Table 3).
Table 3.
Objective and Subjective Sleepiness Measures by Periodic Leg Movement Index Category (PLMI <15 and PLMI ≥15)
| PLMI<15* | PLMI≥ 15* | |||
|---|---|---|---|---|
| Subjects/Obs (1084/2335) | 1572 observations (n=772) | 763 observations (n=312) | ||
| UNADJUSTD MODEL* | ||||
| Characteristic | mean ± SE | mean ± SE | statistic | p-value |
| MSLT mean (847/1627) | 11.6 ± 0.2 | 11.8 ± 0.2 | F=0.34, df=132 | p=0.56 |
| Epworth mean (1082/2333) | 8.7 ± 0.1 | 8.7 ± 0.2 | F=0.00, df=230 | p=0.98 |
| Characteristic | n(%) | n(%) | ||
| MSLT <8 (847/1627) | 304 (27.1%) | 135 (26.7%) | χ2= 0.10 | p=0.75 |
| Epworth >10 (1082/2333) | 503 (32.0%) | 251 (32.9%) | χ2= 0.22 | p=0.64 |
| EDS | 246 (15.7%) | 142 (18.6%) | χ2= 3.26 | p=0.07 |
| ADJUSTED MODEL† | ||||
| Characteristic | mean ± SE | mean ± SE | statistic | p-value |
| MSLT mean (847/1627) | 11.6 ± 0.2 | 11.3 ± 0.3 | F=1.44, df=132 | p=0.23 |
| Epworth mean (1082/2333) | 9.0 ± 0.2 | 9.2 ± 0.2 | F=2.53, df=210 | p=0.11 |
| UNADJUSTD MODEL* | ADJUSTED MODEL† | |||
| Characteristic | Odds Ratio (95% CI)* | Odds Ratio (95% CI)† | ||
| MSLT <8 (847/1627) | 0.96 (0.75-1.24) | 1.22 (0.93-1.61) | ||
| Epworth >10 (1082/2333) | 0.96 (0.80-1.15) | 1.04 (0.86-1.26) | ||
| EDS | 1.24 (0.99-1.57) | 1.26 (0.98-1.63) | ||
Reported n(%) and mean ± SE based on observations, not subjects. p-values based on F statistic or χ2 test for homogeneity.
PLMI Category based Stanford’s PLM detector.
Unadjusted Model,
Adjusted for age, gender, depression, habitual sleep time, insomnia, total sleep time, sleep efficiency, cardiovascular disease, and presence of restless legs syndrome (RLS) symptoms. PLMI, periodic limb movement index based Stanford’s PLM detector; MSLT, multiple sleep latency test; EDS, excessive daytime sleepiness as described in Methods Section.
3.4. Association of RLS Symptoms with Sleepiness:
As shown in Figure 1, 368 (41.8%) of the participants reported experiencing regular RLS symptoms out of the individuals analyzed (n=881). Participants with RLS symptoms were sleepier based on the ESS as a continues variable (p=0.007) and showed a trend towards being more objectively sleepy based on the MSLT (p=0.05), in comparison to individuals without RLS symptoms (Table 4). ESS >10 and EDS were significant in the unadjusted models but most lost significance and effect size after adjusting for confounders. Recent studies have shown associations of depression with subjective sleepiness, with an opposite effect on objective sleepiness(Plante et al. , 2016b, a). As discussed in the methods and limitations sections, RLS symptoms in this cohort is poorly defined.
Figure 1. Subjects and Observations Stratified by RLS Symptoms.
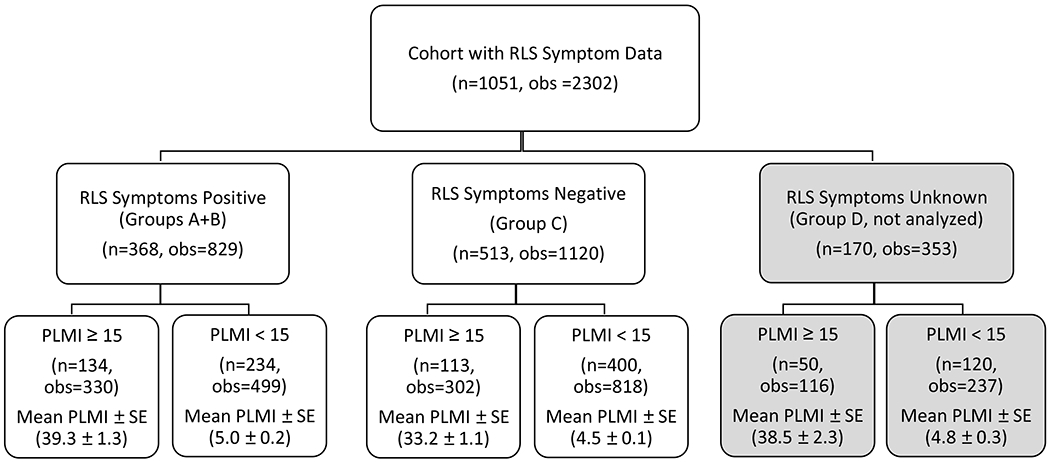
Participants were identified as having “RLS symptoms” based on a multi-level question related to RLS symptoms, however whether symptoms were worse at night was not included. Participants were split into 4 categories based on their responses. Group A contained subjects who reported at least weekly urges to move their legs that got better by walking plus disrupted sleep. Group B was comprised of subjects who had at least monthly urges to move legs relieved by walking around and were not included in Group A. Group C contained participants whose symptoms occurred less than once a month or never. Group D included individuals who had contradictory or inconclusive responses.
The RLS symptoms positive group contained individuals from Groups A and B, the RLS symptoms negative group contained subjects from Group C, and Group D was dropped from the analysis. Each group was then split by PLMI Category – those with PLMI ≥15 and those with PLMI <15. Mean PLMI ± standard error (SE) was calculated for each subgroup.
Table 4.
Objective and Subjective Sleepiness in Subjects With Vs. Without Restless Legs Syndrome (RLS) Symptoms
| RLS Symptoms Positive* | RLS Symptoms Negative* | |||
|---|---|---|---|---|
| Subjects/Observations (881/1949) | 829 Observations (n=368) | 1120 Observations (n=513) | ||
| UNADJUSTED MODEL* | ||||
| Characteristic | mean ± SE | mean ± SE | statistic | p-value |
| MSLT mean (703/1365) | 11.4 ± 0.2 | 11.8 ± 0.2 | F=1.66, df=769 | p=0.198 |
| Epworth mean (879/1947) | 9.3 ± 0.2 | 8.4 ± 0.2 | F=12.10, df=878 | p=0.0005 |
| Characteristic | n (%) | n (%) | ||
| MSLT <8 (703/1365) | 172 (28.7%) | 202 (26.4%) | χ2= 0.63 | p=0.43 |
| Epworth >10 (879/1947) | 300 (36.2%) | 333 (29.8%) | χ2= 5.97 | p=0.0145 |
| EDS | 154 (18.6%) | 145 (13.0%) | χ2= 8.48 | p=0.0036 |
| ADJUSTED MODEL† | ||||
| Characteristic | mean ± SE | mean ± SE | statistic | p-value |
| MSLT mean (703/1365) | 11.6 ± 0.2 | 12.1 ± 0.2 | F=3.81, df=768 | p=0.05 |
| Epworth mean (879/1947) | 9.3 ± 0.2 | 8.7 ± 0.2 | F=7.22, df=877 | p=0.007 |
| UNADJUSTED MODEL* | ADJUSTED MODEL† | |||
| Characteristic | Odds Ratio (95% CI) | Odds Ratio (95% CI) | ||
| MSLT <8 (703/1365) | 1.11 (0.85-1.45) | 1.18 (0.89-1.56) | ||
| Epworth >10 (879/1947) | 1.37 (1.07-1.76) | 1.22 (0.94-1.59) | ||
| EDS | 1.60 (1.17-2.18) | 1.25 (0.91-1.73) | ||
Reported n (%) and mean ± standard error (SE) based on observations, not subjects, p-values based on F statistic or χ2 test for homogeneity.
PLMI Category based Stanford’s PLM detector.
Unadjusted Model,
Adjusted for age, gender, depression, insomnia, habitual sleep time, insomnia, total sleep time, sleep efficiency, cardiovascular disease, and PLMI category. RLS, restless legs syndrome (RLS) symptoms (as described in Methods Section); MSLT, multiple sleep latency test; EDS, excessive daytime sleepiness (as described in Methods Section); PLMI, periodic limb movement index based Stanford’s PLM detector.
3.5. Interaction of PLMI Category and RLS Symptoms on Sleepiness:
When an interaction term for PLMI status and RLS symptoms was added to all PLMI/Sleepiness models and adjusted for age, gender, depression, habitual sleep time, insomnia, and cardiovascular disease, the interactions were significant (p values ranging from 0.004 to 0.04), except for the model using ESS >10 vs. ≤10 as a binary outcome (p=0.69).
In view of the high stastitical significance of these interactions, PLM / sleepiness analyses were rerun after stratifying subjects by RLS symptoms status (positive vs. negative) and adjusted for age, gender, depression, habitual sleep time, insomnia, and cardiovascular disease. See Figure 1 for the breakdown of subjects and observations in each group.
In the RLS symptoms positive group, we found a significant association between both objective and subjective sleepiness and PLMI category (Table 5, top). In contrast, in subjects without RLS symptoms, PLMI category was not associated with sleepiness. In fact, RLS−/PLM+ subjects had a trend toward more wakefulness, both subjectively and objectively, compared to RLS−/PLM-subjects (Table 5, bottom).
Table 5.
Sleepiness in Subjects With Vs. Without PLMS Stratified by RLS Symptom Status
| RLS Symptoms Positive | PLMI <15† | PLMI ≥15† | |
|---|---|---|---|
| Subjects/ Observations (368/829) | 499 observations (n=234) | 330 observations (n=134) | |
| Characteristic | mean ± SE | mean ± SE | p-value |
| MSLT mean (305/600) | 11.4 ± 0.4 | 10.3 ± 0.4 | p=0.0077 |
| Epworth mean (367/828) | 9.1 ± 0.4 | 9.8 ± 0.4 | p=0.0030 |
| Characteristic | Odds Ratio (95% CI)† | ||
| MSLT <8 (305/600) | 1.87 (1.22-2.86) | ||
| Epworth >10 (367/828) | 1.17 (0.88 - 1.54) | ||
| EDS | 2.17 (1.47 - 3.12) | ||
| RLS Symptoms Negative | PLMI <15† | PLMI ≥15† | |
| Subjects/ Observations (513/1120) | 818 observations (n=400) | 302 observations (n=113) | |
| Characteristic | mean ± SE | mean ± SE | p-value |
| MSLT mean (398/765) | 11.7 ± 0.4 | 12.2± 0.4 | p=0.1604 |
| Epworth mean (512/1119) | 8.8 ± 0.3 | 8.9 ± 0.4 | p=0.925 |
| Characteristic | Odds Ratio (95% CI)† | ||
| MSLT <8 (398/765) | 0.70 (0.50 - 1.10) | ||
| Epworth >10 (512/1119) | 1.03 (0.77 - 1.39) | ||
| EDS | 0.89 (0.59 - 1.34) | ||
Reported mean ± standard error (SE) based on observations, not subjects. p-values based on F statistic.
Adjusted for age, gender, depression, habitual sleep time, insomnia, total sleep time, sleep efficiency, cardiovascular disease. PLMI, periodic limb movement index based Stanford’s PLM detector; RLS, restless legs syndrome symptoms (as described in Methods Section); MSLT, multiple sleep latency test; EDS, excessive daytime sleepiness (as described in Methods Section).
4.0. Discussion
Although there have been several cross-sectional studies examining the prevalence of PLMs in different cohorts(Claman et al. , 2013, Haba-Rubio et al. , 2016), this is the first study to use longitudinal data to show increased prevalence with age among individuals retested at multiple time points. When measured at baseline when mean age was 56.1, 28.8% of the participants had a PLMI ≥15. This is similar to a prevalence of 28.6% found in the HypnoLaus Sleep Cohort(Haba-Rubio et al. , 2016), which had a similar mean age of 58.4. A subset of the cohort that had at least 3 PSGs recorded at 4 year intervals were analyzed longitudinally, and there was a statistically significant increase in prevalence over time (p=2. 97x10−14). The mean age at the third time point was 65.0 and prevalence had increased to 43.4%, confirming that the presence of PLMs increases substantially with age(Ferri et al. , 2008). The elevated increase in odds ratio in the longitudinal sample compared to the baseline (2.26 vs 1.44) is consistent with the trend towards a quadratic effect of age on PLMI observed in the baseline sample. Increased prevalence over each 4-year interval fits well when comparing the prevalence data from this study and the HypnoLaus Sleep Cohort(Haba-Rubio et al. , 2016) to the findings from the Osteoporotic Fractures in Men (MrOS) Study(Blank et al. , 2005, Orwoll et al. , 2005), a large community-based cohort of elderly men, where the mean age was 76.5 and 61% of the men had a PLMI ≥15(Winkelman et al. , 2015).
As in the HypnoLaus study, we also found that when compared with individuals with a PLMI <15, those with a PLMI ≥15 were more likely to be male, older, had increased cardiovascular and/or coronary artery disease and hypertension(Haba-Rubio et al. , 2016). The MrOS study also found an association between PLMS and cardiac arrhythmia in a subset of their population(Koo et al. , 2011), specifically men with structural heart disease and not on calcium channel or beta blockers(Koo et al. , 2011, Koo et al. , 2014). The MrOs study also found that PLMS preceded development of all-cause cardiovascular disease suggesting a causal role in vascular disease(Koo et al. , 2011). These associations may reflect the well-known association of increased heart rate following a PLM, indicating autonomic arousal. Unlike in the HypnoLaus Cohort, we did not see a difference in body mass index. The HypnoLaus cohort also found increased PLMs with decreased glomerular filtration rate, measurements we did not assay in this study(Haba-Rubio et al. , 2016).
Our study is the first to examine association between daytime sleepiness and PLMs in a large general population cohort using PSG and MSLT data. Because PLMs are often associated with EEG arousal (not unlike sleep apnea), it is logical to think increased PLMS would lead to increased sleepiness, as a result of sleep fragmentation. Interestingly, however, previous studies have not shown consistent effects on subjective sleepiness (Hornyak et al. , 2006, Scofield et al. , 2008). Moreover, an inverse relationship between PLMS and MSLT-based objective sleepiness was noted in a population of patients with more severe sleep-disordered breathing(Chervin, 2001). In our study, we found essentially no difference in subjective or objective sleepiness scores between the <15 and ≥15 PLMI groups.
41% of the cohort reported RLS symptoms which is considerably higher than found in other cohorts. This confirms that the presence of RLS symptoms was likely over-estimated because the RLS data was collected before the new diagnostic criteria were available.
We found a significant interaction between PLMI and RLS symptoms in all of our regression models except the ESS binary variable model. Consequently, we stratified by RLS symptoms and examined sleepiness measures within each group. The RLS symptoms negative / PLMI positive group showed a trend towards being more alert even when adjusted for other factors such as habitual sleep time. Additionally, the RLS symptoms positive / PLMI positive group was significantly sleepier than the RLS symptoms positive / PLMI negative group. While this finding may seem intuitive from a sleep-impairment standpoint, RLS participants rarely complain of daytime sleepiness(Allen et al. , 2010). So the association with sleepiness in the RLS symptoms positive group, but not the RLS symptoms negative group is somewhat counterintuitive. However, the finding agrees with the suggestion that individuals with both RLS and PLMs differ from RLS sufferers without PLMS, as reported in a recent analysis of MrOS data(Koo et al. , 2016). Although interesting, the poor characterization of the RLS phenotype prevented us from making any solid conclusions about these findings.
Misclassification of RLS due to the measurement error discussed in both the Methods and Study Limitations sections may also explain why RLS was found to be more common in women, while PLMs was slightly more frequent in men. Despite the RLS phenotype issue, it is possible that genetic pleiotropy may be involved given the complex interactions between PLMS, RLS, depression, and insomnia. For example, MEIS1, a gene with strong effects on RLS and more moderate effects on PLMS, was recently shown to also be associated with insomnia in the UK Biobank Cohort(Lane et al. , 2017). Combined genetic analysis with larger sample sizes and better characterization of PLMS and RLS will be needed to fully understand the nature of these complex interactions. Further analyses are needed to explore the relationship between PLMI and cardiovascular disease, specifically to evaluate whether there is an association between elevated PLMI and increased mortality.
4.1. Strengths and Limitations:
One of the major strengths of our study is the use of a population-based cohort with large sample size and repeated assessments over a long follow-up period. It is rare to have full PSGs recorded in a consistent manner with associated demographic and clinic data. Another strength is the use of an automated system to detect leg movements in a standardized fashion, which removes any inconsistencies related to human scoring. However, the Stanford PLM Automatic Detector did not follow current scoring standards for identifying PLMS. Instead, leg movements occurring during wake after sleep onset were included if the leg movement met all other PLM criteria. Additionally, respiratory exclusion rules were more conservative, increasing the window of exclusion from 0.5 s to 5.0 s. As described in the validation paper, these decisions were made to optimize performance in relation to the gold standard using two distinct cohorts(Moore et al. , 2014a).
A major limitation of the study was the inability to accurately assess RLS based on all four major diagnostic criteria outlined by the International Restless Legs Syndrome Study Group. The Wisconsin Sleep Cohort questionnaire did not include a question about whether symptoms are worse at night. As a result, we cannot say definitively whether an individual had RLS, we can only report whether or not they exhibit RLS symptoms. Therefore, any findings related to RLS symptoms only indicate that more analysis is needed. Despite the issues, we felt it was worthwhile to include available RLS information in the analysis because ignoring RLS symptoms altogether is also problematic. Based on the elevated percentage of RLS symptoms in this sample - 41.8% - it is likely some individuals were misclassified as having RLS symptoms when they did not, which would attenuate results associated with this variable. Also, 15% of the questionnaires had responses that were contradictory or inconclusive. This “unknown” group was removed from the dataset when assessing RLS as a predictor of sleepiness and for the stratified analysis. Importantly however, in this cohort, subjects reporting RLS symptoms had a 70% increased risk of having PLMI ≥15 (odds ratio = 1.7, 95% confidence interval 1.1 - 2.5)(Moore et al. , 2014b), which corroborates findings from the HypnoLaus study (odds ratio=1.96)(Haba-Rubio et al. , 2016).
Another issue is that we evaluated leg movements independent of the EEG, so we are not able to categorize leg movements based on whether there was an associated arousal due to lack of arousal scoring data in the Wisconsin Sleep Cohort. It is possible that inclusion of PLMs that did not result in an EEG arousal attenuated our results. We are working to complement the PLM detector with an algorithm to automatically identify arousals.
Finally, the sample lacked racial/ethnic diversity (96% non-Hispanic white)(Peppard et al. , 2013) and some of the variables evaluated had more than 10% missing data. The most concerning was the MSLT since it was an outcome measure. Because the MSLT studies were only run on a nested sample within the cohort, MSLT data was only available for about 70% of the observations. Subjective sleepiness measures and RLS symptoms data were available on ≥98.5% of subjects. Most variables assessed as potential covariates had <1.5% missing data with exception of alcohol use which was closer to 24%, but such under-reporting is reflective of real-world clinical practice.
5.0. Conclusion
In summary, our analyses suggest PLMs are highly prevalent in the general population, and the likelihood of having a PLMI ≥15 strongly increases with age, although this was tested primarily within a middle-aged/elderly age range (56.7-65.0). The lack of association between PLMI category and objective or subjective sleepiness brings into question the clinical relevance of PLMs in isolation of reported symptoms. Finally, a significant interaction between PLMI and RLS symptoms on sleepiness that individuals with both RLS and PLMs differ from RLS sufferers without PLMS and may warrant a different treatment approach.
Highlights.
Periodic limb movement index (PLMI) ≥15 highly prevalent in adult population.
The likelihood of having a PLMI ≥15 increased significantly with age.
PLMI ≥15 not associated with sleepiness unless stratified by restless legs syndrome.
Acknowledgements
The Wisconsin Sleep Cohort Study was supported by the National Heart, Lung, and Blood Institute (R01HL62252) and the National Center for Research Resources (1UL1RR025011) at the National Institutes of Health. Creation of the PLM Detector was supported by the Veteran Affair’s continuing education scholarship (GI Bill). Funding sources had no involvement in the study design, data analysis/interpretation or writing of this paper.
Funding Sources
This research did not receive any specific grant from funding agencies in the public, commercial, or not-for-profit sectors.
Financial Disclosure/Conflict of Interest
Eileen B. Leary, Hyatt E. Moore IV, Logan D. Schneider, Laurel A. Finn, Paul E. Peppard, and Emmanuel Mignot have no declarations of financial support or conflict of interest.
Footnotes
Publisher's Disclaimer: This is a PDF file of an unedited manuscript that has been accepted for publication. As a service to our customers we are providing this early version of the manuscript. The manuscript will undergo copyediting, typesetting, and review of the resulting proof before it is published in its final form. Please note that during the production process errors may be discovered which could affect the content, and all legal disclaimers that apply to the journal pertain.
EDS Excessive Daytime Sleepiness
ESS Epworth Sleepiness Scale
MSLT Multiple Sleep Latency Test
MrOS Osteoporotic Fractures in Men
PLMI Period Leg Movement Index
PLMS Period Leg Movements during Sleep
PSG Polysomnography
RLS Restless Legs Syndrome
References
- Allen RP, Picchietti D, Hening WA, Trenkwalder C, Walters AS, Montplaisi J. Restless legs syndrome: diagnostic criteria, special considerations, and epidemiology. A report from the restless legs syndrome diagnosis and epidemiology workshop at the National Institutes of Health. Sleep Med. 2003;4:101–19. [DOI] [PubMed] [Google Scholar]
- Allen RP, Stillman P, Myers AJ. Physician-diagnosed restless legs syndrome in a large sample of primary medical care patients in western Europe: Prevalence and characteristics. Sleep Med. 2010;11:31–7. [DOI] [PubMed] [Google Scholar]
- American Academy of Sleep Medicine. The International Classification of Sleep Disorders, Third Edition (ICSD-3) Darren, IL; 2014. [Google Scholar]
- Ancoli-Israel S, Kripke DF, Mason W, Kaplan OJ. Sleep apnea and periodic movements in an aging sample. J Gerontol. 1985;40:419–25. [DOI] [PubMed] [Google Scholar]
- Blank JB, Cawthon PM, Carrion-Petersen ML, Harper L, Johnson JP, Mitson E, et al. Overview of recruitment for the osteoporotic fractures in men study (MrOS). Contemp Clin Trials. 2005;26:557–68. [DOI] [PubMed] [Google Scholar]
- Boehm G, Wetter TC, Trenkwalder C. Periodic leg movements in RLS patients as compared to controls: Are there differences beyond the PLM index? Sleep Med. 2009;10:566–71. [DOI] [PubMed] [Google Scholar]
- Carskadon MA, Dement WC, Mitler MM, Roth T, Westbrook PR, Keenan S. Guidelines for the multiple sleep latency test (MSLT): a standard measure of sleepiness. Sleep. 1986;9:519–24. [DOI] [PubMed] [Google Scholar]
- Chervin RD. Periodic leg movements and sleepiness in patients evaluated for sleep-disordered breathing. Am J Respir Crit Care Med. 2001;164:1454–8. [DOI] [PubMed] [Google Scholar]
- Claman DM, Ewing SK, Redline S, Ancoli-Israel S, Cauley JA, Stone KL. Periodic leg movements are associated with reduced sleep quality in older men: the MrOS Sleep Study. J Clin Sleep Med. 2013;9:1109–17. [DOI] [PMC free article] [PubMed] [Google Scholar]
- Ferri R, Manconi M, Lanuzza B, Cosentino FI, Bruni O, Ferini-Strambi L, et al. Age-related changes in periodic leg movements during sleep in patients with restless legs syndrome. Sleep Med. 2008;9:790–8. [DOI] [PubMed] [Google Scholar]
- Ferri R, Zucconi M, Manconi M, Plazzi G, Bruni O, Ferini-Strambi L. New approaches to the study of periodic leg movements during sleep in restless legs syndrome. Sleep. 2006;29:759–69. [PubMed] [Google Scholar]
- Goldbart A, Peppard P, Finn L, Ruoff CM, Barnet J, Young T, et al. Narcolepsy and predictors of positive MSLTs in the Wisconsin Sleep Cohort. Sleep. 2014;37:1043–51. [DOI] [PMC free article] [PubMed] [Google Scholar]
- Haba-Rubio J, Marti-Soler H, Marques-Vidal P, Tobback N, Andries D, Preisig M, et al. Prevalence and determinants of periodic limb movements in the general population. Ann Neurol. 2016;79:464–74. [DOI] [PubMed] [Google Scholar]
- Hornyak M, Feige B, Riemann D, Voderholzer U. Periodic leg movements in sleep and periodic limb movement disorder: prevalence, clinical significance and treatment. Sleep Med Rev. 2006;10:169–77. [DOI] [PubMed] [Google Scholar]
- Hornyak M, Riemann D, Voderholzer U. Do periodic leg movements influence patients' perception of sleep quality? Sleep Med. 2004;5:597–600. [DOI] [PubMed] [Google Scholar]
- Iber C, Ancoli-Israel S, Chesson A, Quan SF. The AASM Manual for the Scoring of Sleep and Associated Events: Rules, Terminology and Technical Specifications. Westchester, Ill: American Academy of Sleep Medicine; 2007. [Google Scholar]
- Johns MW. Reliability and factor analysis of the Epworth Sleepiness Scale. Sleep. 1992;15:376–81. [DOI] [PubMed] [Google Scholar]
- Johns MW. Sensitivity and specificity of the multiple sleep latency test (MSLT), the maintenance of wakefulness test and the epworth sleepiness scale: failure of the MSLT as a gold standard. J Sleep Res. 2000;9:5–11. [DOI] [PubMed] [Google Scholar]
- Koo BB, Blackwell T, Ancoli-Israel S, Stone KL, Stefanick ML, Redline S. Association of incident cardiovascular disease with periodic limb movements during sleep in older men: outcomes of sleep disorders in older men (MrOS) study. Circulation. 2011;124:1223–31. [DOI] [PMC free article] [PubMed] [Google Scholar]
- Koo BB, Blackwell T, Lee HB, Stone KL, Louis ED, Redline S. Restless Legs Syndrome and Depression: Effect Mediation by Disturbed Sleep and Periodic Limb Movements. Am J Geriatr Psychiatry. 2016;24:1105–16. [DOI] [PMC free article] [PubMed] [Google Scholar]
- Koo BB, Mehra R, Blackwell T, Ancoli-Israel S, Stone KL, Redline S. Periodic limb movements during sleep and cardiac arrhythmia in older men (MrOS sleep). J Clin Sleep Med. 2014;10:7–11. [DOI] [PMC free article] [PubMed] [Google Scholar]
- Lane JM, Liang J, Vlasac I, Anderson SG, Bechtold DA, Bowden J, et al. Genome-wide association analyses of sleep disturbance traits identify new loci and highlight shared genetics with neuropsychiatric and metabolic traits. Nat Genet. 2017;49:274–81. [DOI] [PMC free article] [PubMed] [Google Scholar]
- Li J, Moore H 4th, Lin L, Young T, Finn L, Peppard PE, et al. Association of low ferritin with PLM in the Wisconsin Sleep Cohort. Sleep Med. 2015;16:1413–8. [DOI] [PMC free article] [PubMed] [Google Scholar]
- Littner MR, Kushida C, Wise M, Davila DG, Morgenthaler T, Lee-Chiong T, et al. Practice parameters for clinical use of the multiple sleep latency test and the maintenance of wakefulness test. Sleep. 2005;28:113–21. [DOI] [PubMed] [Google Scholar]
- Moore H 4th, Leary E, Lee SY, Carrillo O, Stubbs R, Peppard P, et al. Design and validation of a periodic leg movement detector. PLoS One. 2014a;9:e114565. [DOI] [PMC free article] [PubMed] [Google Scholar]
- Moore H 4th, Winkelmann J, Lin L, Finn L, Peppard P, Mignot E. Periodic leg movements during sleep are associated with polymorphisms in BTBD9, TOX3/BC034767, MEIS1, MAP2K5/SKOR1, and PTPRD. Sleep. 2014b;37:1535–42. [DOI] [PMC free article] [PubMed] [Google Scholar]
- Orwoll E, Blank JB, Barrett-Connor E, Cauley J, Cummings S, Ensrud K, et al. Design and baseline characteristics of the osteoporotic fractures in men (MrOS) study--a large observational study of the determinants of fracture in older men. Contemp Clin Trials. 2005;26:569–85. [DOI] [PubMed] [Google Scholar]
- Peppard PE, Young T, Barnet JH, Palta M, Hagen EW, Hla KM. Increased prevalence of sleep-disordered breathing in adults. Am J Epidemiol. 2013;177:1006–14. [DOI] [PMC free article] [PubMed] [Google Scholar]
- Plante DT, Finn LA, Hagen EW, Mignot E, Peppard PE. Longitudinal associations of hypersomnolence and depression in the Wisconsin Sleep Cohort Study. J Affect Disord. 2016a;207:197–202. [DOI] [PMC free article] [PubMed] [Google Scholar]
- Plante DT, Finn LA, Hagen EW, Mignot E, Peppard PE. Subjective and Objective Measures of Hypersomnolence Demonstrate Divergent Associations with Depression among Participants in the Wisconsin Sleep Cohort Study. J Clin Sleep Med. 2016b; 12:571–8. [DOI] [PMC free article] [PubMed] [Google Scholar]
- Pollmacher T, Schulz H. Periodic leg movements (PLM): their relationship to sleep stages. Sleep. 1993;16:572–7. [PubMed] [Google Scholar]
- Rechtschaffen A, Kales A. A manual of standardized terminology, techniques and scoring system of sleep stages in human subjects Los Angeles: Brain Information Service/Brain Research Institute, University of California; 1968. [Google Scholar]
- Scofield H, Roth T, Drake C. Periodic limb movements during sleep: population prevalence, clinical correlates, and racial differences. Sleep. 2008;31:1221–7. [PMC free article] [PubMed] [Google Scholar]
- Spielberger CV PR.; Barker LR; Donham GW; Westberry LG. The factor structure of the State-Trait Anxiety Inventory Washington DC: Hemisphere; 1980. [Google Scholar]
- Winkelman JW, Blackwell T, Stone K, Ancoli-Israel S, Tranah GJ, Redline S. Genetic associations of periodic limb movements of sleep in the elderly for the MrOS sleep study. Sleep Med. 2015;16:1360–5. [DOI] [PMC free article] [PubMed] [Google Scholar]
- Winkelman JW, Finn L, Young T. Prevalence and correlates of restless legs syndrome symptoms in the Wisconsin Sleep Cohort. Sleep Med. 2006;7:545–52. [DOI] [PubMed] [Google Scholar]
- Young T Rationale, design and findings from the Wisconsin Sleep Cohort Study: Toward understanding the total societal burden of sleep disordered breathing. Sleep Med Clin. 2009;4:37–46. [DOI] [PMC free article] [PubMed] [Google Scholar]
- Young T, Palta M, Dempsey J, Skatrud J, Weber S, Badr S. The occurrence of sleep-disordered breathing among middle-aged adults. NEJM. 1993;328:1230–5. [DOI] [PubMed] [Google Scholar]
- Zucconi M, Ferri R, Allen R, Baier PC, Bruni O, Chokroverty S, et al. The official World Association of Sleep Medicine (WASM) standards for recording and scoring periodic leg movements in sleep (PLMS) and wakefulness (PLMW) developed in collaboration with a task force from the International Restless Legs Syndrome Study Group (IRLSSG). Sleep Med. 2006;7:175–83. [DOI] [PubMed] [Google Scholar]
- Zung W A self-rating depression scale. Arch Gen Psychiatry. 1965;12:63–70. [DOI] [PubMed] [Google Scholar]