

Abstract
Background.
In 2016, California updated its prescription drug monitoring program (PDMP), adding two key features: automated proactive reports to prescribers and mandatory registration for prescribers and pharmacists. The effects of these changes on prescribing patterns have not yet been examined. We aimed to evaluate the joint effect of these two PDMP features on county-level prescribing practices in California.
Methods.
Using county-level quarterly data from 2012 to 2017, we estimated the absolute change associated with the implementation of these two PDMP features in seven prescribing indicators in California versus a control group comprising counties in Florida and Washington: opioid prescription rate per 1,000 residents; patients’ mean daily opioid dosage in milligrams of morphine equivalents[MME]; prescribers’ mean daily MME prescribed; prescribers’ mean number of opioid prescriptions per day; percentage of patients getting >90 MME/day; percentage of days with overlapping prescriptions for opioids and benzodiazepines; multiple opioid provider episodes per 100,000 residents.
Results.
Proactive reports and mandatory registration were associated with a 7.7 MME decrease in patients’ mean daily opioid dose (95%CI: −11.4, −2.9); a 1.8 decrease in the percentage of patients prescribed high-dose opioids (95%CI: −2.3, −0.9); and a 6.3 MME decrease in prescribers’ mean daily dose prescribed (95%CI: −10.0, −1.3).
Conclusions.
California’s implementation of these two PDMP features was associated with decreases in the total quantity of opioid MMEs prescribed, and indicators of patients prescribed high-dose opioids compared to states that had PDMP’s without these features. Rates of opioid prescribing and other high-risk prescribing patterns remained unchanged.
Keywords: prescription drug monitoring program, prescribing practices, opioid analgesics, California, program evaluation
1. Introduction
The Substance Abuse and Mental Health Services Administration estimated that 3.7 percent of the US population misused opioids in 2018 (Center for Behavioral Health Statistics and Quality, 2019), and opioid poisoning is one of the leading causes of injury-related death in the U.S. (Centers for Disease Control and Prevention, 2018; Gomes et al., 2018). Drug-related overdose deaths nearly quadrupled between 1999 and 2018. In 2018, opioids were involved in two-thirds of all drug-related deaths (46,802 out of 67,367), and approximately a third of opioid-related overdoses involved prescription opioids (Hedegaard et al., 2018; Wilson et al., 2020). Prescription Drug Monitoring Programs (PDMPs) are state-level controlled substance databases that registered prescribers and pharmacists can query at the point of care to inform prescribing decisions. PDMP systems are designed, in part, to prevent potentially high-risk prescribing and ultimately reduce harm related to the misuse of controlled substances, including opioids. However, there has been mixed evidence regarding the impact of PDMPs on population health (Fink et al., 2018; Puac-Polanco et al., 2020). One potential explanation is that PDMPs in different states have different features and requirements (Smith et al., 2019). Even among states with similar systems, PDMPs may be implemented and enforced differently (Henry et al., 2017). Two PDMP features widely-adopted by states are mandatory PDMP registration for prescribers and pharmacists, and generation of automated threshold reports (“proactive reports”) to prescribers as a way to alert them of patients with high-risk prescribing patterns (Grecu et al., 2018; McDonald et al., 2018; Pardo, 2017; Shev et al., 2018; Young et al., 2017). While some studies have examined the impact of mandatory PDMP registration on opioid prescribing (Deyo et al., 2018; Sun et al., 2018; Wen et al., 2017), to our knowledge, only a few studies have evaluated the association between proactive reports and opioid prescribing (Haffajee et al., 2018; McDonald et al., 2018).
As part of California’s approach to addressing the opioid epidemic, the state implemented an enhanced version of its PDMP (the Controlled Substance Utilization, Review, and Evaluation System 2.0 – CURES 2.0) that included several updates to improve PDMP functionality, along with outreach to educate prescribers and pharmacists about these updates. PDMP updates included the generation of proactive reports to prescribers, mandatory registration for prescribers and pharmacists, in addition to other improvements, such as a new an automated registration process, and an updated web interface design. All features were implemented in January 2016 except for mandatory registration, which was implemented in July 2016.
Proactive reports in California’s enhanced PDMP are generated when the system detects that a patient has surpassed any of the following prescribing thresholds: if they receive >90 MME/day, prescriptions from ≥6 providers or ≥6 pharmacies in the past 6 months, >40 MME/day of methadone, opioids for >90 consecutive days, and active prescriptions for both opioids and benzodiazepines. Prescribers see a list of their patients who meet these report thresholds when they log into the PDMP. Proactive reports are provided as additional information for prescribers; there are no direct consequences for having patients who met any of the report thresholds. Mandatory registration applied to all licensed pharmacists and all prescribers registered to prescribe controlled substances and practicing in California. This feature has been associated with a significant increase in PDMP registration and use by prescribers and pharmacists in California (Shev et al., 2018). Still, the effects of these changes on prescribing patterns have not yet been examined.
In this study, we evaluated the effects of implementing mandatory PDMP registration and proactive reports to prescribers on controlled substance prescribing practices in California by comparing county-level prescribing data from California to prescribing data from other states that had yet to enact these two PDMP policies. Study results can help elucidate the impact of these PDMP policy changes in California and may also be useful to other states considering changes to their PDMPs.
2. Material and methods
2.1. Design and data
We designed a quasi-experimental, county-level study comparing seven prescribing indicators in California to counties selected from control states. We generated a county-level panel dataset using quarterly PDMP data from 2012 to 2017 provided by the Prescription Behavioral Surveillance System (PBSS). This previously federally-funded public health surveillance system collected PDMP data from participating states to characterize and quantify the use and misuse of prescribed controlled substances (Paulozzi et al., 2015). PDMPs operate at the state level and record outpatient controlled substance prescriptions dispensed, regardless of the access and enrollment of prescribers, pharmacies, or other entities. We obtained state approval for PBSS to provide PDMP data from Idaho, Kentucky, Louisiana, Ohio, Texas, Virginia, Washington, and West Virginia, in addition to California. Data from Florida were obtained directly from the state’s PDMP administrator. This analysis was determined to be a program evaluation (rather than human subjects research) by both the University of California Davis Institutional Review Board and the California Committee for the Protection of Human Subjects.
There is often a delay between when state laws and regulations are adopted and when they are implemented (Pauly et al., 2018). Hence, we emailed state PDMP directors directly to confirm when and whether states had implemented mandatory PDMP registration, proactive reports, or both. Our analysis used the date PDMP features were implemented or took effect because the implementation date is likely more proximal to actual changes in prescribing.
Based on available data, we identified two states without mandatory registration and proactive report policies (Florida and Washington) during the study period. Counties in those two states served as potential control units in the quasi-experimental analyses.
2.2. Outcomes
Based on previous studies (Bohnert et al., 2018; Kreiner et al., 2017; Winstanley et al., 2018), and our public health and clinical expertise, we selected the following county-level quarterly prescribing indicators (from a list of indicators available from the PBSS) to use as dependent variables for our analysis (Paulozzi et al., 2015):
Number of opioid prescriptions per 1,000 residents.
Patients’ mean daily opioid dosage in morphine milligram equivalents (MMEs), among all patients receiving opioid prescriptions (denominatior is the total number of days with ≥1 active opioid prescriptions).
Percentage of patients getting >90MME per day among all patients receiving opioid prescriptions (calculated using patients’ mean daily MMEs per quarter).
Percentage of days with overlapping prescriptions for opioids and benzodiazepines (number of days with overlapping opioid and benzodiazepine prescriptions, divided by the sum of days with either an active opioid or active benzodiazepine prescription).
Multiple opioid provider episodes (patients receiving opioids from 5 or more prescribers and 5 or more pharmacies in a given quarter) per 100,000 residents.
Prescribers’ mean number of opioid prescriptions per day.
Prescribers’ mean daily MME prescribed.
We excluded Glades County in Florida due to missing data for several dependent variables.
Our analyses included the following Schedule II-IV opioids: Buprenorphine, Butorphanol, Codeine, Dihydrocodeine, Fentanyl, Hydrocodone, Hydromorphone, Meperidine, Methadone, Morphine, Oxycodone, Oxymorphone, Pentazocine, Tapentadol, Tramadol, and a few other rarely-used opioids (e.g., opium). Analyses were limited to patients’ county of residence for the first five variables; the last two were limited to prescribers’ county of registration.
These variables include metrics related to both overall opioid supply (outcomes 1, 2, 6, and 7) and to specific high-risk prescribing practices identified in the 2016 CDC opioid prescribing guidelines that have been associated with increased risk of opioid-related overdose (outcomes 3–5) (Bohnert et al., 2018; Kreiner et al., 2017; Winstanley et al., 2018).
2.3. Exposure
The exposure variable was the joint implementation of proactive reports (January 2016) and mandatory PDMP registration for prescribers and pharmacists (July 2016) in California. We set the post-intervention period to start in the third quarter of 2016 when both features were in place.
2.4. Covariates
To account for the potential difference in demographic and socioeconomic variables across treated and control counties, we retrieved county-level data from the American Community Survey (ACS) from 2010 to 2017 (5-year estimates), and annual small area income and poverty estimates from the US Census (Huang and Bell, 2012). Covariate inclusion was initially based on their theoretical association with outcome variables, though the final selection considered each covariates’ contribution to the models (e.g., heterogeneous trends). Variables were generated with the census application programming interface using the censusapi R package (Recht, 2019). The final covariates included were: percentage of the total population identifying as white; median household income during the past 12 months (in US$); percentage of total occupied housing units that are rented; percentage of US citizens; estimated percentage of people of all ages in poverty; Gini index of income inequality; median gross rent (in US$); per capita income in the past 12 months (in US$); and percentage of people not graduated from high school among adults ≥25 years of age. Though some covariates were highly correlated (r = 0.86 between per capita income in the past 12 months and median gross rent), all added variability in the pre-intervention period.
2.5. Statistical analysis
We first described the medians and the interquartile ranges of the outcome variables and covariates to inspect distributions and their similarity between treated and control counties (Abadie et al., 2014). Then, to generate a valid counterfactual for California, we used the generalized synthetic control method. This model estimates a post-intervention trend for each of the seven outcomes across counties in California based on interactive fixed-effects, which are products of latent factors with county-specific intercepts (Xu, 2017). These latent factors are the common trajectories of each outcome across counties and are generated by modeling these outcomes as a function of the county-specific covariates mentioned above (Gobillon and Magnac, 2016; McNamee and Zhang, 2019). This process originates a control group with an experience that resembles what might have happened in California in the absence of these policies. We implemented this method by using the R-package gsynth (Xu and Liu, 2019), which outputs the average treatment effect on the treated, that is, the average difference between California and the control group across all time-units (quarters) in the post-intervention period (R Core Team, 2019).
The generalized synthetic control method uses cross-validation to automatically select the optimal number of factors of the interactive fixed-effects model that produces the lower mean square prediction errors, reducing the risk of overfitting (Xu, 2017). A non-parametric bootstrap procedure generated confidence intervals and corresponding significance (Xu, 2017). See Supplemental Material, section 1, for additional information.
2.5.1. Sensitivity Analyses
Gsynth is a fairly new method for estimating the causal effect for policy interventions in multiple treated units, and consensus on best practice has not yet emerged. For this reason, we repeated the analysis using a traditional fixed-effects difference-in-difference regression model (Angrist and Krueger, 1999; Wing et al., 2018). We computed cluster robust standard errors to account for heteroscedasticity, autocorrelation, and general forms of spatial dependence (Driscoll and Kraay, 1998) using the xtscc command (Hoechle, 2007) in Stata 16 (StataCorp, 2019). Finally, in order to explore if results for patients’ mean daily opioid dosage in MMEs (second outcome) was affected by individual opioids (particularly buprenorphine which has a large conversion factor and is mostly used to treat opioid use disorder), we ran separate analyses for this outcome examining changes in MME for buprenorphine, hydrocodone, and oxycodone separately.
3. Results
Table 1 presents the median and interquartile range of each of the seven prescribing outcomes and the set of demographic and socioeconomic covariates considered in the modeling process for counties in California and the two control states (Florida and Washington) before the implementation of the PDMP features. Compared to counties in control states, California counties had lower baseline rates of opioid prescribing per 1,000 residents (208 versus 264) but higher mean daily MME prescribed per prescriber (68 versus 63). Rates of other prescribing outcomes were similar for counties in both groups.
Table 1.
Median and interquartile rangesa of characteristics considered at the county level before the implementation of mandatory PDMP registration and proactive reports (from quarter 1, 2012 to quarter 3, 2016).
| Variable | California counties (n=58) | Control countiesb (n=106) |
|---|---|---|
| Outcomes | ||
| Opioid prescriptions per 1,000 residents | 208.3 (167.2, 286.8) | 264.0 (198.5, 426.8) |
| Patients’ mean daily opioid dosage in MMEb | 86.5 (74.8, 97.3) | 89.8 (76.5, 104.3) |
| Percentage of patients getting >90MME | 13.2 (10.8, 15.5) | 14.2 (11.8, 17.5) |
| Percentage of days with overlapping prescriptions for opioid and benzodiazepines | 14.8 (12.7, 17.0) | 14.4 (12.7, 17.4) |
| Multiple provider episodes per 100,000 residents | 6.8 (3.7, 9.6) | 6.1 (2.7, 10.1) |
| Prescribers’ mean number of opioid prescriptions per day | 0.9 (0.7, 1.1) | 1.0 (0.8, 1.3) |
| Prescribers’ mean daily MME prescribed | 68.1 (58.3, 76.8) | 63.2 (50.5, 79.8) |
| Covariates | ||
| Percentage of total population identifying as White | 21.5 (15.4, 33.2) | 17.1 (11.5, 24.1) |
| Median household income (US$) | 53,366 (44,620, 64,240) | 45,335 (39,555, 51,354) |
| Percentage of rented occupied housing units | 39.8 (34.7, 43.3) | 28.4 (23.9, 33.7) |
| Percentage of US citizens | 88.6 (86.1, 95.7) | 96.5 (93.1, 97.8) |
| Percentage of Poverty (all ages) | 16.5 (12.8, 20.4) | 16.6 (14.0, 21.4) |
| GINI index | 0.5 (0.4, 0.5) | 0.4 (0.4, 0.5) |
| Median gross rent (US$) | 1,021 (873, 1,265) | 803 (690, 954) |
| Per capita income (US$) | 26,053 (21,689, 31,266) | 23,844 (19,852, 27,578) |
| Percentage of people not graduated from high school | 14.5 (11.3, 21.8) | 12.6 (9.6, 19.9) |
MME = Morphine milligram equivalents.
Interquartile ranges in parentheses.
Control states = Florida and Washington.
Figure 1 shows the prescribing trends for the seven outcomes in California and its control group estimates through the generalized synthetic control method. In general, there was a good fit in the pre-exposure trends between the two groups, with a decreasing trend in all outcomes. Table 2 shows the average difference in the post-intervention period between California and its control group for each of the seven outcomes selected. We observed an association between the implementation of proactive reports and mandatory registration for 3 of the 7 outcomes: patients’ mean daily opioid dosage in MME (average difference = −7.7; 95%CI: −11.4, −2.9), the percentage of patients getting >90MME (average difference = −1.8; 95%CI: −2.3, −0.9) and prescribers’ mean daily opioid MME dosage (average difference = −6.3; 95%CI: −10.0, −1.3). The observed results can be interpreted, respectively, as a decrease of 7.7 MME in the patients’ mean daily opioid dosage (on average, about one 5mg OxyContin pill), a 13.7% relative decrease in the percentage of patients getting >90 MME, and a 9% relative decrease in the prescribers’ mean daily MME dosage prescribed. A visual representation of model results is presented in Supplemental Material, Figure S1.
Figure 1.
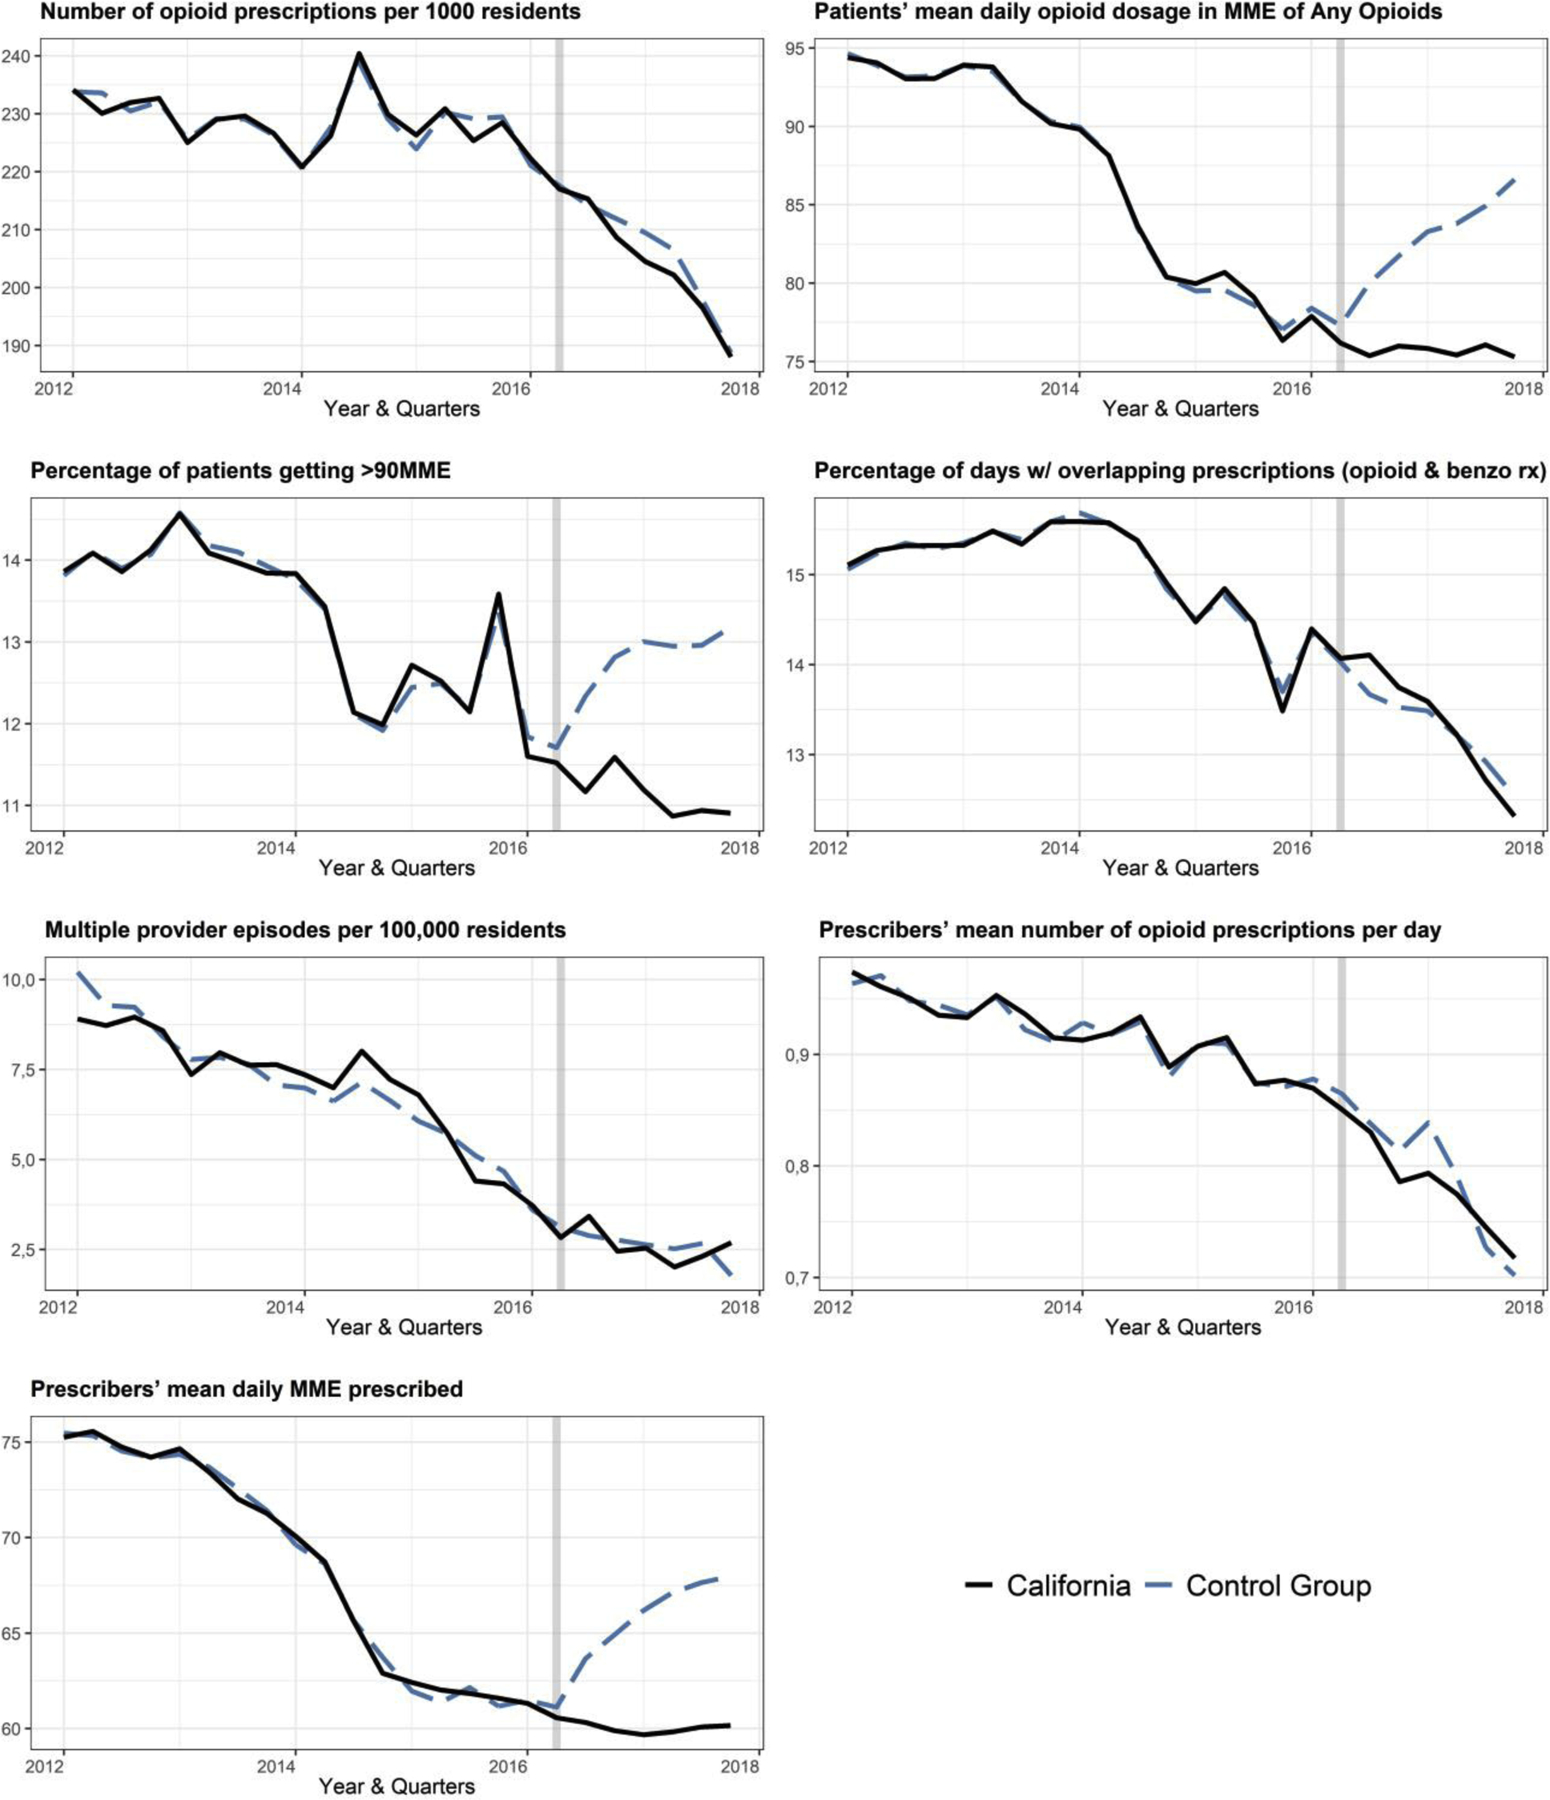
Estimated pre and post implementation prescribing trends in California and its control group
Table 2.
Estimated average difference between California and its control group, after the implementation of mandatory PDMP registration and proactive reportsa
| Prescribing practices | ADb | (95% CI) | MSPE |
|---|---|---|---|
| Opioid prescriptions per 1,000 residents | −2.2 | (−7.8, 3.3) | 75.6 |
| Patients’ mean daily opioid dosage in MME | −7.7 | (−11.4, −2.9) | 20.0 |
| Percentage of patients getting >90MME | −1.8 | (−2.3, −0.9) | 1.5 |
| Percentage of days with overlapping prescriptions for opioid and benzodiazepines | 0.1 | (−0.4, 0.6) | 0.5 |
| Multiple provider episodes per 100,000 residents | 0.0 | (−12, 1.4) | 10.6 |
| Prescribers’ mean number of opioid prescriptions per day | −0.0 | (−0.1, 0.0) | 0.0 |
| Prescribers’ mean daily MME prescribed | −6.3 | (−10.0, −1.3) | 15.3 |
AD = Average difference; MME = Morphine milligram equivalents. MSPE = Mean square prediction error.
From quarter 3, 2016 to quarter 4, 2017.
Models also included the following time-varying covariates: percentage of the total population identifying as white; median household income (US$); percentage of rented occupied housing units; percentage of US citizens; percentage of poverty (all ages); Gini index; median gross rent (US$); per capita income (US$); and percentage of people not graduated from high school.
3.1. Results from sensitivity analysis
The aggregated trends were similar across counties in California, and control states in only four out of seven outcomes in pre-intervention periods. These findings highlight the advantages of using the generalized synthetic control method, which does not rely on the assumption that pre-intervention trends are similar for the treatment and control groups (see Supplemental Material, section 1). Overall, results from the difference-in-difference models varied little from the results estimated using the generalized synthetic control method. Compared to our primary analysis, the difference-in-difference approach produced estimates that were all in the same direction and slightly larger than the estimates using the generalized synthetic control method. However, in our sensitivity analysis, we did observe a significant decrease in the number of opioid prescriptions per 1,000 residents associated with California’s policy changes. Detailed results of sensitivity analysis are in Supplemental Material, section 3.
Sensitivity results separating MME from buprenorphine, hydrocodone, and oxycodone in patients’ mean daily opioid dosage showed that California’s PDMP was associated with a significant reduction in MME from oxycodone and hydrocodone in a range of 1% to 11%. MMEs from buprenorphine fell by 9% but did not reach statistical significance (Table S2). This suggests that the reduction in MME from any opioids (8% reduction in main analysis) was not unduly affected by buprenorphine.
4. Discussion
Our results showed that the implementation of proactive reports to prescribers and mandatory PDMP registration in California was associated with a decrease in patients’ mean daily opioid dosage in MME, the percentage of patients receiving prescriptions of >90MME, and prescribers’ mean daily dosage prescribed. In contrast, we did not find changes in the number of opioid prescriptions per 1,000 residents, percentage of days with overlapping prescriptions for opioids and benzodiazepines, multiple provider episodes per 100,000 residents, and prescribers’ mean number of opioid prescriptions per day. Overall, these results suggest that changes to California’s PDMP resulted in significant reductions to total opioid dosages prescribed (in MME), beyond declines that would be expected in the absence of these PDMP features. Changes attributable to these PDMP features ranged between 8% and 14%, which is a modest change for an individual patient, but represents substantial population-level effect on risky prescribing practices.
Our finding that mandatory PDMP registration and proactive reports reduced the overall opioid doses prescribed but did not reduce the number of opioid prescriptions is reassuring because it suggests that California’s PDMP policy changes, as intended, primarily impacted prescribing for patients getting high opioid doses. Most patients getting opioids receive intermittent prescriptions or low doses, so observing significant reductions in the number of opioid prescriptions would have indicated that California’s PDMP changes resulted in decreased prescribing among patients at very low risk of opioid-related harms, for which opioid prescribing is likely to be clinically appropriate and consistent with CDC guidelines.
Higher prescribed opioid doses have been consistently associated with increased risk of opioid-related overdose (Bohnert et al., 2016; King et al., 2014). Therefore, our findings are consistent with prior studies suggesting that these policies also reduce the risk of an opioid overdose at the population-level. Our research is one of the few to examine the impacts of requiring prescribers and pharmacists to register with their states’ PDMP. At least two prior studies have examined the implications of laws requiring prescribers to consult the PDMP before prescribing controlled substances. A three-state study found that implementation of mandatory PDMP use was associated with decreases in multiple provider episodes, overlapping use of benzodiazepines and opioids, and opioid prescribing rate in two of the three states (Strickler et al., 2019). An analysis of Ohios’ mandatory PDMP use law found that it was associated with decreases in the number of oxycodone pills prescribed, but not with changes in patients’ mean prescribed dosage in MMEs (Winstanley et al., 2018). One possible explanation for the discrepancies between these studies and ours is that prescribers who use the PDMP only when they are required to do so are more likely to prescribe to patients who receive prescriptions from multiple prescribers (including prescriptions for benzodiazepines and opioids), and so are more likely to change prescribing when they identify these patients in the PDMP. This explanation is consistent with our prior research showing that most prescribers who registered within eight months of California’s mandatory PDMP registration law did not become regular PDMP users, implying that prescribers who voluntarily use the PDMP after mandatory registration may be different from prescribers who use the PDMP only after being required to do so (Pugliese et al., 2018; Shev et al., 2018). California did pass a new law requiring mandatory PDMP use that was implemented in October 2018, and the effects of this requirement should be evaluated in future studies.
Ours and previous studies have been conducted in time periods marked by substantial changes in opioid-related policies and safe prescribing initiatives at the national, state, and county levels, including California and the two control states (Robinson et al., 2019). In that context, it is likely that county- or state-specific opioid-related initiatives not included in our model may have directly or indirectly influenced opioid prescribing patterns during our study period. Nevertheless, our study has the notable strength of simulating a pragmatic county-level randomized controlled trial of PDMP policy changes over six years; an actual trial is unlikely to be conducted. We designed a county-level quasi-experimental study and used a novel method that both empirically generate a comparable control group for multiple treated units (i.e., counties in California) and considers the confounding effects of time-varying characteristics within states (Xu, 2017). This design allowed us to control for national changes, particularly the publication of CDC opioid prescribing guidelines in March 2016, which was associated with accelerated decreases in several of the dependent variables examined in this study. (Bohnert et al., 2018; Dowell et al., 2016). Our study also controlled for several county-level sociodemographic variables that have been associated with opioid prescribing rates in prior studies (Cerda et al., 2017; Friedman et al., 2019). We also tested several model specifications and conducted sensitivity analyses that yielded results similar to those of our primary analyses. Finally, our use of PDMP data generated by PBSS for multiple states facilitates valid comparisons among states with different PDMPs.
The results of this study should also be interpreted in light of some limitations. We analyzed the joint effect of mandatory registration and proactive reporting, so our study cannot estimate the effects associated with implementing one of these changes without the other. Second, the format, types, and thresholds used to generate proactive reports differ among PDMPs, though almost all PDMPs that have implemented proactive reports include reports for multiple provider episodes and high-dose opioid use. Also, some of the outcome measures used in our paper do not exactly match with the PDMP criteria implemented in the proactive reports. For example, our multiple opioid provider episodes measure used a threshold of ≥5 providers or ≥5 pharmacies in a given quarter, while the proactive report in California’s PDMP used a threshold of ≥6 providers or ≥6 pharmacies in the past 6 months. Third, we were limited to analyzing measures generated by PBSS and so could not evaluate more complex prescribing patterns (e.g., high doses used chronically vs. in short periods of time). Fourth, we were not able to assess prescribing patterns by provider types or settings (e.g., community clinics versus hospitals, primary care prescribers versus specialists). Thus, the potential heterogeneity of the effect across these groups remains an open question. Future studies should investigate whether the effects we observed differ across these groups. Finally, implementing synthetic control methods with multiple treated units is a relatively new and evolving technique (Abadie and L’Hour, 2019, May 17; Bouttell et al., 2018); however, our results were similar when we used a more traditional difference-in-difference approach.
5. Conclusions
The implementation of proactive reports and mandatory registration in California was associated with significant decreases in the total quantity of opioid MMEs prescribed and the proportion of patients getting >90 MME/day. However, the frequency of opioid prescribing and other high-risk prescribing patterns measures (e.g., overlapping prescriptions of opioids and benzodiazepines) did not change significantly. Our results may be useful to other states without mandatory PDMP registration that are considering changes to their PDMP. Many states have begun requiring prescribers to check the PDMP before prescribing opioids. Our study suggests that implementing mandatory PDMP registration (without mandatory use) and proactive patient reports can be effective at reducing high-dose opioid prescribing without impacting the overall number of opioid prescriptions. In cases where mandating PDMP use is not desired or politically feasible, implementing mandatory PDMP registration with proactive reporting may be a viable policy alternative.
Supplementary Material
Highlights.
California’s updated PDMP added proactive reports and mandatory registration
These features were associated with a short-term decrease in 3/7 prescribing outcomes
Decreases in quantity and risky opioids prescribing ranged between 8% and 14%
Freqency and other high-risk opioid prescribing patterns remained unchanged
Acknowledgments
We thank Dr. Peter Kreiner and Gail Strickler from Brandeis University for providing access and helping with the Prescription Behavioral Surveillance System data.
Role of Funding Source:
This work was supported by the Bureau of Justice Assistance grant 2015-PM-BX-K001 and the Centers for Disease Control and Prevention grant 1U17CE002747. ACC was supporter by FONDECYT regular grant 1191282, and SH was supported by the National Institutes of Health grant K23DA043052.
Footnotes
Publisher's Disclaimer: This is a PDF file of an unedited manuscript that has been accepted for publication. As a service to our customers we are providing this early version of the manuscript. The manuscript will undergo copyediting, typesetting, and review of the resulting proof before it is published in its final form. Please note that during the production process errors may be discovered which could affect the content, and all legal disclaimers that apply to the journal pertain.
Conflict of Interest: No conflict declared
References
- Abadie A, Diamond A, Hainmueller J, 2014. Comparative Politics and the Synthetic Control Method. American Journal of Political Science. 59, 495–510. doi: 10.1111/ajps.12116. [DOI] [Google Scholar]
- Abadie A, L’Hour J, 2019, May 17 A Penalized Synthetic Control Estimator for Disaggregated Data, Conference on Synthetic Controls and Related Methods. MIT, Cambridge, MA MIT Institute for Data, Systems, and Society. [Google Scholar]
- Angrist JD, Krueger AB, 1999. Empirical strategies in labor economics, Handbook of labor economics. Elsevier, pp. 1277–1366. [Google Scholar]
- Bohnert AS, Guy GP, Losby JL, 2018. Opioid prescribing in the United States before and after the Centers for Disease Control and Prevention’s 2016 opioid guideline. Annals of Internal Medicine. 169, 367–375. doi: 10.7326/M18-1243. [DOI] [PMC free article] [PubMed] [Google Scholar]
- Bohnert AS, Logan JE, Ganoczy D, Dowell D, 2016. A Detailed Exploration Into the Association of Prescribed Opioid Dosage and Overdose Deaths Among Patients With Chronic Pain. Med Care. 54, 435–441. doi: 10.1097/MLR.0000000000000505. [DOI] [PMC free article] [PubMed] [Google Scholar]
- Bouttell J, Craig P, Lewsey J, Robinson M, Popham F, 2018. Synthetic control methodology as a tool for evaluating population-level health interventions. Journal of Epidemiology and Community Health. 72, 673–678. doi: 10.1136/jech-2017-210106. [DOI] [PMC free article] [PubMed] [Google Scholar]
- Center for Behavioral Health Statistics and Quality, 2019. 2018 National Survey on Drug Use and Health. Substance Abuse and Mental Health Services Administration, Rockville, MD. [Google Scholar]
- Centers for Disease Control and Prevention, 2018. Ten Leading Causes of Death and Injury. 2017 https://www.cdc.gov/injury/wisqars/LeadingCauses.html. (Accessed 10/03 2019). [Google Scholar]
- Cerda M, Gaidus A, Keyes KM, Ponicki W, Martins S, Galea S, Gruenewald P, 2017. Prescription opioid poisoning across urban and rural areas: identifying vulnerable groups and geographic areas. Addiction. 112, 103–112. doi: 10.1111/add.13543. [DOI] [PMC free article] [PubMed] [Google Scholar]
- Deyo RA, Hallvik SE, Hildebran C, Marino M, Springer R, Irvine JM, O’Kane N, Van Otterloo J, Wright DA, Leichtling G, Millet LM, Carson J, Wakeland W, McCarty D, 2018. Association of Prescription Drug Monitoring Program Use With Opioid Prescribing and Health Outcomes: A Comparison of Program Users and Nonusers. J Pain. 19, 166–177. doi: 10.1016/j.jpain.2017.10.001. [DOI] [PMC free article] [PubMed] [Google Scholar]
- Dowell D, Haegerich T, Chou R, 2016. CDC Guideline for Prescribing Opioids for Chronic Pain—United States, 2016. JAMA. 315, 1624–1645. doi: 10.1001/jama.2016.1464. [DOI] [PMC free article] [PubMed] [Google Scholar]
- Driscoll JC, Kraay AC, 1998. Consistent Covariance Matrix Estimation with Spatially Dependent Panel Data. Review of Economics and Statistics. 80, 549–560. doi: 10.1162/003465398557825. [DOI] [Google Scholar]
- Fink DS, Schleimer JP, Sarvet A, Grover KK, Delcher C, Castillo-Carniglia A, Kim JH, Rivera-Aguirre AE, Henry SG, Martins SS, Cerdá M, 2018. Association Between Prescription Drug Monitoring Programs and Nonfatal and Fatal Drug Overdoses. Annals of Internal Medicine. 168, 783. doi: 10.7326/m17-3074. [DOI] [PMC free article] [PubMed] [Google Scholar]
- Friedman J, Kim D, Schneberk T, Bourgois P, Shin M, Celious A, Schriger DL, 2019. Assessment of Racial/Ethnic and Income Disparities in the Prescription of Opioids and Other Controlled Medications in California. JAMA Internal Medicine. 179, 469. doi: 10.1001/jamainternmed.2018.6721. [DOI] [PMC free article] [PubMed] [Google Scholar]
- Gobillon L, Magnac T, 2016. Regional Policy Evaluation: Interactive Fixed Effects and Synthetic Controls. Review of Economics and Statistics. 98, 535–551. doi: 10.1162/rest_a_00537. [DOI] [Google Scholar]
- Gomes T, Tadrous M, Mamdani MM, Paterson JM, Juurlink DN, 2018. The Burden of Opioid-Related Mortality in the United States. JAMA Netw Open. 1, e180217. doi: 10.1001/jamanetworkopen.2018.0217. [DOI] [PMC free article] [PubMed] [Google Scholar]
- Grecu AM, Dave DM, Saffer H, 2018. Mandatory Access Prescription Drug Monitoring Programs and Prescription Drug Abuse. Journal of Policy Analysis and Management. 38, 181–209. doi: 10.1002/pam.22098. [DOI] [PubMed] [Google Scholar]
- Haffajee RM, M., Zhang F, Zaslavsky A, Larochelle M, Wharam F, 2018. Four States With Robust Prescription Drug Monitoring Programs Reduced Opioid Dosages. Health Affairs. 37, 964–974. doi: 10.1377/hlthaff.2017.1321. [DOI] [PMC free article] [PubMed] [Google Scholar]
- Hedegaard H, Minino AM, Warner M, 2018. Drug Overdose Deaths in the United States, 1999–2017. NCHS Data Brief. 329, 1–8. [PubMed] [Google Scholar]
- Henry S, Pugliese J, Gosdin M, Crawford A, Wintemute G, 2017. Survey of California physicians’ and pharmacists’ experience with and attitudes about CURES 2.0 [Google Scholar]
- Hoechle D, 2007. Robust Standard Errors for Panel Regressions with Cross-Sectional Dependence. The Stata Journal. 7, 281–312. doi: . [DOI] [Google Scholar]
- Huang ET, Bell WR, 2012. An empirical study on using previous American Community Survey data versus Census 2000 data in SAIPE models for poverty estimates, Research Report Series Statistics #2012–04. U.S. Census Bureau. [Google Scholar]
- King NB, Fraser V, Boikos C, Richardson R, Harper S, 2014. Determinants of increased opioid-related mortality in the United States and Canada, 1990–2013: a systematic review. Am J Public Health. 104, e32–42. doi: 10.2105/AJPH.2014.301966. [DOI] [PMC free article] [PubMed] [Google Scholar]
- Kreiner PW, Strickler GK, Undurraga EA, Torres ME, Nikitin RV, Rogers A, 2017. Validation of prescriber risk indicators obtained from prescription drug monitoring program data. Drug Alcohol Depend. 173 Suppl 1, S31–s38. doi: 10.1016/j.drugalcdep.2016.11.020. [DOI] [PubMed] [Google Scholar]
- McDonald DC, Carlson KE, Jalbert SK, 2018. An Experimental Test of the Effectiveness of Unsolicited Reporting by a Prescription Drug Monitoring Program in Reducing Inappropriate Acquisition of Opioids. Pain Medicine. 20, 944–954. doi: 10.1093/pm/pny095. [DOI] [PubMed] [Google Scholar]
- McNamee L, Zhang A, 2019. Demographic Engineering and International Conflict: Evidence from China and the Former USSR. International Organization. 73, 291–327. doi: 10.1017/s0020818319000067. [DOI] [Google Scholar]
- Pardo B, 2017. Do more robust prescription drug monitoring programs reduce prescription opioid overdose?. Addiction. 112, 1773–1783. doi: 10.1111/add.13741. [DOI] [PubMed] [Google Scholar]
- Paulozzi L, Strickler G, Kreiner P, Koris C, 2015. Controlled Substance Prescribing Patterns - Prescription Behavior Surveillance System, Eight States, 2013. MMWR Surveill Summ. 64, 1–14. doi: 10.15585/mmwr.ss6409a1. [DOI] [PubMed] [Google Scholar]
- Pauly NJ, Slavova S, Delcher C, Freeman PR, Talbert J, 2018. Features of prescription drug monitoring programs associated with reduced rates of prescription opioid-related poisonings. Drug Alcohol Depend. 184, 26–32. doi: 10.1016/j.drugalcdep.2017.12.002. [DOI] [PMC free article] [PubMed] [Google Scholar]
- Puac-Polanco V, Chihuri S, Fink DS, Cerda M, Keyes KM, Li G, 2020. Prescription Drug Monitoring Programs and Prescription Opioid-Related Outcomes in the United States. Epidemiol Rev. doi: 10.1093/epirev/mxaa002. [DOI] [PMC free article] [PubMed] [Google Scholar]
- Pugliese JA, Wintemute GJ, Henry SG, 2018. Psychosocial Correlates of Clinicians’ Prescription Drug Monitoring Program Utilization. Am J Prev Med. 54, e91–e98. doi: 10.1016/j.amepre.2018.02.009. [DOI] [PMC free article] [PubMed] [Google Scholar]
- R Core Team, 2019. R: A language and environment for statistical computing., 3.6.1 ed R Foundation for Statistical Computing, Vienna, Austria. [Google Scholar]
- Recht H, 2019. censusapi: Retrieve Data from the Census APIs, R package version 0.6.0 ed [Google Scholar]
- Robinson A, Christensen A, Bacon S, 2019. From the CDC: The Prevention for States program: Preventing opioid overdose through evidence-based intervention and innovation. J Safety Res. 68, 231–237. doi: 10.1016/j.jsr.2018.10.011. [DOI] [PMC free article] [PubMed] [Google Scholar]
- Shev AB, Wintemute GJ, Cerdá M, Crawford A, Stewart SL, Henry SG, 2018. Prescription Drug Monitoring Program: Registration and Use by Prescribers and Pharmacists Before and After Legal Mandatory Registration, California, 2010–2017. American Journal of Public Health. 108, 1669–1674. doi: 10.2105/ajph.2018.304704. [DOI] [PMC free article] [PubMed] [Google Scholar]
- Smith N, Martins SS, Kim J, Rivera-Aguirre A, Fink DS, Castillo-Carniglia A, Henry SG, Mooney SJ, Marshall BDL, Davis C, Cerdá M, 2019. A typology of prescription drug monitoring programs: a latent transition analysis of the evolution of programs from 1999 to 2016. Addiction. 114, 248–258. doi: 10.1111/add.14440. [DOI] [PMC free article] [PubMed] [Google Scholar]
- StataCorp, 2019. Stata Statistical Software: Release 16, in: Station C. (Ed.) 16 ed StataCorp LLC, TX. [Google Scholar]
- Strickler GK, Zhang K, Halpin JF, Bohnert ASB, Baldwin GT, Kreiner PW, 2019. Effects of mandatory prescription drug monitoring program (PDMP) use laws on prescriber registration and use and on risky prescribing. Drug Alcohol Depend. 199, 1–9. doi: 10.1016/j.drugalcdep.2019.02.010. [DOI] [PubMed] [Google Scholar]
- Sun BC, Lupulescu-Mann N, Charlesworth CJ, Kim H, Hartung DM, Deyo RA, John McConnell K, 2018. Variations in prescription drug monitoring program use by prescriber specialty. J Subst Abuse Treat. 94, 35–40. doi: 10.1016/j.jsat.2018.08.006. [DOI] [PMC free article] [PubMed] [Google Scholar]
- Wen HF, Schackman BR, Aden B, Bao YH, 2017. States With Prescription Drug Monitoring Mandates Saw A Reduction In Opioids Prescribed To Medicaid Enrollees. Health Affairs. 36, 733–741. doi: 10.1377/hlthaff.2016.1141. [DOI] [PMC free article] [PubMed] [Google Scholar]
- Wilson N, Kariisa MS, P, Smith H, Davis N, 2020. Drug and Opioid-Involved Overdose Deaths — United States, 2017–2018. MMWR Morb Mortal Wkly Rep. 69, 290–297. doi: 10.15585/mmwr.mm6911a4. [DOI] [PMC free article] [PubMed] [Google Scholar]
- Wing C, Simon K, Bello-Gomez RA, 2018. Designing Difference in Difference Studies: Best Practices for Public Health Policy Research. Annual Review of Public Health. 39, 453–469. doi: 10.1146/annurev-publhealth-040617-013507. [DOI] [PubMed] [Google Scholar]
- Winstanley EL, Zhang Y, Mashni R, Schnee S, Penm J, Boone J, McNamee C, MacKinnon NJ, 2018. Mandatory review of a prescription drug monitoring program and impact on opioid and benzodiazepine dispensing. Drug and alcohol dependence. 188, 169–174. doi: 10.1016/j.drugalcdep.2018.03.036. [DOI] [PMC free article] [PubMed] [Google Scholar]
- Xu Y, 2017. Generalized Synthetic Control Method: Causal Inference with Interactive Fixed Effects Models. Political Analysis. 25, 57–76. doi: 10.1017/pan.2016.2. [DOI] [Google Scholar]
- Xu Y, Liu L, 2019. gsynth: Generalized Synthetic Control Method, R package version 1.0.9. ed [Google Scholar]
- Young LD, Kreiner PW, Panas L, 2017. Unsolicited Reporting to Prescribers of Opioid Analgesics by a State Prescription Drug Monitoring Program: An Observational Study with Matched Comparison Group. Pain Medicine. 19, 1396–1407. doi: 10.1093/pm/pnx044. [DOI] [PubMed] [Google Scholar]
Associated Data
This section collects any data citations, data availability statements, or supplementary materials included in this article.