

Summary
To understand brain functions, it is important to observe directly how multiple neural circuits are performing in living brains. However, due to tissue opaqueness, observable depth and spatiotemporal resolution are severely degraded in vivo. Here, we propose an optical brain clearing method for in vivo fluorescence microscopy, termed MAGICAL (magical additive glycerol improves clear alive luminance). MAGICAL enabled two-photon microscopy to capture vivid images with fast speed, at cortical layer V and hippocampal CA1 in vivo. Moreover, MAGICAL promoted conventional confocal microscopy to visualize finer neuronal structures including synaptic boutons and spines in unprecedented deep regions, without intensive illumination leading to phototoxic effects. Fluorescence emission spectrum transmissive analysis showed that MAGICAL improved in vivo transmittance of shorter wavelength light, which is vulnerable to optical scattering, thus unsuited for in vivo microscopy. These results suggest that MAGICAL would transparentize living brains via scattering reduction.
Subject Areas: Optical Imaging, Neuroscience
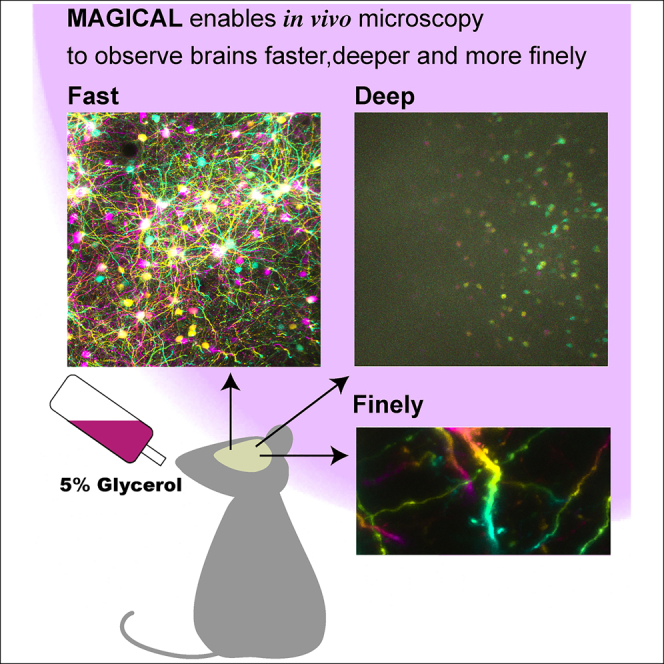
Graphical Abstract
Highlights
-
•
Oral glycerol administration (MAGICAL) enhances fluorescent signals in living brains
-
•
MAGICAL achieves in vivo optical clearing for living brains via scattering reduction
-
•
MAGICAL enables in vivo microscopy to observe brains faster, deeper, and more finely
Optical Imaging; Neuroscience
Introduction
How do neurons work together for brain functions in living animals? In the brain, numerous neurons connect to each other three-dimensionally to form neural circuits underlying brain functions. Functional characteristics of neural circuits depend on neuronal activity and synaptic connectivity, both of which are reflected in fine sculptural distinctions in many cases (Chen et al., 2011; Matsuzaki et al., 2004; Trachtenberg et al., 2002). Multiple neural circuits are associated with each other as a neural network and are executed for rapid processing simultaneously to respond to various situations and their transitions (Margolis et al., 2012). Therefore, to understand brain functions, in vivo imaging techniques are required to observe intact neural circuits extended into deep regions, at high spatiotemporal resolution.
Confocal microscopy and two-photon microscopy can provide three-dimensional (3D) and time-lapse images by sequential optical sectioning in thick specimens without mechanical destruction (Ishikawa-Ankerhold et al., 2012; Nemoto, 2008). However, it is difficult for fluorescence microscopy, especially confocal microscopy, to achieve sufficiently deep, fine, and fast imaging in vivo because tissue opaqueness disturbs and attenuates both excitation lights and fluorescence signals. A simple but practical technique to overcome the opaqueness is high-intensity illumination by using a high-power excitation laser, but it has a risk of causing invasive phototoxic problems via reactive oxygen species production. Thus, new strategies are needed to overcome tissue opaqueness for in vivo imaging.
Recently, many optical clearing methods were reported for fluorescence microscopy in fixed organs including brains (Aoyagi et al., 2015; Chung et al., 2013; Ertürk et al., 2012; Hama et al., 2011; Ke et al., 2013; Kuwajima et al., 2013; Susaki et al., 2014). These clearing methods enable confocal microscopy to achieve fine and deeper imaging and have brought a paradigm shift in connectome analysis to create connection maps over comprehensive neural networks. However, these clearing methods need non-physiological procedures to transparentize fixed organs and thus are especially inapplicable to living brains for in vivo fluorescence microscopy. Here, we propose a new strategy for brain clearing in in vivo microscopy. Our clearing method is simply based on glycerol administration via drinking water, so we named it MAGICAL (magical additive glycerol improves clear alive luminance).
Results
Enhanced fluorescence signals in vivo
For in vivo brain imaging with fluorescence microscopy, the conventional method involves open-skull surgery. It consists of making a cranial window, in which the light-scattering skull bone is replaced by a clear cover glass, and is conceived as a key step affecting the quality of images in day-to-day experiments (Holtmaat et al., 2009). The cranial window and probably the brain itself lose transparency easily, which may be caused by unsuitable surgical techniques leading to bleeding and damage inside/outside the brain and by unknown factors related with the recovery process. Thus, a smaller cranial window is biologically preferred to avoid injuring blood vessels and to suppress changes of intracranial pressure at craniotomy and to minimize contact between the brain surface and the surgical materials (Holtmaat et al., 2009). However, a larger cranial window is optically preferred to collect even light emitted from a focal point at wide radiation angles, by using a high-numerical-aperture lens which governs spatial resolution and fluorescence intensity in imaging. Moreover, a panoramic window replacing most of the parietal bone is necessary for comprehensive imaging to observe the multi-brain area simultaneously.
To make the optically suited window but not to lose the transparency of the brain, a dogma indicated that researchers must master technical skills that achieve the open-skull surgery with much less contacting and invading to the brain. If the dogma is true, most open-skull surgeries indeed lose the transparency of living brains due to damage, especially in the comprehensive imaging. As a solution, we suppose that the optical clearing of living brains may be achieved by pharmacological approaches suppressing damage processes. We focused on glycerol oral administration, which is known to suppress cerebral edema in neurosurgical patients and suggested to supply energy to ischemic neurons in cerebral stroke (Berger et al., 2005; Cantore et al., 1964; Frank et al., 1981; Mathew et al., 1972; Meyer et al., 1971, 1975; Sloviter et al., 1966; Wald and McLaurin, 1982), because the edema is an early hallmark of damaged brains.
First, we examined whether oral administration of glycerol improves cerebral fluorescence images of in vivo two-photon microscopy. As MAGICAL, glycerol was added at 5% (w/v) concentration to drinking water for oral administration from 2 weeks prior to open-skull surgery to the end of the experiment except for the surgery and the observation. We performed in vivo imaging in acute stages of recovery after surgery. Because, from the following stages (a few days after surgery), fibrotic tissue often grows at a space between a cover glass and dura matter covering a brain, it thus makes the window opaque independent of the transparency of a living brain. To visualize neural circuits, we used adult H-line mice (Thy1-EYFP-H), which express enhanced yellow fluorescent protein (EYFP) in some of the pyramidal neurons. To avoid selection bias under uneven EYFP expression, the imaging area was selected according to the xy position where the hippocampus was observable at the most shallow depth. We captured 3D stacks as z series of xy images, using a two-photon microscope with 960-nm Ti:sapphire laser light. The xy images were acquired as 512 × 512 pixels at 1 frame per sec (fps), 2.2 μsec per pixel, which is the maximum speed in this condition.
The images of the cortical layer V (CxLV) neurons were captured with a 3-μm z-step size (Video S1) and were reconstructed with depth color-coded maximum intensity projection (DccMIP). In mice without glycerol administration (control), fluorescence images showed the pyramidal neuron cell bodies with basal dendrites, but the density was poor as a consequence of weak capture conditions (Figure 1A, Video S1). In contrast, in mice with 5% (w/v) glycerol administration (MAGICAL), bright fluorescence images showed many cell bodies and basal dendrites with high density (Figures 1A and Video S1).
Figure 1.

In vivo two-photon imaging at CxLV
(A) DccMIP images of CxLV at 540 ± 30 μm depth in control and MAGICAL. Scale bar represents 100 μm.
(B–C) Representative fluorescence intensity, predicted by the GLMM for each image stack (B) and “treatment” group (C), along “depth.” The distribution of plots in (B) is visualized with violin plots estimated by Gaussian kernel and with 0.25, 0.50, and 0.75 quantile lines. Error bars in (C) are asymptotic 95% CI. Red, MAGICAL; blue, control; ∗∗∗p < 0.001; a.u., arbitrary unit. See also Figures S1 and S2, Table S1, and Video S1.
The image stacks were captured with a 3-μm z-step size by using two-photon microscopy with LP 66 mW and HV 30 at 1 fps. scale bar 100 μm. CxLV, cortical layer V; CxLVI, cortical layer VI; WM, white matter.
In CxLV images at three different depths (Figure S1), fluorescence intensity distribution (FID) indicated that signals tended to increase with MAGICAL (Figure S2). However, it was not simple to summarize the FIDs for statistical analysis. The FIDs showed large individual differences within each treatment group, obscuring differences between the groups. Moreover, the FIDs had non-normal distributions extending beyond the detector's dynamic range. To overcome these problems, we evaluated fluorescence intensities of pixels (FIPs) in the image stacks, by using a generalized linear mixed model (GLMM). The FIPs were randomly selected from the stack and collected as samples, if not saturation or zero intensity, and were used as a response variable in the GLMM with a Gamma error distribution and a log link function. In the GLMM, “treatment” (MAGICAL or control) and “depth” (3 levels) were assigned as fixed effects, and “mouse” was assigned as a random effect for intercepts and “depth” slopes. The GLMM comprised 929,331 FIPs in 78 image stacks, extracted from 3 depths of 26 mice (n = 13 mice in each treatment) under 2 treatments (R2GLMM(m): 0.0147, R2GLMM(c): 0.200, Table S1A). In estimation for fixed effects, the GLMM indicated that MAGICAL enhanced FIPs in the CxLV images (Figures 1B and 1C; p < 0.001 at each “depth” level by pairwise comparison). These signal enhancements mean that MAGICAL can overcome tissue opaqueness enough to improve in vivo imaging.
In vivo two-photon deep imaging with fast speed
To achieve in vivo imaging in deeper regions, the most effective strategy is to use much longer wavelength, less scattered, near-infrared light at high power for two-photon excitation (Kawakami et al, 2013, 2015; Theer et al., 2003). Recently, hippocampal granule cells in the dentate gyrus were visualized at 1.5-mm depth in adult mice by using a 1064-nm laser diode light, in the most successful surgery without bleeding (Kawakami et al., 2015). Furthermore, hippocampal CA1 (HpCA1) neurons can be visualized at 1.0-mm depth in adult mice, by using 1000-nm Ti:sapphire laser light (Kawakami et al., 2015). However, despite the advantage of the longer wavelength strategy, fluorescence acquisitions must collect shorter visible light, attenuated more easily by scattering and absorption in tissues depending on return distance. Indeed, both deep imaging techniques require scanning neurons at 1/16 or fewer fps, which is extremely slow, to visualize neural activity and to overcome image distortions caused by heartbeats. So, as a touchstone of in vivo deep imaging, we examined whether MAGICAL improves adult HpCA1 images at fast scanning.
By using 960-nm Ti:sapphire laser light, HpCA1 images approximately at 1.0-mm depth were captured as 3D stacks, having xy images (512 × 512 pixels) with 1 fps fast speed. In control mice, fluorescence images showed some dim cell bodies of pyramidal neurons (Figures 2A and S3). In contrast, in MAGICAL mice, fluorescence images showed many cell bodies of pyramidal neurons, some of which were clearly visualized together with each apical dendrite descending into deeper regions (Figures 2A and S3).
Figure 2.

In vivo two-photon imaging at HpCA1
(A) DccMIP images of HpCA1 approximately at 975 ± 24 μm depth in control and MAGICAL. In the color code, each center depth is shown as 0 μm relative depth. Scale bar represents 100 μm.
(B–C) Representative fluorescence intensity, predicted by the GLMM for each image stack (B) and “treatment” group (C), along “depth.” The distribution of plots in (B) is visualized with violin plots estimated by Gaussian kernel and with 0.25, 0.50, and 0.75 quantile lines. Error bars in (C) are asymptotic 95% CI. Red, MAGICAL; blue, control; ∗∗∗p < 0.001; a.u., arbitrary unit. See also Figures S3, S4, S5, and Table S1.
In HpCA1 images captured from three different depths ±3 μm (Figure S4), FIDs were shifted to a bright side with MAGICAL (Figure S5). The GLMM at HpCA1 comprised 957,264 FIPs in 78 image stacks, extracted from 3 depths of 26 mice (n = 13 mice in each treatment) under 2 treatments (R2GLMM(m): 0.0714, R2GLMM(c): 0.190, Table S1B). In estimation for fixed effects, the GLMM indicated that MAGICAL also enhanced FIPs in the HpCA1 images, despite long traversing from deep regions (Figures 2B and 2C; p < 0.001 at each “depth” level by pairwise comparison). These results suggest that MAGICAL would promote deep imaging as a practical method to visualize fast activity on mature neural circuits in adult mice.
In vivo confocal fine imaging with single-photon excitation in deeper regions
Despite its superior spatial resolution, confocal microscopy is less suitable for in vivo imaging than two-photon microscopy because its shorter wavelength excitation has an inferior penetration depth and a higher risk for phototoxic effects. Moreover, confocal microscopy cannot efficiently collect fluorescence signals due to a confocal aperture, which excludes most of the signals scattered by the tissue but is needed to remove extrafocal light causing image blur. Therefore, confocal microscopy is vulnerable to tissue opaqueness, especially optical scattering. In general, in vivo confocal microscopy is hardly able to visualize fine neural fibers below 50-μm depth, which poses a dilemma between clear visualization and phototoxicity reduction (Pérez-Alvarez et al., 2013). The above mentioned effects of MAGICAL on in vivo two-photon imaging suggest that it may overcome that dilemma.
Thus, we examined to what extent MAGICAL enables in vivo confocal microscopy to visualize neural fibers in deeper regions. We captured 3D stack images of cortical layer I (CxLI) at 50 ± 5, 100 ± 5, and 150 ± 5 μm depth in H-line mice, by using a confocal microscope with 488-nm laser light (CM image) and a two-photon microscope with 960-nm laser light (2PM image as a reference). The 3D stack images comprise a 1-μm-step z series of xy images, acquired as 512 × 512 pixels at 1 fps. In control mice, dim CM images at 100- and 150-μm depth were hardly able to visualize fine neural fibers except for thick shafts of apical dendrites which extend along the z axis direction (Figures 3A and S6). However, in MAGICAL mice, bright CM images even at 100- and 150-μm depth showed a lot of thin neuronal processes extending in the xy plane across the apical dendrite shaft (Figures 3A and S6).
Figure 3.

In vivo confocal imaging at CxLI
(A) DccMIP images of CxLI at 50 ± 5 μm, 100 ± 5 μm, and 150 ± 5 μm depth, by using two-photon microscopy (2PM) and confocal microscopy (CM). The display range of fluorescence intensity (min–max in 8 bits) is adjusted as follows: 2PM images at every depth, (0–127); CM images at 50, 100, and 150 μm depth, with (0–255), (0–127), and (0–63), respectively. In the color code, each center depth is shown as 0 μm relative depth. Scale bar represents 100 μm.
(B–D) Similarities of the DccMIP images between CM and 2PM at 50 ± 5 μm (B), 100 ± 5 μm (C), and 150 ± 5 μm (D) depth. P(HOGCM ∩ HOG2PM), probability of intersection between HOG features extracted from the CM image and the 2PM image; n = 6 mice in control and n = 7 mice in MAGICAL; n.s., not significant; ∗p < 0.05; a.u., arbitrary unit. See also Figure S6.
We quantified similarities between CM images and 2PM reference images at the same CxLI areas, by using the intersection probability between histogram of oriented gradients (HOG) features extracted from each image. In the HOG comparison, CM images with MAGICAL retained more similarity to 2PM reference images at deeper regions (Figures 3B–3D, p = 0.0484 at 100 μm depth, p = 0.0420 at 150 μm depth, in permuted Brunner-Munzel test, n = 6 in control mice, n = 7 in MAGICAL mice). These results show that MAGICAL improves the observable depth at which in vivo confocal imaging can visualize detailed features.
To evaluate the visualization abilities of confocal microscopy with MAGICAL, we captured 3D stack images with high magnification at around 100-μm depth. In MAGICAL mice, the images showed synaptic structures, such as dendritic spines and axonal boutons, clearly, and fine fibers with less optical aberration along the z axis (Figures 4 and S7). Moreover, in vivo confocal images with MAGICAL did not show remarkable bleaching or phototoxic effects, as observed in time-lapse 3D stack imaging at 5-min intervals for 30 min (Figures 4 and S7). These data suggest that MAGICAL would provide a practical approach to observe deeper regions with superior spatial resolution beyond the dilemma posed by confocal microscopy.
Figure 4.

In vivo confocal high-resolution 4D imaging
Fine confocal 3D images with MAGICAL, captured with time lapse at 5-min intervals for 30 min. 3D images (upper) were reconstructed from 31 optical sections at 1 μm/step. A fine fiber (asterisk) was visualized with less optical aberration along the z axis under the appropriate setting of the confocal aperture. In maximum intensity projection (MIP) images (bottom), synaptic structures, such as dendritic spines (arrowhead) and axonal boutons (dotted circle), were observable. Despite a totality of 217 scans, remarkable bleaching and phototoxic effects were not observed. Scale bar represents 5 μm. See also Figure S7.
Evaluation of clearing ability by fluorescence emission spectrum transmissive analysis
Fluorescence signal enhancement at several depths is one of the phenomena expected with optical clearing. However, it remains unclear whether MAGICAL improves transparency inside living brains. To address the question, we tried to evaluate in vivo transmittance at different wavelengths through the brain.
In conventional transmissive analyses, a certified light source is needed on the other side of a detector beyond a target to calculate transmittance, i.e., the intensity ratio of transmissive light through a target to incident light from the source. In this perspective, fluorescence probes do not suit the light source for in vivo transmissive analysis because original fluorescence intensity within a focal point depends on the amount of the fluorescence probes and the intensity of transmitted excitation light, both of which are unknown and uncontrollable inside living brains. However, a fluorescence emission spectrum is physically certified as emission probability at wavelengths, determined by energy levels and transition frequencies inherent in its molecule. Thus, to evaluate in vivo transmittance, we developed a new analytical method, fluorescence emission spectrum transmissive analysis (FESTA), by using the emission spectrum as a scale-independence of whole fluorescence intensity.
As fluorescence resources of in vivo FESTA, artificial yellow-green (YG) beads (Fluoresbrite YG Microspheres, Calibration Grade 1 μm; Polysciences) were injected into living mouse brains and then were scattered in small clusters with cerebrospinal fluid flow. We calculated the spectral intensity ratio of cyan (458–511 nm) to yellow (560–650 nm) light within in vivo images of the bead clusters (Figure 5A). In contrast to fluorescence intensity, the cyan/yellow ratio was independent of both of amount of the fluorescence probes and two-photon excitation power (Figure S8). However, the cyan/yellow ratio was different between depths (Figure S8). Therefore, it is considered that the cyan/yellow ratio is proportional to a ratio, comprising the emission probability (constant), detector sensitivity (fixed as constant), and transmittance in the return path from inside the brain, for the cyan and yellow light.
Figure 5.

Optical evaluation for living brains
(A) Schematic illustration of the FESTA by using fluorescent YG bead clusters injected into living brains.
(B) In vivo spectral transmission ratio (Δcyan/yellow) while the light returned from deeper regions to 100-μm depth. Red, MAGICAL; blue, control; solid line, average with standard error; dotted line, each trial; n = 6 mice in each group; ∗∗p < 0.01. See also Figure S8.
To focus on internal transmittance in living brains and to remove the constant factors, we evaluated spectral transmission ratio (Δcyan/yellow) while the light returned from deeper regions to 100-μm depth. The Δcyan/yellow gradually decreased along with the depth (Figure 5B). It is, therefore, reasonable to consider that the cyan transmittance is more likely to be decreased than the yellow one because shorter wavelength light is more scattered depending on the optical path length. However, in MAGICAL, a decrease of Δcyan/yellow was suppressed at deeper regions (p = 0.00159 in unpaired two-tailed Welch's t test, 95% confidence interval [CI] = 0.0551–0.174, t = 4.29, df = 10.0, Cohen's d = 2.48, n = 6 mice in each group, at 600-μm depth). These results suggest that MAGICAL improves in vivo transmittance especially of shorter wavelength light susceptible to optical scattering. Thus, we conclude that MAGICAL exerts an optical clearing ability to reduce scattering in living brains.
Discussion
MAGICAL improved clear fluorescence signals, which would be enough to achieve faster imaging in deeper regions in vivo. The imaging speed is one of the most important factors for in vivo observation. Fast imaging enables the visualization of not only instantaneous changes in neural activity with high temporal resolution but also finer structures of neural circuits by overcoming heartbeat-related trembles. In addition, fast imaging is required for enhancement of spatial resolution per time unit and expansion of observable areas within limited experimental time. Furthermore, fast imaging would be preferred to reduce phototoxic effects in vivo. Thus, MAGICAL would be a fundamental method for in vivo imaging to observe extensive neural circuits at high spatiotemporal resolution with less invasiveness.
Our results suggested that MAGICAL can transparentize living brains via scattering reduction. How does MAGICAL suppress the optical scattering in living brains? Generally, the major source of optical scattering in tissues is refractive index mismatches between structural components (nd; approx. 1.5) and interstitial fluids (water, nd; 1.33). A conventional optical clearing is achieved by increasing the refractive index of fluids with high index reagents that can infiltrate into tissues and/or replace original fluids with the reagents themselves and, as a result, reduce the mismatches (Gómez-Gaviro et al., 2020). Glycerol (nd; 1.47 at 100%) is one of the major reagents for optical clearing. The conventional clearing approach is useful for in vivo imaging to observe inside/beyond tough tissues, such as the skin (Novoselova et al., 2020; Wen et al., 2010) and skull (Zhao et al., 2018), which tolerate glycerol immersion even at high concentration keeping a high refractive index. However, glycerol also causes hemolysis in vivo as a function of dose, concentration, and route of administration (Cameron and Finckh, 1956; Frank et al., 1981), indicating that the conventional technique using higher concentration glycerol is less applicable for almost in vivo tissues. In contrast, Iodixanol can achieve to increase the refractive index of medium without toxicity for soft living specimens; thus, it provides optical clearing for in vivo microscopy (Boothe et al., 2017). However, the optical clearing by iodixanol only occurs on the boundary between medium and specimens. Namely, iodixanol can reduce spherical aberrations caused on the surfaces of specimens but not transparentize specimens via scattering reduction. As long as the scattering reduction depends on the replacement of fluids, optical clearing inside soft living specimens would be impossible.
Importantly, MAGICAL achieves optical clearing of living brains regardless of low concentration glycerol (5%), which has almost the same refractive index as water. Some research studies suggested that physiological condition affects optical properties in living tissues via slight changes in solute concentration. In the glucose tolerance test performed on human subjects, a spectrometer detects that the reduced scattering coefficient in the muscle decreases during blood glucose level elevation (Maier et al., 1994). Optical coherence tomography (OCT) monitoring to skins (dermis) shows that signal decay according to observation depth is mitigated after blood glucose level elevation (Larin et al., 2002, 2003, 2012). These results suggest that glucose at the physiological concentration can reduce tissue scattering. However, OCT also shows that optical clearing occurs only at a lower dermis rich with microvessels but not at other outer layers in the skin (Larin et al., 2002). Therefore, the optical clearing with blood glucose level elevation would be insufficient for in vivo microscopy to improve image formation. Microscopy must make a focal point and thus cannot image clearly beyond scattering matter in the optical path. Indeed, any reagents, including glucose, have not yet provided optical clearing agents workable for microscopy even at low concentrations, except for glycerol in MAGICAL. Unlike glucose, glycerol passively permeates into cells through cell membranes and thus may contribute to clearing throughout living brains.
At least, it is clear that MAGICAL needs in vivo physiological reactions to provide optical clearing ability. As originally planned, we suppose that MAGICAL is a pharmacological approach rather than conventionally simple replacements and thus works even at a low concentration with less influence on index mismatch reduction. MAGICAL was designed in reference to the medical treatment for cerebral edema and ischemic stroke (Berger et al., 2005; Cantore et al., 1964; Frank et al., 1981; Mathew et al., 1972; Meyer et al., 1971, 1975; Wald and McLaurin, 1982). Cerebral edema may occur for various reasons: cerebral trauma and inflammation allow the leak of serum proteins, drawing fluid into the brain due to the breakdown of the blood-brain barrier (Kimelberg, 1995). Furthermore, ischemia and hypoxia cause cell swelling due to a dysfunction of ion pumps caused by energy depletion (Kimelberg, 1995). The cerebral edema, in turn, reduces blood flow (ischemia) as a consequence of intracranial hypertension, thereby deteriorating hypoxia. Clinically, glycerol is commonly administrated to patients undergoing neurosurgery and patients with stroke in order to reduce edema via dehydration, thus to decrease intracranial pressure (ICP) and to increase cerebral blood flow (Berger et al., 2005; Cantore et al., 1964; Meyer et al., 1971, 1975; Wald and McLaurin, 1982). From an optical point of view, light scattering is increased in living brains under cerebral ischemia and hypoxia, experimentally induced by blood removal and nitrogen gas inhalation, respectively (Kawauchi et al., 2008, 2011). The increased scattering is attributed to disturbances in cellular/subcellular structures due to energy depletion. In the case of in vivo microscopy, living brains are exposed to loads, such as open-skull surgery, illumination for fluorescence excitation, and slight hypoxia from anesthesia. These loads cause brain trauma and inflammation, which in turn would trigger local edema, which, although not as severe as experimental ischemia and hypoxia, is enough to increase scattering for shorter wavelength light. Altogether MAGICAL protects the living brains from edema and ischemia, it thus would preserve brain transparency.
What are the adverse effects of using MAGICAL for in vivo imaging? In toxicity tests, chronic oral glycerol has been shown as safe for animals, when administered in dosages equal to or lower than 9 g/kg-bw/day (Hine et al., 1953; Johnson et al., 1933). Thus, MAGICAL is considered as a non-invasive treatment, considering that 4.5-mL of 5% (w/v) glycerol is daily administered as drinking water to a mouse weighing approximately 25 g. In the treatment of cerebral edema, glycerol administration does not show severe ICP rebound, electrolyte imbalance, and toxic side effects (Berger et al., 2005; Cantore et al., 1964; Meyer et al., 1971; Wald and McLaurin, 1982). In addition, glycerol administration is expected to improve electroencephalogram and neurological status in patients with ischemic stroke (Mathew et al., 1972; Meyer et al., 1971, 1975). Moreover, glycerol administration is also commonly used to reduce intraocular pressure in patients with glaucoma, without significant side effects suggestive of neurologic dysfunction (Awasthi and Srivastava, 1965). These results suggest that MAGICAL would less disturb fundamental mechanisms executing brain functions. However, glycerol administration would improve energy metabolism in ischemic brains (Meyer et al., 1975), indicating that glycerol can be a cue to trigger some neural activity. The extent to which MAGICAL can modulate neural activity remains unclear and thus probably should be evaluated for each neural circuit of interest.
MAGICAL is the first candidate for the optical clearing method applicable to living brains, easily improving in vivo microscopy without requiring any special skills or devices. Improved transparency for shorter wavelength light with MAGICAL means to expand the usability of various light sources, luminous probes, photosensitive caged compounds, and optogenetic tools for in vivo imaging and optical manipulation. In other words, MAGICAL is an important contribution toward scientific advance, requiring a multi-laser/probe combination, such as the stimulated emission depletion microscopy (Klar et al., 2000), photo-stimulation techniques (Noguchi et al., 2011), and multi-color imaging (Livet et al., 2007). Moreover, MAGICAL enables in vivo microscopy via the cranial window to be combined with other neurological methods that insert electrodes or glass capillaries. These classical methods have been less compatible with in vivo microscopy due to an open-skull dogma that prohibits from contacting the brain to capture clear images. However, FESTA demonstrated that MAGICAL has optical clearing ability on living brains by artificial beads injected by glass capillaries. Thus, MAGICAL would accelerate functional analysis for brain functions, only by oral administration of glycerol.
Limitations of the study
We did not examine the optical clearing ability of MAGICAL for chronic imaging. As aforementioned, the cranial window tends to be opaque in the recovery process for such reasons: bleeding and making fibrotic tissue on the dura. These opaque materials would occur a few days after surgery but partly or nearly completely disappear for 2–3 weeks. Optical transparency directly below the chronic cranial window is spatiotemporally various within recovered mice. Therefore, it is difficult to evaluate quantitatively how long and how extent MAGICAL achieves optical clearing in living brains for chronic imaging. However, considering that brains cannot fully recover from a stroke, we expect that the prevention of edema during the recovery process also contributes to the transparency of living brains for chronic imaging.
Resource availability
Lead contact
Further information and requests for resources and reagents should be directed to and will be fulfilled by the Lead Contact, Tomomi Nemoto (tn@nips.ac.jp).
Materials availability
This study did not generate new unique reagents.
Data and code availability
Data and code are available from the corresponding author upon request.
Methods
All methods can be found in the accompanying Transparent Methods supplemental file.
Acknowledgments
We thank Nikon Imaging Center (NIC) at Hokkaido University for technical support with a 60× objective lens. This research was supported by the “Brain/MIND” from the Japan Agency for Medical Research and Development (AMED) 20dm0207078; by the MEXT/JSPS KAKENHI Grant Number JP15H05953 “Resonance Bio”, JP20H00523 and JP20H05669 from the Japan Society for the Promotion of Sciences (JSPS) in the Ministry of Education, Culture, Sports, Science and Technology (MEXT); by the “Network Joint Research Center for Materials and Devices” in the MEXT; and by the “Dynamic Alliance for Open Innovation Bridging Human, Environment and Materials” in the MEXT.
Author contributions
Conceptualization, K.I., R.K., and T.N.; Data Curation, K.I. and T.O.; Formal Analysis, K.I.; Funding Acquisition, T.N.; Investigation, K.I. and T.O.; Methodology, K.I.; Project Administration, K.I.; Resources, T.N.; Software, K.I.; Supervision, T.N.; Validation, K.I. and T.O.; Visualization, K.I.; Writing – Original Draft Preparation, K.I. and T.N.; Writing – Review & Editing, K.I. and T.N.
Declaration of interests
The authors declare no conflicts of interest related to this research.
Published: January 22, 2021
Footnotes
Supplemental Information can be found online at https://doi.org/10.1016/j.isci.2020.101888.
Supplemental information
References
- Aoyagi Y., Kawakami R., Osanai H., Hibi T., Nemoto T. A rapid optical clearing protocol using 2,2'-thiodiethanol for microscopic observation of fixed mouse brain. PLoS One. 2015;10:e0116280. doi: 10.1371/journal.pone.0116280. [DOI] [PMC free article] [PubMed] [Google Scholar]
- Awasthi P., Srivastava S.N. Role of oral glycerol in glaucoma. Br. J. Ophthalmol. 1965;49:660–666. doi: 10.1136/bjo.49.12.660. [DOI] [PMC free article] [PubMed] [Google Scholar]
- Berger C., Sakowitz O.W., Kiening K.L., Schwab S. Neurochemical monitoring of glycerol therapy in patients with ischemic brain edema. Stroke. 2005;36:e4–e6. doi: 10.1161/01.STR.0000151328.70519.e9. [DOI] [PubMed] [Google Scholar]
- Boothe T., Hilbert L., Heide M., Berninger L., Huttner W.B., Zaburdaev V., Vastenhouw N.L., Myers E.W., Drechsel D.N., Rink J.C. A tunable refractive index matching medium for live imaging cells, tissues and model organisms. eLife. 2017;6:e27240. doi: 10.7554/eLife.27240. [DOI] [PMC free article] [PubMed] [Google Scholar]
- Cameron G.R., Finckh E.S. The production of an acute haemolytic crisis by the subcutaneous injection of glycerol. J. Pathol. Bacteriol. 1956;71:165–172. doi: 10.1002/path.1700710122. [DOI] [PubMed] [Google Scholar]
- Cantore G., Guidetti B., Virno M. Oral glycerol for the reduction of intracranial pressure. J. Neurosurg. 1964;21:278–283. doi: 10.3171/jns.1964.21.4.0278. [DOI] [PubMed] [Google Scholar]
- Chen X., Leischner U., Rochefort N.L., Nelken I., Konnerth A. Functional mapping of single spines in cortical neurons in vivo. Nature. 2011;475:501–505. doi: 10.1038/nature10193. [DOI] [PubMed] [Google Scholar]
- Chung K., Wallace J., Kim S.-Y., Kalyanasundaram S., Andalman A.S., Davidson T.J., Mirzabekov J.J., Zalocusky K.A., Mattis J., Denisin A.K. Structural and molecular interrogation of intact biological systems. Nature. 2013;497:332–337. doi: 10.1038/nature12107. [DOI] [PMC free article] [PubMed] [Google Scholar]
- Ertürk A., Becker K., Jährling N., Mauch C.P., Hojer C.D., Egen J.G., Hellal F., Bradke F., Sheng M., Dodt H.-U. Three-dimensional imaging of solvent-cleared organs using 3DISCO. Nat. Protoc. 2012;7:1983–1995. doi: 10.1038/nprot.2012.119. [DOI] [PubMed] [Google Scholar]
- Frank M.S.B., Nahata M.C., Hilty M.D. Glycerol: a review of its pharmacology, pharmacokinetics, adverse reactions, and clinical use. Pharmacotherapy. 1981;1:147–160. doi: 10.1002/j.1875-9114.1981.tb03562.x. [DOI] [PubMed] [Google Scholar]
- Gómez-Gaviro M.V., Sanderson D., Ripoll J., Desco M. Biomedical applications of tissue clearing and three-dimensional imaging in health and disease. iScience. 2020;23:101432. doi: 10.1016/j.isci.2020.101432. [DOI] [PMC free article] [PubMed] [Google Scholar]
- Hama H., Kurokawa H., Kawano H., Ando R., Shimogori T., Noda H., Fukami K., Sakaue-Sawano A., Miyawaki A. Scale: a chemical approach for fluorescence imaging and reconstruction of transparent mouse brain. Nat. Neurosci. 2011;14:1481–1488. doi: 10.1038/nn.2928. [DOI] [PubMed] [Google Scholar]
- Hine C.H., Anderson H.H., Moon H.D., Dunlap M.K., Morse M.S. Comparative toxicity of synthetic and natural glycerin. A.M.A. Arch. Ind. Hyg. Occup. Med. 1953;7:282–291. [PubMed] [Google Scholar]
- Holtmaat A., Bonhoeffer T., Chow D.K., Chuckowree J., De Paola V., Hofer S.B., Hübener M., Keck T., Knott G., Lee W.-C.A. Long-term, high-resolution imaging in the mouse neocortex through a chronic cranial window. Nat. Protoc. 2009;4:1128–1144. doi: 10.1038/nprot.2009.89. [DOI] [PMC free article] [PubMed] [Google Scholar]
- Ishikawa-Ankerhold H.C., Ankerhold R., Drummen G.P.C. Advanced fluorescence microscopy techniques—FRAP, FLIP, FLAP, FRET and FLIM. Molecules. 2012;17:4047–4132. doi: 10.3390/molecules17044047. [DOI] [PMC free article] [PubMed] [Google Scholar]
- Johnson V., Carlson A.J., Johnson A. Studies on the physiological action of glycerol on the animal organism. Am. J. Phys. 1933;103:517–534. [Google Scholar]
- Kawakami R., Sawada K., Kusama Y., Fang Y.-C., Kanazawa S., Kozawa Y., Sato S., Yokoyama H., Nemoto T. In vivo two-photon imaging of mouse hippocampal neurons in dentate gyrus using a light source based on a high-peak power gain-switched laser diode. Biomed. Opt. Express. 2015;6:891–901. doi: 10.1364/BOE.6.000891. [DOI] [PMC free article] [PubMed] [Google Scholar]
- Kawakami R., Sawada K., Sato A., Hibi T., Kozawa Y., Sato S., Yokoyama H., Nemoto T. Visualizing hippocampal neurons with in vivo two-photon microscopy using a 1030 nm picosecond pulse laser. Sci. Rep. 2013;3:1014. doi: 10.1038/srep01014. [DOI] [PMC free article] [PubMed] [Google Scholar]
- Kawauchi S., Sato S., Ooigawa H., Nawashiro H., Ishihara M., Kikuchi M. Simultaneous measurement of changes in light absorption due to the reduction of cytochrome c oxidase and light scattering in rat brains during loss of tissue viability. Appl. Opt. 2008;47:4164–4176. doi: 10.1364/ao.47.004164. [DOI] [PubMed] [Google Scholar]
- Kawauchi S., Sato S., Uozumi Y., Nawashiro H., Ishihara M., Kikuchi M. Light-scattering signal may indicate critical time zone to rescue brain tissue after hypoxia. J. Biomed. Opt. 2011;16:027002. doi: 10.1117/1.3542046. [DOI] [PubMed] [Google Scholar]
- Ke M.-T., Fujimoto S., Imai T. SeeDB: a simple and morphology-preserving optical clearing agent for neuronal circuit reconstruction. Nat. Neurosci. 2013;16:1154–1161. doi: 10.1038/nn.3447. [DOI] [PubMed] [Google Scholar]
- Kimelberg H.K. Current concepts of brain edema - review of laboratory investigations. J. Neurosurg. 1995;83:1051–1059. doi: 10.3171/jns.1995.83.6.1051. [DOI] [PubMed] [Google Scholar]
- Klar T.A., Jakobs S., Dyba M., Egner A., Hell S.W. Fluorescence microscopy with diffraction resolution barrier broken by stimulated emission. Proc. Natl. Acad. Sci. U S A. 2000;97:8206–8210. doi: 10.1073/pnas.97.15.8206. [DOI] [PMC free article] [PubMed] [Google Scholar]
- Kuwajima T., Sitko A.A., Bhansali P., Jurgens C., Guido W., Mason C. ClearT: a detergent- and solvent-free clearing method for neuronal and non-neuronal tissue. Development. 2013;140:1364–1368. doi: 10.1242/dev.091844. [DOI] [PMC free article] [PubMed] [Google Scholar]
- Larin K.V., Eledrisi M.S., Motamedi M., Esenaliev R.O. Noninvasive blood glucose monitoring with optical coherence tomography: a pilot study in human subjects. Diabetes Care. 2002;25:2263–2267. doi: 10.2337/diacare.25.12.2263. [DOI] [PubMed] [Google Scholar]
- Larin K.V., Ghosn M.G., Bashkatov A.N., Genina E.A., Trunina N.A., Tuchin V.V. Optical clearing for OCT image enhancement and in-depth monitoring of molecular diffusion. IEEE J. Select. Top. Quan. Electron. 2012;18:1244–1259. [Google Scholar]
- Larin K.V., Motamedi M., Ashitkov T.V., Esenaliev R.O. Specificity of noninvasive blood glucose sensing using optical coherence tomography technique: a pilot study. Phys. Med. Biol. 2003;48:1371–1390. doi: 10.1088/0031-9155/48/10/310. [DOI] [PubMed] [Google Scholar]
- Livet J., Weissman T.A., Kang H., Draft R.W., Lu J., Bennis R.A., Sanes J.R., Lichtman J.W. Transgenic strategies for combinatorial expression of fluorescent proteins in the nervous system. Nature. 2007;450:56–62. doi: 10.1038/nature06293. [DOI] [PubMed] [Google Scholar]
- Maier J.S., Walker S.A., Fantini S., Franceschini M.A., Gratton E. Possible correlation between blood glucose concentration and the reduced scattering coefficient of tissues in the near infrared. Opt. Lett. 1994;19:2062–2064. doi: 10.1364/ol.19.002062. [DOI] [PubMed] [Google Scholar]
- Margolis D.J., Lütcke H., Schulz K., Haiss F., Weber B., Kügler S., Hasan M.T., Helmchen F. Reorganization of cortical population activity imaged throughout long-term sensory deprivation. Nat. Neurosci. 2012;15:1539–1546. doi: 10.1038/nn.3240. [DOI] [PubMed] [Google Scholar]
- Mathew N.T., Rivera V.M., Meyer J.S., Charney J.Z., Hartmann A. Double-blind evaluation of glycerol therapy in acute cerebral infarction. Lancet. 1972;300:1327–1329. doi: 10.1016/s0140-6736(72)92775-4. [DOI] [PubMed] [Google Scholar]
- Matsuzaki M., Honkura N., Ellis-Davies G.C.R., Kasai H. Structural basis of long-term potentiation in single dendritic spines. Nature. 2004;429:761–766. doi: 10.1038/nature02617. [DOI] [PMC free article] [PubMed] [Google Scholar]
- Meyer J.S., Charney J.Z., Rivera V.M., Mathew N.T. Treatment with glycerol of cerebral œdema due to acute cerebral infarction. Lancet. 1971;298:993–997. doi: 10.1016/s0140-6736(71)90321-7. [DOI] [PubMed] [Google Scholar]
- Meyer J.S., Itoh Y., Okamoto S., Welch K.M., Mathew N.T., Ott E.O., Sakaki S., Miyakawa Y., Chabi E., Ericsson A.D. Circulatory and metabolic effects of glycerol infusion in patients with recent cerebral infarction. Circulation. 1975;51:701–712. doi: 10.1161/01.cir.51.4.701. [DOI] [PubMed] [Google Scholar]
- Nemoto T. Living cell functions and morphology revealed by two-photon microscopy in intact neural and secretory organs. Mol. Cells. 2008;26:113–120. [PubMed] [Google Scholar]
- Noguchi J., Nagaoka A., Watanabe S., Ellis-Davies G.C.R., Kitamura K., Kano M., Matsuzaki M., Kasai H. In vivo two-photon uncaging of glutamate revealing the structure-function relationships of dendritic spines in the neocortex of adult mice. J. Physiol. (Lond.) 2011;589:2447–2457. doi: 10.1113/jphysiol.2011.207100. [DOI] [PMC free article] [PubMed] [Google Scholar]
- Novoselova M.V., Abakumova T.O., Khlebtsov B.N., Zatsepin T.S., Lazareva E.N., Tuchin V.V., Zharov V.P., Gorin D.A., Galanzha E.I. Optical clearing for photoacoustic lympho- and angiography beyond conventional depth limit in vivo. Photoacoustics. 2020;20:100186. doi: 10.1016/j.pacs.2020.100186. [DOI] [PMC free article] [PubMed] [Google Scholar]
- Pérez-Alvarez A., Araque A., Martin E.D. Confocal microscopy for astrocyte in vivo imaging: recycle and reuse in microscopy. Front. Cell. Neurosci. 2013;7:51. doi: 10.3389/fncel.2013.00051. [DOI] [PMC free article] [PubMed] [Google Scholar]
- Sloviter H.A., Shimkin P., Suhara K. Glycerol as a substrate for brain metabolism. Nature. 1966;210:1334–1336. doi: 10.1038/2101334a0. [DOI] [PubMed] [Google Scholar]
- Susaki E.A., Tainaka K., Perrin D., Kishino F., Tawara T., Watanabe T.M., Yokoyama C., Onoe H., Eguchi M., Yamaguchi S. Whole-brain imaging with single-cell resolution using chemical cocktails and computational analysis. Cell. 2014;157:726–739. doi: 10.1016/j.cell.2014.03.042. [DOI] [PubMed] [Google Scholar]
- Theer P., Hasan M.T., Denk W. Two-photon imaging to a depth of 1000 μm in living brains by use of a Ti:Al2O3 regenerative amplifier. Opt. Lett. 2003;28:1022–1024. doi: 10.1364/ol.28.001022. [DOI] [PubMed] [Google Scholar]
- Trachtenberg J.T., Chen B.E., Knott G.W., Feng G., Sanes J.R., Welker E., Svoboda K. Long-term in vivo imaging of experience-dependent synaptic plasticity in adult cortex. Nature. 2002;420:788–794. doi: 10.1038/nature01273. [DOI] [PubMed] [Google Scholar]
- Wald S.L., McLaurin R.L. Oral glycerol for the treatment of traumatic intracranial hypertension. J. Neurosurg. 1982;56:323–331. doi: 10.3171/jns.1982.56.3.0323. [DOI] [PubMed] [Google Scholar]
- Wen X., Mao Z., Han Z., Tuchin V.V., Zhu D. In vivo skin optical clearing by glycerol solutions: mechanism. J. Biophotonics. 2010;3:44–52. doi: 10.1002/jbio.200910080. [DOI] [PubMed] [Google Scholar]
- Zhao Y.-J., Yu T.-T., Zhang C., Li Z., Luo Q.-M., Xu T.-H., Zhu D. Skull optical clearing window for in vivo imaging of the mouse cortex at synaptic resolution. Light Sci. Appl. 2018;7:17153. doi: 10.1038/lsa.2017.153. [DOI] [PMC free article] [PubMed] [Google Scholar]
Associated Data
This section collects any data citations, data availability statements, or supplementary materials included in this article.
Supplementary Materials
The image stacks were captured with a 3-μm z-step size by using two-photon microscopy with LP 66 mW and HV 30 at 1 fps. scale bar 100 μm. CxLV, cortical layer V; CxLVI, cortical layer VI; WM, white matter.
Data Availability Statement
Data and code are available from the corresponding author upon request.