Abstract
Introduction:
Rectal cancer ranks as the eighth in cancer-related morbidity and the tenth in the cancer-related mortality. A few studies have explored several biomarkers for colorectal cancer. However, there is still a great need for us to excavate novel biomarkers with effective and efficient diagnostic and prognostic values to discover the etiology and pathogenesis of rectal cancer separately. Therefore, we aimed to identify more novel candidate genes that were significantly associated with rectal cancer through integrated bioinformatics analysis.
Methods:
We analyzed the gene expression profiles of GSE15781 and GSE20842 from Gene Expression Omnibus database to identify differentially expressed genes between normal rectal tissue and rectal cancer tissue.
Results:
We searched for core genes, carried out survival analysis and analyzed the expressions of core genes. We found that 142 genes were significantly upregulated, and 229 genes were significantly downregulated in all 3 independent studies. In KEGG analysis, the upregulated genes were significantly enriched in cytokine-cytokine receptor interaction, IL-17 signaling pathway, cell cycle, etc. The downregulated genes were primarily enriched in nitrogen metabolism, mineral absorption and pentose and glucuronate interconversions. Inhibin subunit beta B (INHBB) expressed markedly higher in rectal cancer tissues compared with normal tissues, and claudins (CLDN) 23 expressed significantly lower in rectal cancer tissues.
Conclusion:
In conclusion, we discovered that INHBB could provide a great significant diagnostic and prognostic values for rectal cancer.
Keywords: rectal cancer, integrated bioinformatics, INHBB
Introduction
In the latest global cancer statistics, it is well-established that there are 18.1 million new cases and 9.6 million cancer deaths worldwide in 2018. Rectal cancer, with 704,376 new cases recorded (3.9%/100%) and 310,394 deaths recorded (3.2%/100%), ranks as the eighth in cancer-related morbidity and the tenth in cancer-related mortality.1 The modernization process and higher intake of red and processed meat have made a higher incidence of rectal cancer in China. It was also associated with an upward trend in age-related mortality and an upward trend in age-related incidence in female.2,3
A few studies have explored several biomarkers for colorectal cancer. Yang et al. found that genes like CXCL5 or COL1A1 can enrich the chemokine signaling pathway or ECM receptor interaction to influence the metastasis and the growth of colorectal cancer.4 Liang et al. revealed modulator in transmembrane signaling systems such as GNG2, angiotensinogen related gene such as ATG markedly related to the mutations in K-ras and p53 to initiates tumorigenesis, etc.5 Another report from Guo et al. showed that the expression of genes, which were associated with cell cycle process such as CDK1, CCNB1, or with chemokines and G-protein coupled receptor signaling pathways such as LGR5, changed obviously in colorectal cancer than normal tissue.6 Jung et al. proved in both public data analysis and experience that high expression of RPS4X was correlated with colorectal cancer cell type. High expression of ECT2 with lack of lymphatic infiltration was related to an early stage of cancer and lack of family history of colorectal cancer.7 However, we found that many studies in this field usually incorporate rectal cancer into colon cancer research. We also notice that there are many differences between colon cancer and rectal cancer not only in clinical characters, including complications, short-term survival and recurrences, but also in gene expression profiles, carcinogenesis pathways, and drug targets.8-10
Therefore, there is still a great need for us to excavate novel biomarkers with great diagnostic and prognostic values to uncover the etiology and pathogenesis of rectal cancer separately. In addition, due to the second-generation gene sequencing being generally extensively applied,11 numerous neoplastic data are displayed and available in several public databases. To find out the molecular mechanisms of rectal cancer, we analyzed the gene expression profiles of The Cancer Genome Atlas database (http://cancergenome.nih.gov/) and GSE15781 and GSE20842 from Gene Expression Omnibus (GEO, http://www.ncbi.nlm.nih.gov/geo/) database to search for the differentially expressed genes (DEGs) between normal rectal tissue and rectal cancer tissue.12,13 These DEGs were subjected to gene ontology (GO) enrichment analysis, Kyoto Encyclopedia of Genes, and Genomes (KEGG) pathway analysis, protein-protein interaction (PPI) network analysis. Survival analysis, as well as expression of core genes, were analyzed for better understanding the mechanism of rectal cancer. As a result, we discovered that INHBB could provide great significant diagnostic and prognostic value for rectal cancer.
Materials and Methods
Ethical Compliance
The clinical information and sequence data were acquired from gene expression profiles of GSE15781 and GSE20842. They were downloaded from GEO and TCGA databanks of rectal cancer and normal rectal tissues. No ethics committee approval or consent procedure was needed.
Data Source
High-sequence data of GSE15781 (GPL4133, Agilent-014850 Whole Human Genome Microarray 4 × 44 K G4112F) that were deposited by Snipstad et al. were collected from GEO dataset. Thirteen rectal cancer tissues and 10 normal rectal tissues were utilized for the consequent analysis.14 Other high-sequence data of GSE20842 (GPL2986, ABI Human Genome Survey Microarray Version 2) that were deposited by Gaedcke et al. were collected from GEO dataset, which includes 65 individuals until Feb. 22, 2018. Sixty-five rectal cancer tissues, including 30 with KRAS mutation and 65 normal rectal mucosae, were utilized for the following analysis.15 The pre-processed high-sequence data and relevant information on rectal cancer were downloaded from the TCGA data portal. A total of 167 rectal cancer tissues and 10 normal controls were included for subsequent analysis.
DEGs Analysis in Rectal Cancer
Scale method of Limma R package (version 3.8) was performed with the GEO data for background normalization.16 DEGs were then scooped out through the assistant of Limma R package. For TCGA data, DEGs were screened by the cut-off criteria of p < 0.05 and |logFC| ≥ 1 by edgeR package (version 3.8).17 Pheatmap R package (version 1.0.12) was applied for volcano plots and heatmaps for 3 datasets and intersect function in R were used to identifying the common DEGs among GSE15781, GSE20842, and TCGA.18 The Venn diagram was produced by VennDiagram R package (version 1.6.20).19
GO Analysis Term and KEGG Pathway Enrichment Analysis
GO analysis, including molecular function, biological process, cellular component, and immune system process, was utilized for potential mechanisms of DEGs by plugin ClueGO (version 2.5.4) of Cytoscape software (version 3.7.1; www.cytoscape.org).20,21 Moreover, the Clusterprofiler R package (version 3.8) was carried on the Kyoto Encyclopedia of Genes and Genomes (KEGG) pathway analysis. P < 0.05 was considered significantly different.22
PPI Network and Sub-Modules Analysis
PPI network of DEGs was explored and analyzed by the online tool Search Tool for the Retrieval of Interacting Genes (STRING) database (version 11.0; http://string-db.org/).23 After evaluating and mapping the interactive associations among common DEGs, the Cytoscape software was chosen for constructing and visualizing for PPI information. Plugin Molecular Complex Detection (MCODE) (version 1.5.1) of Cytoscape software was brought to dig out parameters and clusters that tightly connected in PPI networks.24
Survival and Expression Analysis to Filter and Validate the Concentrate Genes
Gene Expression Profiling Interactive Analysis (GEPIA; http://gepia.cancer-pku.cn/) website, a portal according to the TCGA database, was wielded to probe survival analysis.25 Rectal cancer samples were divided into high, median and low expression group. Then, we used the Kaplan–Meier method to analyze the candidate genes of significant prognostic value with a P value < 0.05. The genes with significant differences in the survival time were regarded as core genes, which were further chosen to seek for differences in expression in GEPIA.
Forecast of Related Non-Coding RNAs of Core Genes
Gene Cloud Biotechnology information(GCBI; http://www.gcbi.com.cn/) was applied for forecasting the interactive relations of core genes and non-coding RNAs for further investigation.
Results
Identification of DEGs Among GSE15781, GSE20842, and TCGA
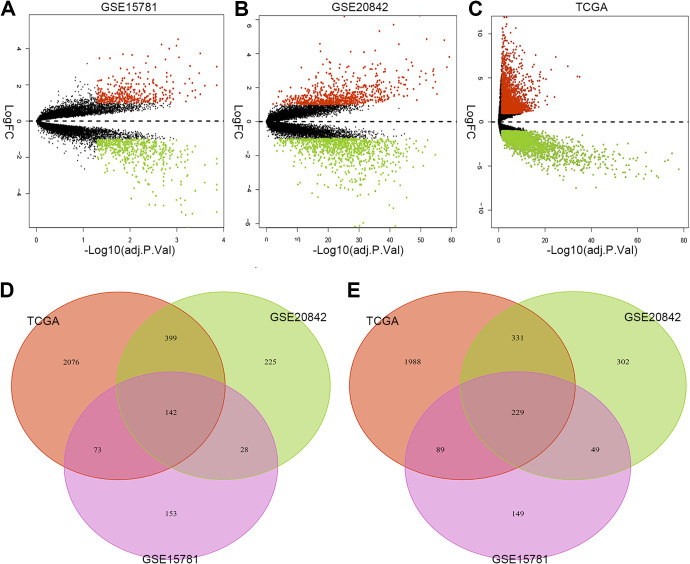
DEGs analysis was winnowed by the cut-off criteria of P < 0.05 and |logFC| ≥ 1. The DEGs were visually and respectively represented through detecting the expression of DEGs between cancer tissue and normal controls from separate studies as heatmaps showed. Orange or green dots in the volcano plots indicated upregulated or downregulated genes (Figure 1A-C). After that, common DEGs among GSE15781, GSE20842, and TCGA are tallied from DEGs of separate studies (Figure 1D-E). From statistics, a total of 142 genes were significantly upregulated, and 229 genes were significantly downregulated in all 3 independent studies. The common upregulated (logFC > 1, P < 0.05) genes and downregulated (logFC < −1, P < 0.05) genes were listed in Table 1.
Figure 1.
Volcano plots and Venn diagrams of the common DEGs identified in profiling datasets. Notes: Volcano plots of the common DEGs according to the value of P < 0.05 and |logFC| ≥ 1 between normal rectal tissue and cancer tissue in (A) GSE15781, (B) GSE20842 and (C) TCGA databanks are showed. Red or green dots indicate upregulated or downregulated genes in profiling datasets. Venn diagrams of DEGs between normal rectal tissue and cancer tissue samples among 3 datasets are showed. The (D) upregulated and (E) downregulated genes in the 3 datasets are marked respectively. Abbreviations: DEG, differentially expressed genes. Y-axis shows the fold-change in gene expression between normal rectal tissue and cancer tissue, x-axis shows the statistical significance of the differences.
Table 1.
DEGs in the Rectal Cancer Tissues Compared to Normal Tissues.
| DEGs | Gene names |
|---|---|
| Upregulated DEGs | ABCC1, ALDOB, ANLN, APOBEC1, AQP9, ARG2, ARID3A, ASPM, AXIN2, AZGP1, BOP1, BUB1, C4BPA, CA9, CCNB1, CDC25B, CDCA7, CDH3, CDK4, CEBPB, CELSR3, CENPA, CENPF, CGREF1, CHI3L1, CKS2, CLDN1, COL4A1, COL7A1, COL8A1, CSE1L, CST1, CTHRC1, CXCL1, CXCL11, CXCL2, CXCL3, CXCL5, CXCL6, CYP4X1, DACH1, DDIT4, DEFA6, DKC1, DPEP1, DUSP14, DUSP4, EDNRA, EGFL6, ESM1, ETV4, FABP6, FAM19A5, FAM3B, FANCB, FAP, GDF15, GPSM2, GPT2, GTF2IRD1, GZMB, HOMER1, HTRA3, IFITM1, IFITM3, IL11, IL13RA2, IL23A, INHBA, INHBB, JAG2, KHK, KLK10, KRT17, KRT23, LRP8, MCM4, MEST, MFAP2, MMP11, MMP12, MMP3, MMP7, MTHFD1L, MYBL2, NEBL, NFE2L3, NMB, OSM, PHLDA1, PITX2, PRC1, PROX1, PSAT1, PTP4A3, PTTG1, RAD54L, REG1A, REG3A, RFC3, RGS16, RIPK2, RNASEH2A, RPP40, S100A2, S100A9, SAA1, SAA2, SERPINE2, SLC22A3, SLC39A10, SLC5A6, SLC6A20, SLCO4A1, SNTB1, SOX9, STRA6, SULF1, SULT2B1, TACSTD2, TCN1, TDGF1, TDO2, TGFBI, THBS2, TNFRSF10C, TOMM34, TOP1MT, TOP2A, TPX2, TRAP1, TRIB3, TRIP13, TTK, TYRO3, UBD, UBE2C, UBE2S, VSNL1, WNT2, WNT5A, XPOT |
| Downregulated DEGs | ABCA8, ABCG2, ABHD3, ACADS, ACAT1, ACVRL1, ADAMDEC1, ADH1C, AKAP7, AKR1B10, AMPD1, ANGPTL1, AOC3, AQP8, ATP2A3, B3GALT5, BCAR3, BCAS1, BMP6, BTNL8, C7, CA1, CA12, CA2, CA4, CA7, CAPN13, CBLN2, CCL19, CD36, CD79A, CDH19, CDKN2B, CEACAM7, CES2, CHGA, CHGB, CHST5, CILP, CKB, CLCA4, CLDN23, CLDN8, CLEC10A, CLEC3B, CLIC5, CLMN, CLU, CPB1, CPM, CPNE5, CPNE8, CR2, CRYBA2, DEFB1, DHRS9, DISP2, DNASE1L3, DSC2, EAF2, EDN3, EFEMP1, ENTPD5, ENTPD8, EPB41L3, ETHE1, F13A1, FABP1, FABP2, FAM3D, FCGBP, FEV, FGFBP1, FGL2, FHL1, FMN2, FMO5, FOLR2, FUCA1, FXYD3, GALNT12, GCG, GCNT3, GDPD2, GHR, GLTP, GNE, GNG7, GP2, GPA33, GPM6B, GPT, GREM2, GSN, GUCA2A, HGD, HHLA2, HIST1H1C, HOXD10, HOXD11, HPGD, HRASLS2, HSD11B2, HSD17B2, IL1R2, IL6R, INSL5, IQGAP2, ITLN1, ITM2A, ITM2C, ITPKA, JAM2, KLK1, KRT20, KRTAP13-2, LDHD, LGALS2, LGALS4, LGI1, LGI4, LIPH, LMOD1, LRRC19, LTK, MAL, MAOA, MATN2, MEP1A, MMP28, MS4A12, MT1E, MT1F, MT1G, MT1H, MT1X, MTM1, MXI1, MYO1A, NAP1L2, NEDD4L, NEU4, NEUROD1, NPY, NR3C1, NR3C2, OGN, P2RY14, PAPSS2, PCSK5, PDCD4, PDE6A, PDE9A, PDGFD, PINK1, PKIB, PLA2G10, PLAC8, PLCD1, PLCG2, PLCL2, PLS1, POU2AF1, PPARGC1A, PPP2R3A, PRDX6, PRKACB, PTN, PTPRH, PYY, RAB37, RDH5, RHBDL2, RIOK3, ROR1, SAMD9, SCG2, SCGB2A1, SCGN, SCIN, SCN4B, SCNN1B, SDCBP2, SELENBP1, SEMA6A, SFRP1, SIDT1, SLC17A4, SLC22A5, SLC25A20, SLC26A2, SLC26A3, SLC30A10, SLC4A4, SLCO2A1, SMPD1, SMPDL3A, SPDEF, SPIB, SPINK2, SPINK5, SPPL2A, SRI, SRPX, SSPN, SST, ST6GALNAC6, STMN2, STYK1, SULT1A2, SYTL2, TBX10, TMCC3, TMPRSS2, TNFRSF17, TRIM36, TRPM6, TSLP, TSPAN1, TUBAL3, TXNIP, UGDH, UGP2, UGT1A8, UGT2B17, VLDLR, VPREB3, VSIG2, ZZEF1 |
GO Enrichment and KEGG Pathway Analyses of Common DEGs
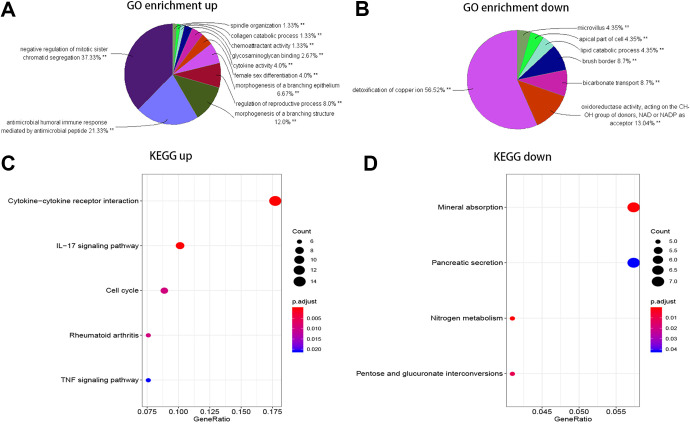
In GO enrichment analysis, the upregulated genes that were mainly enriched in regulation of sister chromatid segregation, antimicrobial humoral immune response mediated by an antimicrobial peptide, morphogenesis of a branching structure, etc. The downregulated genes were concentrated in detoxification of copper ion, oxidoreductase activity, acting on the CH-OH group of donors, NAD or NADP as acceptor, and bicarbonate transport, etc (Figure 2A). In KEGG analysis, the upregulated genes were significantly enriched in cytokine-cytokine receptor interaction, interleukin (IL)-17 signaling pathway, and cell cycle, etc. The downregulated genes were primarily enriched in nitrogen metabolism, mineral absorption and pentose and glucuronate interconversions (Figure 2B, Table 2). Those primarily enriched terms and pathways could support us for further research on how significant DEGs play a role in rectal cancer.
Figure 2.
GO enrichment analysis and KEGG analysis of the upregulated and downregulated genes. Notes: The momentous GO terms with statistical significance in the enrichment analysis of the (A) upregulated and (B) downregulated genes and the momentous KEGG pathways with statistical significance in the enrichment analysis of (C) upregulated and (D) downregulated genes are showed. **P < 0.01, *P < 0.05. Abbreviations: GO, Gene ontology enrichment analysis; KEGG, Kyoto Encyclopedia of Genes and Genomes.
Table 2.
KEGG Pathway Analysis of DEGs Associated With Rectal Cancer.
| Term | Count | Genes | P-value |
|---|---|---|---|
| Upregulated | |||
| hsa04060:Cytokine-cytokine receptor interaction | 14 | CXCL1/CXCL11/CXCL2/CXCL3/CXCL5/CXCL6/GDF15/IL11/IL13RA2/IL23A/INHBA/INHBB/OSM/TNFRSF10C | 0.000143631 |
| hsa04657:IL-17 signaling pathway | 8 | CEBPB/CXCL1/CXCL2/CXCL3/CXCL5/CXCL6/MMP3/S100A9 | 0.0002463 |
| hsa04110:Cell cycle | 7 | BUB1/CCNB1/CDC25B/CDK4/MCM4/PTTG1/TTK | 0.009485537 |
| hsa05323:Rheumatoid arthritis | 6 | CXCL1/CXCL5/CXCL6/IL11/IL23A/MMP3 | 0.009485537 |
| hsa04668:TNF signaling pathway | 6 | CEBPB/CXCL1/CXCL2/CXCL3/CXCL5/MMP3 | 0.020959046 |
| Downregulated | |||
| hsa00910:Nitrogen metabolism | 5 | CA1/CA12/CA2/CA4/CA7 | 0.000941021 |
| hsa04978:Mineral absorption | 7 | MT1E/MT1F/MT1G/MT1H/MT1X/SLC26A3/TRPM6 | 0.001282282 |
| hsa00040:Pentose and glucuronate interconversions | 5 | AKR1B10/UGDH/UGP2/UGT1A8/UGT2B17 | 0.011412911 |
| hsa04972:Pancreatic secretion | 7 | ATP2A3/CA2/CLCA4/CPB1/PLA2G10/SLC26A3/SLC4A4 | 0.041915902 |
Note: The upregulated genes were significantly enriched in cytokine-cytokine receptor interaction, IL-17 signaling pathway and the cell cycle etc. The downregulated genes were primarily enriched in nitrogen metabolism, mineral absorption and pentose and glucuronate interconversions etc.
Abbreviations: KEGG, Kyoto Encyclopedia of Genes and Genomes. DEG, differentially expressed genes.
PPI Network Analysis and Concentrate Genes Identification
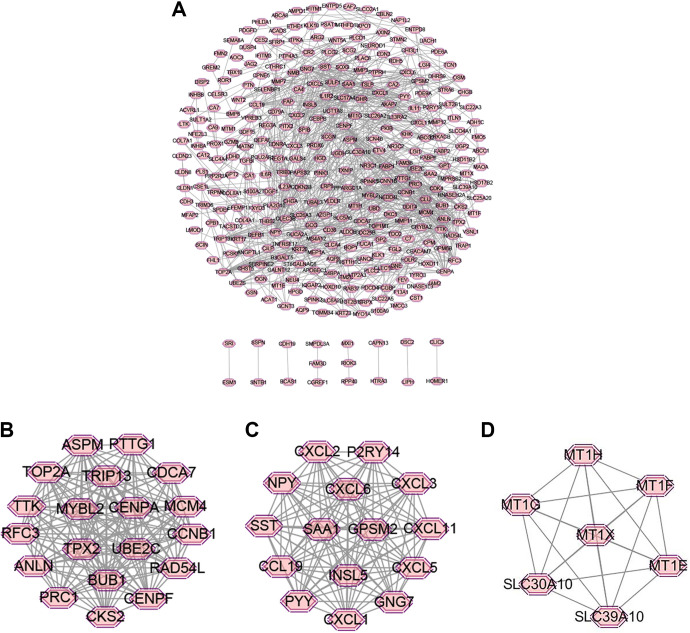
The PPI network complex of common DEGs was constructed by STRING database and Cytoscape software. In the aggregate, 371 common DEGs were selected into the PPI network (Figure 3A). The Cytoscape software was employed to analyze and visualize the interactive relationship of the related proteins. Afterward, the MCODE plugin was utilized to score and locate clusters with the optimal result for the network. Twelve clusters were calculated according to k-core of 2. Among them, cluster 1 that mainly correlated with negative regulation of chromosome organization had 19 nodes and 159 edges, cluster 2 that mainly correlated with chemokine activity had 15 nodes and 105 edges, cluster 3 that mainly correlated with detoxification of copper ion had 7 nodes and 21 edges, were the top 3 in these clusters (Figure 3B-D). 88 concentrate genes are filtered in the 12 clusters: CDCA7, MYBL2, RFC3, ASPM, CENPA, ANLN, PTTG1, TPX2, TOP2A, TTK, RAD54 L, BUB1, CENPF, CCNB1, MCM4, UBE2C, TRIP13, CKS2, PRC1/CXCL6, CXCL1, GPSM2, SST, NPY, CCL19, PYY, INSL5, GNG7, P2RY14, CXCL2, CXCL3, CXCL5, CXCL11, SAA1/MT1 H, MT1G, MT1E, MT1F, MT1X, SLC30A10, SLC39A10/VLDLR, GP2, FOLR2, CPM, CLU, ABCG2, SLC22A5, CEACAM7, SAA2, SLCO4A1, ABCC1/MMP3, WNT5A, WNT2, BMP6/GCNT3, CHST5, ST6GALNAC6, B3GALT5/AXIN2, NMB, EDN3, SOX9, SFRP1, EDNRA, GCG/SCG2, CHGA, CHGB/OSM, IL11, GHR/HPGD, HSD17B2, NR3C2, CLDN8, CLDN1/ACVRL1, MTM1, ITPKA, PLCD1, PLCG2, CD36, INHBA, INHBB, THBS2. According to the MCODE k-score, these genes mentioned above may play a critical role in rectal cancer.
Figure 3.
Cluster analysis of the PPI network. Notes: (A) Three-hundred-seventy-one common DEGs were filtered into the PPI network complex. (B) Cluster 1 mainly correlates with negative regulation of chromosome organization has 19 nodes and 159 edges, (C) cluster 2 that mainly correlates with chemokine activity has 15 nodes and 105 edges, (D) cluster 3 mainly correlates with detoxification of copper ion has 7 nodes and 21 edges, are the top 3 in all 12 clusters with k-core ≥ 2. Abbreviations: DEG, differentially expressed genes; PPI, protein-protein interaction.
Survival Analysis and Gene Expression Analysis to Filter and Validate the Core Genes
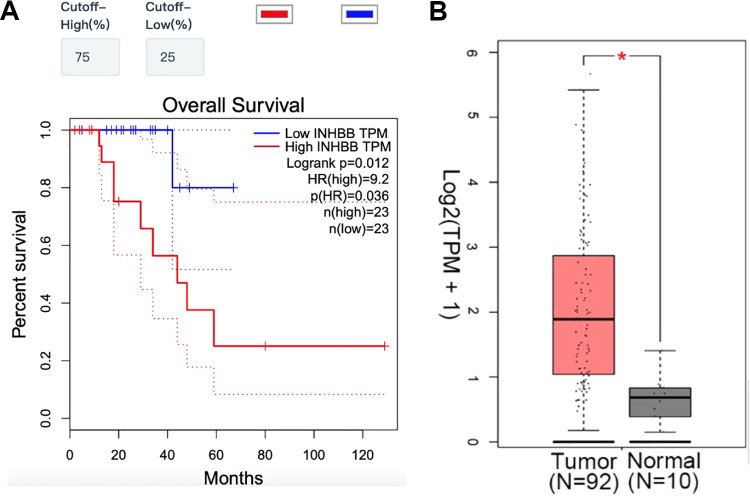
Eighty-eight concentrate genes were discovered from the common DEGs through PPI and cluster analysis. Subsequently, survival analyses on these concentrate genes were further confirmed to assess their effects on the survival of rectal cancer and their expressions between rectal cancer tissues and normal tissues in TCGA dataset by GEPIA (Figure 4A-D). Eight genes were related with the prognosis and 1 of them, INHBB, which was proved to be associated with the prognosis of patients and matched the previous study of common DEGs. Patients’ tissues, which displayed a higher expression of INHBB, had significantly shorter overall survival compared to those with lower expression (P = 0.082). Afterward, INHBB expressed markedly higher in rectal cancer tissues compared with normal tissues compared with normal tissues conforming with our previous study (Figure 4C, D).
Figure 4.
INHBB is biomarker and prognostic factor in rectal cancer. Notes: (A) Rectal cancer tissues display higher expression of INHBB have shorter overall survival compared to those with lower expression (P = 0.012). (B) INHBB expressed higher in rectal cancer tissues compared with normal tissues. Pink/Blue color represents rectal cancer tissues and gray color represents normal rectal tissues. *P < 0.05.
Possibly Related Non-Coding RNAs of Core Genes
To better seek valuable clues for possible mechanisms, we searched for targeted miRNAs and related lncRNAs of INHBB using GCBI (http://www.gcbi.com.cn/). Thus, we constructed interaction networks to investigate associated genes, transcription factors, and non-coding RNAs. Taking INHBB as an example, hsa-miR-335-5p has been validated in several types of research. It can regulate multiple modules of genes in different terms of different type of cancer; further detection of them may be purposeful to the exploration of relevant mechanisms (Figure 5A, B).26,27
Figure 5.
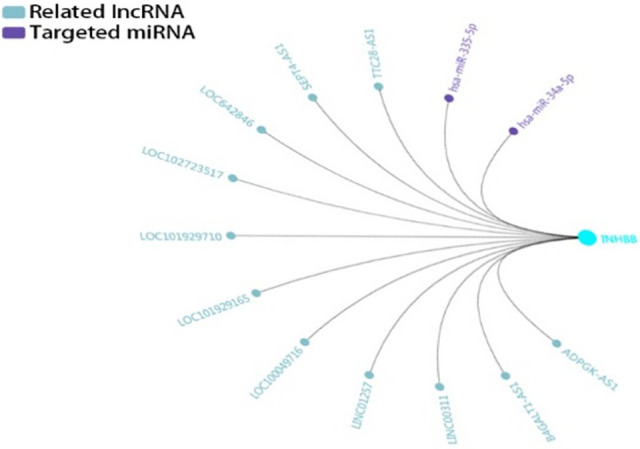
Regulatory networks of INHBB under the regulations of related IncRNAs and targeted miRNAs. Notes: The related lncRNAs and targeted miRNAs of INHBB are predicted by GCBI (http://www.gcbi.com.cn/). Abbreviations: GCBI, Gene-Cloud Biotechnology information.
The Correlation Between INHBB and Other Parameters Such as Gender, Age, Tumor Size, Stage
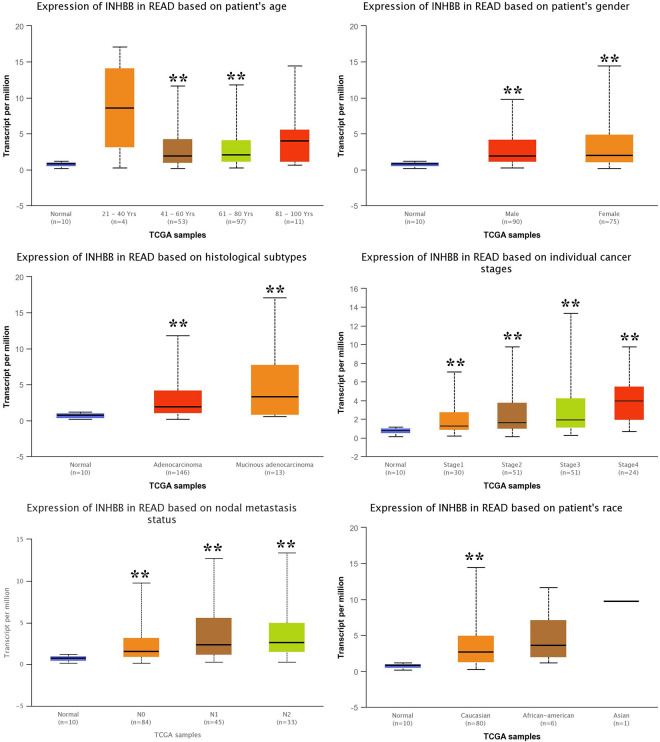
The correlation was assessed in UALCAN. As shown in Figure 6, there was correlation between INHBB and age, gender, histological subtypes, individual cancer stages, nodal metastasis status, race and weight.
Figure 6.
The correlation between INHBB and sex, age, tumor size, stage, etc. N0: No regional lymph node metastasis. N1: Metastases in 1 to 3 axillary lymph nodes. N2: Metastases in 4 to 9 axillary lymph nodes. N3: Metastases in 10 or more axillary lymph nodes. **P < 0.01 vs normal. Note: The correlation between INHBB and sex, age, tumor size, stage, etc are analyzed by UALCAN (http://ualcan.path.uab.edu/).
Discussions
According to the latest statistics, the morbidity and mortality of rectal cancer are both rankings in the top 10 in all type of cancer with increasing incidence rate due to modernization process and changes in diet, especially in many developing countries like China. Current studies generally combine rectal cancer with colon cancer in a lot of analysis and researches. However, there still exists many genetic differences between them. To investigate specific biomarkers and promising targets, a total of 142 upregulated genes and 229 downregulated genes were selected from profiles of GSE15781, GSE20842, and TCGA between the normal rectal tissues and the rectal cancer tissues.
Among the DEGs, 12 clusters, including 88 hub genes, had higher relevance in the PPI network. Prognostic value and association with survival of rectal cancer patients of 1 of the hub genes, INHBB, had been found. Higher expression levels of INHBB was connected to poor prognosis for rectal cancer patients. Further validation in the RNA expression levels in TCGA showed the results were consistent with our previous study.
The GO analysis and KEGG analysis discovered that upregulated DEGs were mainly involved in regulation of sister chromatid segregation. Antimicrobial humoral immune response was mediated by an antimicrobial peptide, morphogenesis of a branching structure, cytokine-cytokine receptor interaction, IL-17 signaling pathway, and the cell cycle, etc. However, the downregulated genes were concentrated in detoxification of copper ion, oxidoreductase activity, acting on the CH-OH group of donors, NAD or NADP as acceptor, bicarbonate transport, nitrogen metabolism, mineral absorption, and pentose and glucuronate interconversions etc.
For INHBB, cytokine belongs to the family of transforming growth factor-β composed by dimeric glycoproteins. Higher expressions existed in several types of late staged cancer like endometrioid carcinoma, oral cancer and intestinal cancer.28-30 Many tumors’ invasion and metastasis mechanisms are considered to be related to INHBB. INHBB can control the expression of EMT-related genes to cause a highly metastatic phenotype and inhibit cell apoptosis in mouse.31,32 In the meanwhile, Jiang L and Hermeking H discovered that upregulation of INHBB in the mouse might indicate the silence of p53-inducible miR-34a/b/c genes resulting in enlarged intestinal crypts, increased tumor grade and poor survival.30 The detailed mechanism seems to be complicated and multifaceted in various ways. However, it apparently could be an incidental and prognostic indicator of rectal cancer.
Conclusion
In summary, a total of 371 DEGs and 12 clusters were investigated. From them, INHBB could be the significant biomarkers for prognosis in rectal cancer. Interaction networks for associated genes, transcription factors, and non-coding RNAs were constructed for further exploration of detailed mechanisms.
Abbreviations
- GEO
Gene Expression Omnibus
- DEGs
differentially expressed genes
- GO
gene ontology
- KEGG
Kyoto Encyclopedia of Genes, and Genomes
- PPI
protein-protein interaction
- MCODE
Molecular Complex Detection
- GCBI
Gene Cloud Biotechnology information
Footnotes
Authors’ Note: Zhili Xu carried out the guarantor of integrity of the entire study, study design, definition of intellectual content, data acquisition, data analysis, statistical analysis and manuscript preparation; Yan Li was dedicated to the literature research; Yiyi Cui was involved in the manuscript editing; Yong Guo carried out the study concepts and manuscript review. All authors have read and approved this article. The datasets used and/or analyzed during the present study are available from the corresponding author upon reasonable request.
Declaration of Conflicting Interests: The author(s) declared no potential conflicts of interest with respect to the research, authorship, and/or publication of this article.
Funding: The author(s) disclosed receipt of the following financial support for the research, authorship, and/or publication of this article: This study was supported by “the 13th Five-year plan” Zhejiang Provincial Key Discipline Construction Project of Traditional Chinese Medicine (Integrated Traditional Chinese and Western Medicine) (2017-XK-A09) and Zhejiang Famous Traditional Chinese Medicine Guoyong Academic Experience Inheritance and Specialist Construction Fund Project (Zhejiang TCM 201728) and Chinese National Natural Science Foundation (81973805).
ORCID iD: Yong Guo  https://orcid.org/0000-0002-9997-0052
References
- 1. Bray F, Ferlay J, Soerjomataram I, Siegel RL, Torre LA, Jemal A. Global cancer statistics 2018: GLOBOCAN estimates of incidence and mortality worldwide for 36 cancers in 185 countries. CA Cancer J Clin. 2018;68(6):394–424. [DOI] [PubMed] [Google Scholar]
- 2. Chao A, Thun MJ, Connell CJ, et al. Meat consumption and risk of colorectal cancer. JAMA. 2005;293:172–182. [DOI] [PubMed] [Google Scholar]
- 3. Chen W, Zheng R, Baade PD, et al. Cancer statistics in China, 2015. CA Cancer J Clin. 2016;66(2):115–132. [DOI] [PubMed] [Google Scholar]
- 4. Yang W, Ma J, Zhou W, et al. Identification of hub genes and outcome in colon cancer based on bioinformatics analysis. Cancer Manag Res. 2018;11:323–338. [DOI] [PMC free article] [PubMed] [Google Scholar]
- 5. Liang B, Li C, Zhao J. Identification of key pathways and genes in colorectal cancer using bioinformatics analysis. Med Oncol. 2016;33(10):111. [DOI] [PubMed] [Google Scholar]
- 6. Guo Y, Bao Y, Ma M, Yang W. Identification of key candidate genes and pathways in colorectal cancer by integrated bioinformatical analysis. Int J Mol Sci. 2017;18(4):722. [DOI] [PMC free article] [PubMed] [Google Scholar]
- 7. Jung Y, Lee S, Choi HS, et al. Clinical validation of colorectal cancer biomarkers identified from bioinformatics analysis of public expression data. Clin Cancer Res. 2011;17(4):700–709. [DOI] [PubMed] [Google Scholar]
- 8. van der Sijp MP, Bastiaannet E, Mesker WE, et al. Differences between colon and rectal cancer in complications, short-term survival and recurrences. Int J Colorectal Dis. 2016;31(10):1683–1691. [DOI] [PMC free article] [PubMed] [Google Scholar]
- 9. Li JN, Zhao L, Wu J, et al. Differences in gene expression profiles and carcinogenesis pathways between colon and rectal cancer. J Dig Dis. 2012;13(1):24–32. [DOI] [PubMed] [Google Scholar]
- 10. Tamas K, Walenkamp AM, de Vries EG, et al. Rectal and colon cancer: not just a different anatomic site. Cancer Treat Rev. 2015;41(8):671–679. [DOI] [PubMed] [Google Scholar]
- 11. Kamps R, Brandão RD, Bosch BJ, et al. Next-generation sequencing in oncology: genetic diagnosis, risk prediction and cancer classification. Int J Mol Sci. 2017;18(2):E308. [DOI] [PMC free article] [PubMed] [Google Scholar]
- 12. Weinstein JN, Collisson EA, Mills GB. The Cancer Genome Atlas Pan-Cancer analysis project. Nat Genet. 2013;45(10):1113–1120. [DOI] [PMC free article] [PubMed] [Google Scholar]
- 13. Clough E, Barrett T. The gene expression omnibus database. Methods Mol Biol. 2016;1418:93–110. [DOI] [PMC free article] [PubMed] [Google Scholar]
- 14. Snipstad K, Fenton CG, Kjaeve J, Cui G, Anderssen E, Paulssen RH. New specific molecular targets for radio-chemotherapy of rectal cancer. Mol Oncol. 2010;4(1):52–64. [DOI] [PMC free article] [PubMed] [Google Scholar]
- 15. Gaedcke J, Grade M, Jung K, et al. Mutated KRAS results in overexpression of DUSP4, a MAP-kinase phosphatase, and SMYD3, a histone methyltransferase, in rectal carcinomas. Genes Chromosomes Cancer. 2010;49(11):1024–1034. [DOI] [PMC free article] [PubMed] [Google Scholar]
- 16. Ritchie ME, Phipson B, Wu D, et al. limma powers differential expression analyses for RNA-sequencing and microarray studies. Nucleic Acids Res. 2015;43(7):e47. [DOI] [PMC free article] [PubMed] [Google Scholar]
- 17. McCarthy JD, Chen Y, Smyth KG. Differential expression analysis of multifactor RNA-Seq experiments with respect to biological variation. Nucleic Acids Res. 2012;40(10):4288–4297. [DOI] [PMC free article] [PubMed] [Google Scholar]
- 18. Kolde R. pheatmap: Pretty Heatmaps. 2019. [Google Scholar]
- 19. Chen H, Boutros PC. VennDiagram: a package for the generation of highly-customizable Venn and Euler diagrams in R. BMC Bioinformatics. 2011;12(1):35. [DOI] [PMC free article] [PubMed] [Google Scholar]
- 20. Bindea G, Mlecnik B, Hackl H, et al. ClueGO: a cytoscape plug-in to decipher functionally grouped gene ontology and pathway annotation networks. Bioinformatics. 2009;25(8):1091–1093. [DOI] [PMC free article] [PubMed] [Google Scholar]
- 21. Shannon P, Markiel A, Ozier O, et al. Cytoscape: a software environment for integrated models of biomolecular interaction networks. Genome Res. 2003;13(11):2498–2504. [DOI] [PMC free article] [PubMed] [Google Scholar]
- 22. Yu G, Wang L, Han Y, He Q ClusterProfiler: an R package for comparing biological themes among gene clusters. OMICS. 2012;16(5):284–287. [DOI] [PMC free article] [PubMed] [Google Scholar]
- 23. Szklarczyk D, Gable AL, Lyon D, et al. STRING v11: protein-protein association networks with increased coverage, supporting functional discovery in genome-wide experimental datasets. Nucleic Acids Res. 2019; 47: D607–D613. [DOI] [PMC free article] [PubMed] [Google Scholar]
- 24. Bader GD, Hogue CW. An automated method for finding molecular complexes in large protein interaction networks. BMC Bioinformatics. 2003;42. [DOI] [PMC free article] [PubMed] [Google Scholar]
- 25. Tang Z, Li C, Kang B, Gao G, Li C, Zhang Z. GEPIA: a web server for cancer and normal gene expression profiling and interactive analyses. Nucleic Acids Res. 2017;45(W1): W98–W102. [DOI] [PMC free article] [PubMed] [Google Scholar]
- 26. Slattery ML, Herrick JS, Mullany LE, et al. Wolff. An evaluation and replication of miRNAs with disease stage and colorectal cancer-specific mortality. Int J Cancer. 2015;137(2):428–438. [DOI] [PMC free article] [PubMed] [Google Scholar]
- 27. Tavazoie SF, Alarcón C, Oskarsson T, et al. Endogenous human microRNAs that suppress breast cancer metastasis. Nature. 2008;451(7175):147–152. [DOI] [PMC free article] [PubMed] [Google Scholar]
- 28. Kita A, Kasamatsu A, Nakashima D, et al. Activin B regulates adhesion, invasiveness, and migratory activities in oral cancer: a potential biomarker for metastasis. J Cancer. 2017;8(11):2033–2041. [DOI] [PMC free article] [PubMed] [Google Scholar]
- 29. Qian Z, Zhang G, Song G, Shi J, Gong L, Mou Y, Han Y. Integrated analysis of genes associated with poor prognosis of patients with colorectal cancer liver metastasis. Oncotarget. 2017;8(15):25500–25512. [DOI] [PMC free article] [PubMed] [Google Scholar]
- 30. Jiang L, Hermeking H. miR-34a and miR-34b/c suppress intestinal tumorigenesis. Cancer Res. 2017;77(10):2746–2758. [DOI] [PubMed] [Google Scholar]
- 31. Balboni AL, Cherukuri P, Ung M, DeCastro AJ, Cheng C, DiRenzo J p53 and ΔNp63α coregulate the transcriptional and cellular response to TGFβ and BMP signals. Mol Cancer Res. 2015;13:732–742. [DOI] [PMC free article] [PubMed] [Google Scholar]
- 32. M’Baye M, Hua G, Khan HA, Yang L. RNAi-mediated knockdown of INHBB increases apoptosis and inhibits steroidogenesis in mouse granulosa cells. J Reprod Dev. 2015;61:391–397. [DOI] [PMC free article] [PubMed] [Google Scholar]


