

Abstract
Aims
Loss-of-function mutations in ANGPTL3 are associated with beneficial effects on lipid and glucose metabolism and reduced risk of coronary artery disease. Vupanorsen (AKCEA-ANGPTL3-L Rx ) is an N-acetyl galactosamine-conjugated antisense oligonucleotide targeted to the liver that selectively inhibits angiopoietin-like 3 (ANGPTL3) protein synthesis.
Methods and results
This was a double-blind, placebo-controlled, dose-ranging, Phase 2 study. Patients (N =105) with fasting triglycerides >150 mg/dL (>1.7 mmol/L), type 2 diabetes, and hepatic steatosis were treated for 6 months with 40 or 80 mg every 4 weeks (Q4W), or 20 mg every week (QW) of vupanorsen, or placebo given subcutaneously. The primary efficacy endpoint was per cent change in fasting triglycerides from baseline at 6 months. Median baseline triglycerides were 2.84 mmol/L (252 mg/dL). Significant reductions in triglycerides of 36%, 53%, 47%, and in ANGPTL3 of 41%, 59%, 56%, were observed in the 40 mg Q4W, 80 mg Q4W, and 20 mg QW groups, respectively, compared with 16% reduction in triglycerides and 8% increase in ANGPTL3 in placebo. Compared with placebo, vupanorsen 80 mg Q4W reduced apolipoprotein C-III (58%), remnant cholesterol (38%), total cholesterol (19%), non-high-density lipoprotein cholesterol (HDL-C; 18%), HDL-C (24%), and apolipoprotein B (9%). There was no improvement in glycaemic parameters, or hepatic fat fraction. Treatment with vupanorsen was not associated with clinically significant changes in platelet counts, and the most common adverse events were those at the injection site, which were generally mild.
Conclusion
Vupanorsen results in a favourable lipid/lipoprotein profile and provides a potential strategy for residual cardiovascular risk reduction.
Keywords: Angiopoietin-like protein 3, Antisense, Vupanorsen, Hypertriglyceridaemia, Cardiovascular disease
Graphical Abstract
Graphical Abstract.

See page 3946 for the editorial comment on this article (doi: 10.1093/eurheartj/ehaa790)
Introduction
Despite significant evidence that low-density lipoprotein cholesterol (LDL-C)-targeted therapies reduce cardiovascular (CV) events, residual CV risk remains high.1 , 2 There is increasing evidence that this residual CV risk is in part related to increased levels of plasma triglycerides and remnant lipoproteins.3–5
Angiopoietin-like protein 3 (ANGPTL3), secreted by the liver, is an inhibitor of lipoprotein lipase (LPL) and endothelial lipase (EL), two key enzymes involved in the metabolism of very-low-density lipoprotein (VLDL) and high-density lipoprotein (HDL), respectively.6 Loss-of-function variants in the ANGPTL3 gene are associated with decreased levels of plasma triglycerides, LDL-C, and HDL cholesterol (HDL-C); reduced risk of coronary artery disease (CAD),7 , 8 and other beneficial metabolic effects, including increased insulin sensitivity and reductions in circulating free fatty acid (FFA) levels.9 Similar reductions in atherogenic lipoprotein levels were achieved in human volunteers by treatment with antisense oligonucleotides (ASO) targeting ANGPTL3 mRNA in the liver10 or with a monoclonal antibody against ANGPTL3.7 In addition, reductions in liver triglyceride content and increases in insulin sensitivity were observed in mice treated with an ASO targeting hepatic ANGPTL3 mRNA.10 Thus, therapeutic reduction of ANGPTL3 levels has the potential to reduce the risk of ASCVD and related metabolic diseases.
Vupanorsen is a second-generation N-acetyl galactosamine (GalNAc3)-modified ASO targeting hepatic ANGPTL3 mRNA. GalNAc3-modified ASOs represent a newer approach in ASO technology by targeting the ASO to the asialoglycoprotein receptor on hepatocytes and providing therapeutic efficacy similar to that of unconjugated ASOs, but with 20- to 30-fold lower dosing, thus reducing systemic exposure.11 This phase 2 study with vupanorsen in patients with hypertriglyceridaemia, type 2 diabetes mellitus (T2DM), and hepatic steatosis was designed to identify the optimal dose and regimen for reducing levels of triglyceride and atherogenic lipoproteins, to evaluate the effect of treatment on glycaemic control and hepatic fat content, and to assess safety and tolerability.
Methods
Detailed methods are presented in the Supplementary material.
Study design and population
This multicentre, randomized, double-blind, placebo-controlled, dose-ranging, phase 2 study enrolled patients who had elevated fasting plasma triglyceride levels (>150 mg/dL or >1.7 mmol/L), T2DM [glycosylated haemoglobin (HbA1c) >6.5% and ≤10%], hepatic steatosis [hepatic fat fraction (HFF) >8% by magnetic resonance imagining (MRI)], and body mass index (BMI) between 27 and 40 kg/m2. Patients were randomized to one of three cohorts and within each cohort in a 3:1 ratio to receive vupanorsen or placebo administered subcutaneously for 6 months at doses of 40 or 80 mg every 4 weeks (Q4W) or 20 mg every week (QW) (Supplementary material online, Figure S1).
The primary efficacy endpoint was the per cent change in fasting triglyceride level from baseline to the primary analysis timepoint at 6 months of exposure (Week 25 for Q4W dosing, Week 27 for QW dosing) in each vupanorsen group compared with the pooled placebo group. Pairwise comparison between each vupanorsen group and pooled placebo group was performed using an ANCOVA model including treatment group as a fixed factor and log-transformed baseline as a covariate. Unranked key secondary efficacy/exploratory endpoints included a change in the following fasting lipids/lipoproteins: ANGPTL3, total cholesterol (TC), LDL-C, HDL-C, VLDL cholesterol (VLDL-C), remnant cholesterol, non-HDL-C, apolipoprotein (apo) B, apoC-III, apoAI, lipoprotein(a), and FFAs; glycaemic parameters: HbA1c, Homeostatic Model Assessment of Insulin Resistance (HOMA-IR), fructosamine, and glycated albumin; parameters related to hepatic steatosis: HFF as assessed by MRI-proton density fat fraction, fatty liver index (FLI), alanine aminotransferase (ALT), and aspartate aminotransferase (AST), and biomarkers of inflammation: high-sensitivity C-reactive protein (hsCRP).
Safety monitoring and stopping rules related to platelet count, renal function, and liver function were pre-specified in the protocol, including threshold limits (Supplementary material online). Platelet count was monitored every 2 weeks by central and local laboratories simultaneously. An independent Data and Safety Monitoring Board oversaw the study.
Results
Patient population
In total, 525 patients were screened, of whom 105 were randomized to receive either vupanorsen or placebo (Supplementary material online, Figure S2 and Table S3). The mean [± standard deviation (SD)] duration of treatment was 134 ± 41 days (median, 141) and 150 ± 35 days (median, 142), and mean compliance (per cent of total scheduled volume of drug received) was 96.6% and 96.0% for pooled vupanorsen and placebo groups, respectively. Ninety-one patients (87%) completed treatment.
Demographics and baseline characteristics of patients were generally similar across treatment groups (Supplementary material online, Table S1): 93% of patients were <65 years of age, 47% were female, and 62% were Hispanic (with significantly more Hispanics in the placebo group). Baseline median triglyceride level was 2.84 mmol/L (252 mg/dL), and other mean baseline parameters were also elevated: remnant cholesterol (and VLDL-C) (1.24 mmol/L), non-HDL-C (3.93 mmol/L), HbA1c (8.2%), HOMA-IR (11.1), HFF (17.6%), FLI (82.5%), and BMI (32 kg/m2).
Mean per cent change in triglyceride, ANGPTL3 and other lipid/lipoprotein levels
At the primary analysis timepoint of 6 months, significant, dose-dependent reductions in fasting triglyceride levels from baseline were observed in all the vupanorsen groups, with mean decreases of 36% at 40 mg Q4W, 53% at 80 mg Q4W, and 47% at 20 mg QW compared with a 16% decrease in the pooled placebo group (P < 0.0001–0.03 vs. placebo) (Figure 1A and Table 1). Additionally, a post hoc analysis revealed that at Month 6, a significant proportion of patients treated with vupanorsen achieved normal triglyceride levels of <150 mg/dL (<1.7 mmol/L). Proportions were 35%, 58%, and 39% in 40 mg Q4W, 80 mg Q4W, and 20 mg QW groups, respectively, compared with 11% in the placebo group (P = 0.0111–0.0002 vs. placebo).
Figure 1.
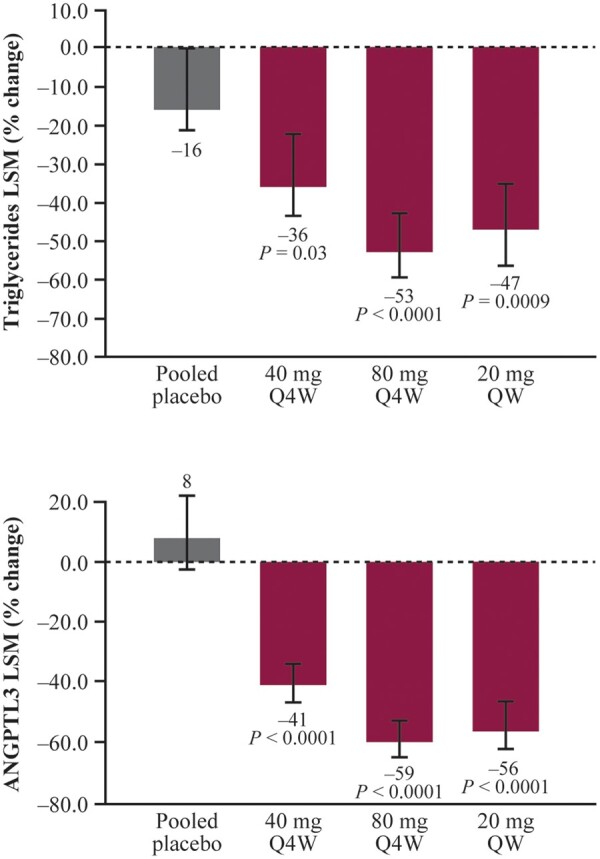
Per cent change in triglycerides (A) and ANGPTL3 (B) at the primary analysis timepoint. Error bars denote the 95% CI. Primary analysis timepoint: week 25 (Q4W dosing) and week 27 (QW dosing). CI, confidence interval; LSM, least-squares method; Q4W, every 4 weeks; QW, every week.
Table 1.
Per cent change from baseline in angiopoietin-like 3, lipids, and lipoproteins at the primary analysis timepoint
| Placebo Pooled | Vupanorsen |
|||
|---|---|---|---|---|
| N = 27 | 40 mg Q4W N = 26 | 80 mg Q4W N = 26 | 20 mg QW N = 26 | |
| Triglycerides | ||||
| PAT/baseline, LSM (95% CI) | 0.84 (0.71–1.00) | 0.64 (0.53–0.77) | 0.47 (0.40–0.57) | 0.53 (0.43–0.65) |
| Per cent change from baseline | –16 | –36 | –53 | –47 |
| PAT/baseline, LSM (95% CI) vs. placebo | 0.76 (0.59–0.98) | 0.56 (0.44–0.72) | 0.63 (0.48–0.83) | |
| Per cent change from baseline vs. placebo | –24 | –44 | –37 | |
| P-value | 0.0343 | <0.0001 | 0.0009 | |
| Angiopoietin-like protein 3 | ||||
| PAT/baseline, LSM (95% CI) | 1.08 (0.95–1.23) | 0.59 (0.52–0.68) | 0.41 (0.36–0.47) | 0.44 (0.38–0.53) |
| Per cent change from baseline | +8 | –41 | –59 | –56 |
| PAT/baseline, LSM (95% CI) vs. placebo | 0.55 (0.46–0.66) | 0.38 (0.32–0.46) | 0.41 (0.33–0.51) | |
| Per cent change from baseline vs. placebo | –45 | –62 | –59 | |
| P-value | <0.0001 | <0.0001 | <0.0001 | |
| ApoC-III | ||||
| PAT/baseline, LSM (95% CI) | 0.94 (0.78–1.14) | 0.60 (0.49–0.73) | 0.39 (0.32–0.48) | 0.48 (0.38–0.61) |
| Per cent change from baseline | –6 | –40 | –61 | –52 |
| PAT/baseline, LSM (95% CI) vs. placebo | 0.64 (0.49–0.84) | 0.42 (0.32–0.55) | 0.51 (0.38–0.69) | |
| Per cent change from baseline vs. placebo | –36 | –58 | –49 | |
| P-value | 0.0018 | <0.0001 | <0.0001 | |
| Remnant cholesterola | ||||
| PAT/baseline, LSM (95% CI) | 0.86 (0.74–1.00) | 0.65 (0.55–0.77) | 0.53 (0.45–0.63) | 0.60 (0.50–0.72) |
| Per cent change from baseline | –14 | –35 | –47 | –40 |
| PAT/baseline, LSM (95% CI) vs. placebo | 0.76 (0.60–0.95) | 0.62 (0.49–0.77) | 0.70 (0.55–0.88) | |
| Per cent change from baseline vs. placebo | –24 | –38 | –30 | |
| P-value | <0.0001 | <0.0001 | 0.0033 | |
| Non-HDL-C | ||||
| PAT/baseline, LSM (95% CI) | 0.96 (0.89–1.03) | 0.87 (0.80–0.93) | 0.79 (0.73–0.85) | 0.78 (0.71–0.85) |
| Percent change from baseline | –4 | –13 | –21 | –22 |
| PAT/baseline, LSM (95% CI) vs. placebo | 0.90 (0.82–1.0) | 0.82 (0.74–0.91) | 0.81 (0.72–0.91) | |
| Per cent change from baseline vs. placebo | –10 | –18 | –19 | |
| P-value | 0.0523 | 0.0002 | 0.0004 | |
| Total cholesterol | ||||
| PAT/baseline, LSM (95% CI) | 0.98 (0.92–1.04) | 0.89 (0.84–0.95) | 0.79 (0.74–0.84) | 0.81 (0.75–0.87) |
| Per cent change from baseline | –2 | –11 | –21 | –19 |
| PAT/baseline, LSM (95% CI) vs. placebo | 0.91 (0.84–0.99) | 0.81 (0.74–0.88) | 0.83 (0.75–0.91) | |
| Per cent change from baseline vs. placebo | –9 | –19 | –17 | |
| P-value | 0.0309 | <0.0001 | <0.0001 | |
| LDL-C (precipitation) | ||||
| PAT/baseline, LSM (95% CI) | 1.00 (0.92–1.09) | 1.06 (0.96–1.17) | 0.93 (0.85–1.02) | 0.88 (0.79–0.97) |
| Per cent change from baseline | 0 | +6 | –7 | –12 |
| PAT/baseline, LSM (95% CI) vs. placebo | 1.06 (0.93–1.21) | 0.93 (0.82–1.06) | 0.88 (0.76–1.01) | |
| Per cent change from baseline vs. placebo | +6 | –7 | –12 | |
| P-value | 0.4016 | 0.2589 | 0.0616 | |
| ApoB | ||||
| PAT/baseline, LSM (95% CI) | 0.97 (0.91–1.03) | 0.93 (0.88–1.00) | 0.88 (0.83–0.94) | 0.90 (0.83–0.97) |
| Per cent change from baseline | –3 | –7 | –12 | –10 |
| PAT/baseline, LSM (95% CI) vs. placebo | 0.97 (0.88–1.05) | 0.91 (0.84–1.00) | 0.93 (0.84–1.02) | |
| Per cent change from baseline vs. placebo | –3 | –9 | –7 | |
| P-value | 0.4204 | 0.0441 | 0.1324 | |
| HDL-C | ||||
| PAT/baseline, LSM (95% CI) | 1.07 (0.98, 1.16) | 0.98 (0.90–1.08) | 0.82 (0.75–0.89) | 0.96 (0.87–1.06) |
| Per cent change from baseline | +7 | –2 | –18 | –4 |
| PAT/baseline, LSM (95% CI) vs. placebo | 0.92 (0.82–1.04) | 0.76 (0.68–0.86) | 0.76 (0.68–0.86) | |
| Per cent change from baseline vs. placebo | –8 | –24 | –10 | |
| P-value | 0.1918 | <0.0001 | 0.1132 | |
| Free fatty acids | ||||
| PAT/baseline, LSM (95% CI) | 0.89 (0.76–1.04) | 0.88 (0.74–1.03) | 0.81 (0.69–0.96) | 0.87 (0.71–1.07) |
| Per cent change from baseline | –11 | –12 | –19 | –13 |
| PAT/baseline, LSM (95% CI) vs. placebo | 0.98 (0.78–1.23) | 0.92 (0.73–1.15) | 0.98 (0.76–1.26) | |
| Per cent change from baseline vs. placebo | –2 | –8 | –2 | |
| P-value | 0.8845 | 0.4413 | 0.8757 | |
PAT was Week 25 (Q4W dosing) and Week 27 (QW dosing). For analysis of per cent change, pairwise comparison of log PAT/baseline between each vupanorsen group and pooled placebo group was performed using an ANCOVA. The ANCOVA models included treatment group as a fixed factor and log-transformed baseline as a covariate. The difference in LSM is the estimate of the difference in LSM of log (PAT/baseline) between each vupanorsen group and pooled placebo group back-transformed to its original scale, which provides the ratio of the geometric means of PAT/baseline.
ANCOVA, analysis of covariance; Apo, apolipoprotein; C, cholesterol; CI, confidence interval; HDL, high-density lipoprotein; LDL, low-density lipoprotein; LSM, least-squares mean; PAT, primary analysis timepoint; Q4W, every 4 weeks; QW, every week.
Remnant cholesterol formula: TC – (LDL-C + HDL-C). VLDL-C values were also calculated using formula: Triglycerides/2.2 (in mmol/L) and gave nearly identical values to the remnant cholesterol values shown in the Table.
Significant reductions in per cent change from baseline to the primary analysis timepoint in ANGPTL3 and several lipids/lipoproteins were observed for vupanorsen compared with placebo (Figure 1B and Table 1): in the 80 mg Q4W group, ANGPTL3 was reduced by 62%, apoC-III by 58%, remnant cholesterol (and VLDL-C) by 38%, non-HDL-C by 18%, TC by 19%, apoB by 9%, and HDL-C by 24%. A numerical decrease in LDL-C by 12% was observed in 20 mg QW group. There was no effect on FFA or lipoprotein(a) levels (Table 1 and Supplementary material online, Table S2).
Other metabolic parameters
There were no changes from baseline to the primary analysis timepoint in HbA1c, HOMA-IR (Table 2), or other glycaemic parameters measured. Overall, no changes in HFF and FLI were observed; however, compared with placebo, the vupanorsen 80 mg Q4W group showed an absolute mean increase of 4% from baseline in HFF (P = 0.0230) and a trend towards absolute decrease in mean FLI (–5.7%; P = 0.0943) (Table 2). Transaminase levels showed small mean absolute increases of up to 14.8 U/L (P = 0.0012) and of up to 8.4 U/L (P = 0.0020) for ALT and AST, respectively, in the 80 mg Q4W group compared with placebo (Table 2). Small numerical decreases in hsCRP levels were observed (Table 2).
Table 2.
Change from baseline in glycaemic and hepatic steatosis parameters, and high-sensitivity C-reactive protein at the primary analysis timepoint
| Placebo pooled, N = 27 | Vupanorsen |
|||
|---|---|---|---|---|
| 40 mg Q4W, N = 26 | 80 mg Q4W, N = 26 | 20 mg QW, N = 26 | ||
| HbA1c (%) | ||||
| Change from baseline, LSM (95% CI) | 0.19 (–0.27, 0.64) | –0.09 (–0.56, 0.37) | 0.26 (–0.22, 0.75) | 0.35 (–0.18, 0.87) |
| Change from baseline, LSM (95% CI) vs. placebo | –0.28 (–0.94, 0.38) | 0.08 (–0.59, 0.75) | 0.16 (–0.54, 0.86) | |
| P-value | 0.3995 | 0.8155 | 0.6466 | |
| HOMA-IRa | ||||
| Change from baseline, LSM (95% CI) | –0.119 (–3.47, 3.24) | –1.914 (–5.50, 1.67) | 0.141 (–3.52, 3.80) | 2.013 (–2.41, 6.44) |
| Change from baseline, LSM (95% CI) vs. placebo | –1.794 (–6.72, 3.14) | 0.260 (–4.68, 5.20) | 2.133 (–3.44, 7.70) | |
| P-value | 0.4710 | 0.9169 | 0.4484 | |
| Hepatic fat fraction (MRI-PDFF; %) | ||||
| Change from baseline, LSM (95% CI) | –1.69 (–4.09, 0.71) | –0.71 (–3.21, 1.78) | 2.39 (–0.16, 4.94) | –0.12 (–2.87, 2.64) |
| Change from baseline, LSM (95% CI) vs. placebo | 0.98 (–2.48, 4.44) | 4.09 (0.58, 7.59) | 1.57 (–2.10, 5.25) | |
| P-value | 0.5752 | 0.0230 | 0.3965 | |
| Fatty liver indexb | ||||
| Change from baseline, LSM (95% CI) | –3.50 (–8.21, 1.22) | –6.08 (–11.08, –1.09) | –9.21 (–13.99, –4.44) | –8.07 (–13.06, –3.07) |
| Change from baseline, LSM (95% CI) vs. placebo | –2.59 (–9.49, 4.31) | –5.71 (–12.43, 1.00) | –4.57 (–11.45, 2.32) | |
| P-value | 0.4583 | 0.0943 | 0.1909 | |
| Alanine aminotransferase (U/L) | ||||
| Change from baseline, LSM (95% CI) | –2.2 (–8.48, 3.99) | 4.8 (–1.75, 11.38) | 12.5 (6.30, 18.79) | 6.6 (–0.06, 13.32) |
| Change from baseline, LSM (95% CI) vs. placebo | 7.1 (–2.10, 16.22) | 14.8 (5.98, 23.59) | 8.9 (–0.36, 18.11) | |
| P-value | 0.1294 | 0.0012 | 0.0594 | |
| Aspartate aminotransferase (U/L) | ||||
| Change from baseline, LSM (95% CI) | –1.8 (–5.50, 1.93) | 3.2 (–0.71, 7.12) | 6.7 (2.93, 10.37) | 4.7 (0.77, 8.71) |
| Change from baseline, LSM (95% CI) vs. placebo | 5.0 (–0.47, 10.45) | 8.4 (3.17, 13.70) | 6.5 (1.05, 12.00) | |
| P-value | 0.0730 | 0.0020 | 0.0200 | |
| hsCRP (mg/L) | ||||
| Change from baseline, LSM (95% CI) | 0.04 (−1.08, 1.16) | −0.93 (−2.12, 027) | −0.60 (−1.74, 0.54) | −0.51 (−1.73, 0.71) |
| Change from baseline, LSM (95% CI) vs. placebo | −0.97 (−2.61, 0.68) | −0.64 (−2.24, 0.96) | −0.55 (−2.21, 1.11) | |
| P-value | 0.2467 | 0.4296 | 0.5106 | |
Primary analysis timepoint was Week 25 (Q4W dosing) and Week 27 (QW dosing). The analysis of covariance model included fixed effects for treatment and baseline as the covariate.
CI, confidence interval; HbA1c, glycosylated haemoglobin; HOMA-IR, Homeostatic Model Assessment of Insulin Resistance; hsCRP, high-sensitivity C-reactive protein; LSM, least-squares mean; MRI, magnetic resonance imaging; PDFF, proton density fat fraction; Q4W, every 4 weeks; QW, every week.
HOMA-IR = Insulin μIU/mL × glucose (mg/dL)/405.
Safety and tolerability
Adverse events (AEs) occurred in 83% of patients receiving vupanorsen and 59% of patients receiving placebo during the treatment period; the events were mild to moderate, except for one severe event of muscle strain. The most frequent AEs in patients treated with vupanorsen were injection-site pruritus (14%) and injection-site erythema (12%); 16 (20.5%) patients experienced at least one AE at the injection site, and 12 out of these patients reported only mild events. One unrelated serious AE of diverticulitis occurred in the 20 mg QW group. Six patients receiving vupanorsen discontinued treatment due to AEs: four due to AE at the injection site (one patient each in the 40 mg Q4W and 80 mg Q4W groups, and two in the 20 mg QW group); one due to elevated transaminases (20 mg QW group), and one due to an unrelated event of dehydration/pre-renal failure (80 mg Q4W group) compared with none receiving placebo. One patient receiving vupanorsen experienced a flu-like reaction (arthralgia) (Table 3).
Table 3.
Adverse events and laboratory measurements during the treatment perioda
| Pooled placebo, N = 27 | Vupanorsen |
||||
|---|---|---|---|---|---|
| 40 mg Q4W, N = 26 | 80 mg Q4W, N = 26 | 20 mg QW, N = 26 | Pooled, N = 78 | ||
| Adverse events | |||||
| Any adverse event | 16 (59.3%) | 19 (73.1%) | 23 (88.5) | 23 (88.5) | 65 (83.3%) |
| Mild | 7 (25.9%) | 7 (25.9%) | 7 (25.9) | 13 (50.0) | 37 (47.4%) |
| Moderate | 9 (33.3%) | 7 (26.9%) | 10 (38.5) | 10 (38.5) | 27 (34.6) |
| Severe | 0 | 1 (3.8%) | 0 | 0 | 1 (1.3%) |
| Serious adverse event | 0 | 0 | 0 | 1 (3.8%) | 1 (1.3%) |
| Adverse event leading to treatment discontinuation | 0 | 1 (3.8%) | 2 (7.7%) | 3 (11.5%) | 6 (7.7%) |
| Adverse event leading to death | 0 | 0 | 0 | 0 | 0 |
| Adverse event at the injection site | 0 | 3 (11.5%) | 10 (38.5%) | 3 (11.5%) | 16 (20.5%) |
| Flu-like reactionsb | 0 | 1 (3.8%) | 0 | 0 | 1 (3.8%) |
| Laboratory measurementsc | |||||
| Platelet count | |||||
| <140 000 and ≥100 000/mm3 | 1 (3.8%) | 0 | 0 | 2 (7.7%) | 2 (2.6%) |
| <100 000/mm3 | 0 | 0 | 0 | 0 | 0 |
| ALT level >3× ULN and ≤ 5× ULN | 0 | 0 | 0 | 2 (7.7%) | 2 (2.6%) |
| AST level >3× ULN and ≤ 5× ULN | 1 (3.7) | 0 | 0 | 0 | 0 |
| Total bilirubin level >2× ULN | 0 | 0 | 0 | 0 | 0 |
| Alkaline phosphatase level >2× ULN | 0 | 0 | 0 | 0 | 0 |
| eGFR by CKD-EPI <45 mL/min/1.73m2 | 0 | 0 | 1 (3.8%) | 0 | 1 (1.3%) |
| eGFR by CKD-EPI >25% decrease from baseline | 0 | 0 | 1 (3.8%) | 1 (3.8) | 2 (2.6%) |
| Urine albumin/creatinine ratio >165 mg/g | 2 (7.4%) | 0 | 4 (15.4%) | 3 (11.5%) | 7 (9.0%) |
| Urine protein/creatinine ratio >325 mg/g | 3 (11.1%) | 2 (7.7%) | 4 (15.4%) | 3 (11.5%) | 9 (11.5%) |
| New onset of haematuria (≥5 RBC/hpf) | 6 (22.2%) | 4 (15.4%) | 1 (3.8%) | 0 | 5 (6.4%) |
For categorical variables, n (%) is presented.
ALT, alanine aminotransferase; AST, aspartate aminotransferase; CKD-EPI, Chronic Kidney Disease Epidemiology Collaboration formula; eGFR, estimated glomerular filtration rate; Q4W, every 4 weeks; QW, every week; RBC/hpf, red blood cells per high power field; ULN, upper limit of normal.
Treatment period was defined as the period from the first dose through one dosing interval after the last dose.
Flu-like reactions are defined as the following adverse events starting on the day of injection or the next day: influenza-like illness, chills, myalgia, arthralgia, pyrexia, feeling hot, or body temperature increased.
Values were confirmed by a second measurement within 7 days. If a second measurement was not available, the result was considered confirmed.
No patient experienced a confirmed platelet level <100 000/mm3, and no dose- or time-dependent effects on platelet counts were observed (Table 3 and Figure 2). Two patients receiving vupanorsen and one receiving placebo met the pre-specified liver monitoring rule of 3–5 times the upper limit of normal (ULN) increase in ALT and AST, respectively. No increases >2× ULN in total bilirubin or alkaline phosphatase levels were observed, and no patient met any of the liver stopping rules. Comparable proportions of patients receiving vupanorsen (18%) or placebo (26%) met pre-specified renal monitoring rules. No patient met any of the renal stopping rules.
Figure 2.

Platelet count results over time by treatment group (central laboratory). BL, baseline; Q4W, every 4 weeks; QW, every week.
Discussion
This study shows that targeting of hepatic ANGPTL3 mRNA with vupanorsen in patients with T2DM, hepatic steatosis, and hypertriglyceridaemia results in decreased levels of triglycerides and apoB-containing atherogenic lipoproteins as evidenced by decreased levels of TC, remnant cholesterol (and VLDL-C), non-HDL-C, and apoB, with a trend towards decreases in LDL-C. In addition, HDL-C levels were reduced. This lipid/lipoprotein profile is consistent with, but not as potent as, that reported for individuals with familial combined hypolipidaemia (FHBL2) with loss-of-function mutations in the ANGPTL3 gene.7 , 9 , 12 Human genetic and epidemiological studies demonstrated that heterozygous carriers of ANGPTL3 loss-of-function mutations had 34–39% lower risk of CAD, and individuals with ANGPTL3 plasma concentrations in the lowest tertile of the population had 35% reductions in risk of myocardial infarction.7 , 8 These observations, together with reports showing a decreased extent of atherosclerosis in preclinical models,7 , 10 make ANGPTL3 a new attractive therapeutic target for CAD.
Although a prior non-GalNAc ANGPTL3 ASO was studied in phase 1 at doses up to 400 mg weekly13 vupanorsen has ∼30-fold higher potency and can be administered at a markedly lower dose at a less frequent dosing interval. Vupanorsen also differs from the ANGPTL3-directed monoclonal antibody evinacumab, in that the site of inhibition is in the hepatocyte, vs. the plasma with evinacumab. Whether this will result in differences in efficacy is not currently known. Finally, the optimal efficacy of evinacumab appears to be with high intravenous doses (15–20 mg/kg) or weekly subcutaneous injections,14 which has disadvantages in compliance, cost, and the inability to dose by self-administration.
A reduction in HDL-C levels is a well-known phenomenon reflecting an increase in activity of EL due to ANGPTL3 inhibition and is not expected to modify the risk for CAD because a large Mendelian randomization study demonstrated that variants in the EL gene do not affect risk of myocardial infarction.15
Triglyceride-rich lipoproteins (TRLs) have been proposed to be on the causal pathway of atherosclerosis,5 and elevated triglyceride and VLDL levels have long been associated with a residual CV risk in patients with CAD, even in populations treated with available LDL-C-lowering therapies.3 , 4 However, in general, lowering triglyceride levels has failed to provide additional benefit beyond statin therapy.16 Although the REDUCE-IT trial with eicosapentaenoic acid (Vascepa®) showed significant reduction in CV events, this effect did not appear to be mediated by a lowering of triglyceride levels alone, as a decrease in triglycerides of only 18.3% was reported.17 Thus, a more potent triglyceride-lowering therapy such as vupanorsen could produce additional cardioprotective benefits, particularly with the reduction in atherogenic remnant cholesterol and non-HDL-C levels. Notably, unlike other triglyceride-lowering drugs, vupanorsen was associated with a reduction in apoB levels and no increases in LDL-C levels. Future studies will better define the place in therapy for vupanorsen relative to other adjunctive lipid therapies beyond statins and ezetimibe.
Homozygotes for loss-of-function mutations in the ANGPTL3 gene showed additional metabolic benefits, including lower plasma FFA levels and higher insulin sensitivity.9 It has been hypothesized that ANGPTL3 deficiency is associated with increased uptake of FFA into oxidative tissue, leading to decreased uptake of FFA to the liver and white adipose tissue, resulting in decreased production of triglycerides and VLDL and increased insulin-mediated glucose uptake, respectively.18 In this study, we did not observe any effect of vupanorsen on FFA levels or glycaemic parameters, despite reductions in ANGPTL3 levels by up to 62%. This is consistent with the observations that ANGPTL3 does not affect FFA levels or insulin sensitivity in a concentration-dependent manner, because only its complete deficiency appears to show an effect on these pathways,9 and that a threshold reduction in plasma ANGPTL3 levels is required to affect plasma lipid/lipoprotein levels.12 We also did not observe any effect of vupanorsen on hepatic steatosis. In preclinical studies, when ANGPTL3 levels were lowered by 90% by Angptl3 ASO, we saw reductions in liver triglyceride content in mouse models of diet-induced obesity and microsomal triglyceride transfer protein-induced steatosis.10 Whether the lack of effect on hepatic steatosis in this study was due to the disease characteristics of the patients, specifically diabetes, hypertriglyceridaemia, and marked baseline hepatic steatosis (mean baseline HFF, 17.6%), or to ANGPTL3 levels reduced by up to only 62% is unknown.
Although apoC-III levels were also reduced in response to reductions of ANGPTL3 with vupanorsen, they are known to correlate with triglyceride levels, raising the issue of cause and effect. It is unlikely that reductions in apoC-III levels observed in this study were solely responsible—or were even a major factor—for lowering of TRL levels. Inhibition of hepatic ANGPTL3 mRNA by an ANGPTL3 ASO inhibited hepatic VLDL-triglyceride secretion and lowered plasma triglyceride levels in apoC-III-deficient mice, demonstrating that targeting hepatic ANGPTL3 can reduce plasma triglycerides independently of apoC-III.10
Treatment with vupanorsen was not associated with adverse effect on platelet counts, AEs at the injection site were generally mild, and only one patient experienced flu-like reaction.
Limitations of this study include its small size, low proportion of patients with CAD, and that only approximately half of the population was receiving a statin. This current study had narrow inclusion criteria to answer three aims, effect of ANGPTL3 on atherogenic lipids, liver fat, and HbA1c. Further study is needed to assess efficacy and safety of higher vupanorsen doses that can maximize target engagement in a population selected with elevated non-HDL-C and elevated triglycerides who are receiving treatment with a statin. Higher doses of vupanorsen can potentially more closely recapitulate the lipid profile among individuals with complete loss-of-function ANGPTL3 mutations.
In conclusion, our results indicate that lowering of triglyceride and atherogenic TRLs by vupanorsen may provide a new strategy for reducing CV risk.
Supplementary Material
Acknowledgements
We thank Tracy Reigle and Wanda Sullivan from Ionis Pharmaceuticals for generation of the artwork.
Funding
This work was supported by Ionis Pharmaceuticals, Inc, and Akcea Therapeutics, Inc.
Conflict of interest: D.G. has consulting agreements with Akcea, Regeneron, Lilly, Arrowhead, Allergan, Amryt, Amgen, Sanofi, and the National Research Council of Canada, and research contracts for clinical trials targeting triglycerides with Akcea, Ionis, Arrowhead, Acasti, Kowa, Regeneron, and the National Research Council of Canada. He has no financial interest in any pharma or biotech company, S.J.B. is a consultant to Akcea Therapeutics, E.K.P., E.H., J.K., V.J.B., A.L.F., P.P., and L.St.L.D are employees of Akcea Therapeutics, R.S.G. and ST are employees of Ionis Pharmaceuticals, W.S. and J.L.W. are consultants to Ionis Pharmaceuticals. S.T. and J.L.W. are co-inventors and receive royalties from patents owned by UCSD on oxidation-specific antibodies and of biomarkers related to oxidized lipoproteins and are co-founders and have an equity interest in Oxitope, Inc. and its affiliates (‘Oxitope’) as well as in Kleanthi Diagnostics, LLC (‘Kleanthi’). Although these relationships have been identified for conflict of interest management based on the overall scope of the project and its potential benefit to Oxitope and Kleanthi, the research findings included in this particular publication may not necessarily relate to the interests of Oxitope and Kleanthi. The terms of this arrangement have been reviewed and approved by the University of California, San Diego in accordance with its conflict of interest policies. S.T. has a dual appointment at UCSD and Ionis Pharmaceuticals.
Contributor Information
Daniel Gaudet, Department of Medicine, Université de Montréal and Ecogene-21 Clinical Research Centre, Chicoutimi, QC, Canada.
Ewa Karwatowska-Prokopczuk, Akcea Therapeutics, Inc, Boston, MA, USA.
Seth J Baum, Excel Medical Clinical Trials, LLC, Boca Raton, FL, USA.
Eunju Hurh, Akcea Therapeutics, Inc, Boston, MA, USA.
Joyce Kingsbury, Akcea Therapeutics, Inc, Boston, MA, USA.
Victoria J Bartlett, Akcea Therapeutics, Inc, Boston, MA, USA.
Amparo L Figueroa, Akcea Therapeutics, Inc, Boston, MA, USA.
Philip Piscitelli, Akcea Therapeutics, Inc, Boston, MA, USA.
Walter Singleton, Ionis Pharmaceuticals, Inc, Carlsbad, CA, USA.
Joseph L Witztum, Department of Medicine, University California San Diego, La Jolla, CA, USA.
Richard S Geary, Ionis Pharmaceuticals, Inc, Carlsbad, CA, USA.
Sotirios Tsimikas, Ionis Pharmaceuticals, Inc, Carlsbad, CA, USA; Department of Medicine, University California San Diego, La Jolla, CA, USA.
Louis St. L O'Dea, Akcea Therapeutics, Inc, Boston, MA, USA.
References
- 1. Cannon CP, Steinberg BA, Murphy SA, Mega JL, Braunwald E. Meta-analysis of cardiovascular outcomes trials comparing intensive versus moderate statin therapy. J Am Coll Cardiol 2006;48:438–445. [DOI] [PubMed] [Google Scholar]
- 2. Sabatine MS, Giugliano RP, Keech AC, Honarpour N, Wiviott SD, Murphy SA, Kuder JF, Wang H, Liu T, Wasserman SM, Sever PS, Pedersen TR, FOURIER Steering Committee and Investigators. Evolocumab and clinical outcomes in patients with cardiovascular disease. N Engl J Med 2017;376:1713–1722. [DOI] [PubMed] [Google Scholar]
- 3. Miller M, Cannon CP, Murphy SA, Qin J, Ray KK, Braunwald E. Impact of triglyceride levels beyond low-density lipoprotein cholesterol after acute coronary syndrome in the PROVE-IT TIMI 22 trial. J Am Coll Cardiol 2008;51:724–730. [DOI] [PubMed] [Google Scholar]
- 4. Nichols GA, Philip S, Reynolds K, Granowitz CB, Fazio S. Increased cardiovascular risk in hypertriglyceridemic patients with statin-controlled LDL cholesterol. J Clin Endocrinol Metab 2018;103:3019–3027. [DOI] [PubMed] [Google Scholar]
- 5. Nordestgaard BG. Triglyceride-rich lipoproteins and atherosclerotic cardiovascular disease: new insights from epidemiology, genetics, and biology. Circ Res 2016;118:547–563. [DOI] [PubMed] [Google Scholar]
- 6. Kersten S. Angiopoietin-like3 in lipoprotein metabolism. Nat Rev Endocrinol 2017;13:731–739. [DOI] [PubMed] [Google Scholar]
- 7. Dewey FE, Gusarova V, Dunbar RL, O’Dushlaine C, Schurmann C, Gottesman O, McCarthy S, Van Hout CV, Bruse S, Dansky HM, Leader JB, Murray MF, Ritchie MD, Kirchner HL, Habegger L, Lopez A, Penn J, Zhao A, Shao W, Stahl N, Murphy AJ, Hamon S, Bouzelmat A, Zhang R, Shumel B, Pordy R, Gipe D, Herman GA, Sheu WHH, Lee I-T, Liang K-W, Guo X, Rotter JI, Chen Y-DI, Kraus WE, Shah SH, Damrauer S, Small A, Rader DJ, Wulff AB, Nordestgaard BG, Tybjærg-Hansen A, van den Hoek AM, Princen HMG, Ledbetter DH, Carey DJ, Overton JD, Reid JG, Sasiela WJ, Banerjee P, Shuldiner AR, Borecki IB, Teslovich TM, Yancopoulos GD, Mellis SJ, Gromada J, Baras A. Genetic and pharmacologic inactivation of ANGPTL3 and cardiovascular disease. N Engl J Med 2017;377:211–221. [DOI] [PMC free article] [PubMed] [Google Scholar]
- 8. Stitziel NO, Khera AV, Wang X, Bierhals AJ, Vourakis AC, Sperry AE, Natarajan P, Klarin D, Emdin CA, Zekavat SM, Nomura A, Erdmann J, Schunkert H, Samani NJ, Kraus WE, Shah SH, Yu B, Boerwinkle E, Rader DJ, Gupta N, Frossard PM, Rasheed A, Danesh J, Lander ES, Gabriel S, Saleheen D, Musunuru K, Kathiresan S ; PROMIS and Myocardial Infarction Genetics Consortium Investigators. ANGPTL3 deficiency and protection against coronary artery disease. J Am Coll Cardiol 2017;69:2054–2063. [DOI] [PMC free article] [PubMed] [Google Scholar]
- 9. Robciuc MR, Maranghi M, Lahikainen A, Rader D, Bensadoun A, Öörni K, Metso J, Minicocci I, Ciociola E, Ceci F, Montali A, Arca M, Ehnholm C, Jauhiainen M. Angptl3 deficiency is associated with increased insulin sensitivity, lipoprotein lipase activity, and decreased serum free fatty acids. Atheroscler Thromb Vasc Biol 2013;33:1706–1713. [DOI] [PubMed] [Google Scholar]
- 10. Graham MJ, Lee RG, Brandt TA, Tai LJ, Fu W, Peralta R, Yu R, Hurh E, Paz E, McEvoy BW, Baker BF, Pham NC, Digenio A, Hughes SG, Geary RS, Witztum JL, Crooke RM, Tsimikas S. Cardiovascular and metabolic effects of ANGPTL3 antisense oligonucleotides. N Engl J Med 2017;377:222–232. [DOI] [PubMed] [Google Scholar]
- 11. Crooke ST, Baker BF, Xia S, Yu RZ, Viney NJ, Wang Y, Tsimikas S, Geary RS. Integrated assessment of the clinical performance of GalNAc3-conjugated 2’-O-methoxyethyl chimeric antisense nucleotides, I: human volunteer experience. Nucleic Acid Ther 2019;29:16–32. [DOI] [PMC free article] [PubMed] [Google Scholar]
- 12. Fazio S, Minnier J, Shapiro MD, Tsimikas S, Tarugi P, Averna MR, Arca M, Tavori H. Threshold effects of circulating angiopoietin-like 3 levels on plasma lipoproteins. J Clin Endocrinol Metab 2017;102:3340–3348. [DOI] [PMC free article] [PubMed] [Google Scholar]
- 13. Brandt TA, Lee RG, Digenio A, Graham MG, Crooke RM, Hughes SG, Singleton W, Witztum JL, Tsimikas S. 2015. Isis-Angptl3rx, an antisense inhibitor to angiopoietin-like 3, reduces plasma lipid levels in mouse models and in healthy human volunteers. Atherosclerosis 2015;241:E30–E31. [Google Scholar]
- 14. Ahmad Z, Banerjee P, Hamon S, Chan KC, Bouzelmat A, Sasiela WJ, Pordy R, Mellis S, Dansky H, Gipe DA, Dunbar LR. Inhibition of angiopoietin-like protein 3 with a monoclonal antibody reduces triglycerides in hypertriglyceridemia. Circulation 2019;140:470–486. [DOI] [PMC free article] [PubMed] [Google Scholar]
- 15. Voight BF, Peloso GM, Orho-Melander M, Frikke-Schmidt R, Barbalic M, Jensen MK, Hindy G, Hólm H, Ding EL, Johnson T, Schunkert H, Samani NJ, Clarke R, Hopewell JC, Thompson JF, Li M, Thorleifsson G, Newton-Cheh C, Musunuru K, Pirruccello JP, Saleheen D, Chen L, Stewart AF, Schillert A, Thorsteinsdottir U, Thorgeirsson G, Anand S, Engert JC, Morgan T, Spertus J, Stoll M, Berger K, Martinelli N, Girelli D, McKeown PP, Patterson CC, Epstein SE, Devaney J, Burnett M-S, Mooser V, Ripatti S, Surakka I, Nieminen MS, Sinisalo J, Lokki M-L, Perola M, Havulinna A, de Faire U, Gigante B, Ingelsson E, Zeller T, Wild P, de Bakker PIW, Klungel OH, Maitland-van der Zee A-H, Peters BJM, de Boer A, Grobbee DE, Kamphuisen PW, Deneer VHM, Elbers CC, Onland-Moret NC, Hofker MH, Wijmenga C, Verschuren WMM, Boer JM, van der Schouw YT, Rasheed A, Frossard P, Demissie S, Willer C, Do R, Ordovas JM, Abecasis GR, Boehnke M, Mohlke KL, Daly MJ, Guiducci C, Burtt NP, Surti A, Gonzalez E, Purcell S, Gabriel S, Marrugat J, Peden J, Erdmann J, Diemert P, Willenborg C, König IR, Fischer M, Hengstenberg C, Ziegler A, Buysschaert I, Lambrechts D, Van de Werf F, Fox KA, El Mokhtari NE, Rubin D, Schrezenmeir J, Schreiber S, Schäfer A, Danesh J, Blankenberg S, Roberts R, McPherson R, Watkins H, Hall AS, Overvad K, Rimm E, Boerwinkle E, Tybjaerg-Hansen A, Cupples LA, Reilly MP, Melander O, Mannucci PM, Ardissino D, Siscovick D, Elosua R, Stefansson K, O'Donnell CJ, Salomaa V, Rader DJ, Peltonen L, Schwartz SM, Altshuler D, Kathiresan S. Plasma HDL cholesterol and risk of myocardial infarction: a Mendelian randomization study. Lancet 2012;380:572–580. [DOI] [PMC free article] [PubMed] [Google Scholar]
- 16. Ganda OP, Bhatt DL, Mason RP, Miller M, Boden WE. Unmet need for adjunctive dyslipidemia therapy in hypertriglyceridemia management. J Am Coll Cardiol 2018;72:330–343. [DOI] [PubMed] [Google Scholar]
- 17. Bhatt DL, Steg PG, Miller M, Brinton EA, Jacobson TA, Ketchum SB, Doyle RT Jr, Juliano RA, Jiao L, Granowitz C, Tardif J-C, Ballantyne CM; REDUCE-IT Investigators. Cardiovascular risk reduction with icosapent ethyl for hypertriglyceridemia. N Engl J Med 2019;380:11–22. [DOI] [PubMed] [Google Scholar]
- 18. Wang Y, McNutt MC, Banfi S, Levin MG, Holland WL, Gusarova W, Gromada J, Cohen JC, Hobbs HH. Hepatic ANGPTL3 regulates adipose tissue energy homeostasis. Proc Natl Acad Sci U S A 2015;112:11630–11635. [DOI] [PMC free article] [PubMed] [Google Scholar]
Associated Data
This section collects any data citations, data availability statements, or supplementary materials included in this article.