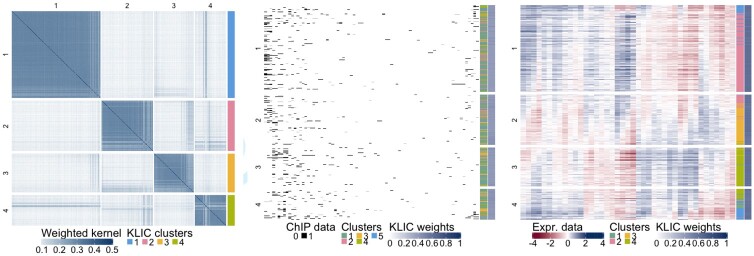
Fig. 6.
Transcriptional module discovery, KLIC output. Left: weighted kernel matrix obtained with KLIC, where each row and column corresponds to a gene, and final clusters. Centre: transcription factor data, where each row represents a gene and each column a transcription factor, black dots correspond to transcription factors that are believed to be able to bind to the promoter region of the corresponding gene with high confidence; clusters obtained using BHC on the transcription factor data and weight assigned by KLIC to each data point. Right: gene expression data, where each row is a gene and each column a time point, clusters obtained using PAM on the gene expression data, and weights assigned by KLIC to each data point

