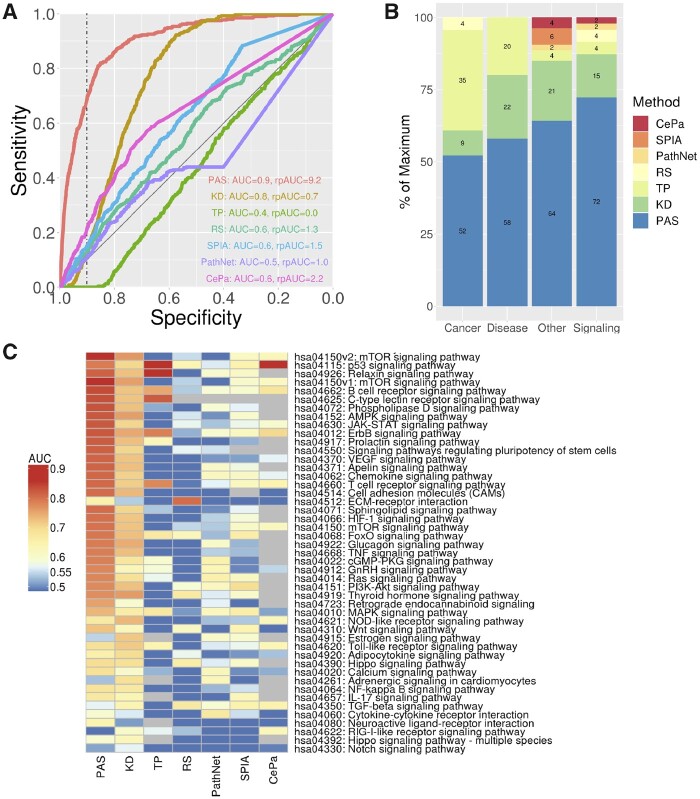
Fig. 3.
Predicting pathways perturbed by LINCS CPs. (A) ROC curves for predicting correctly mTOR signaling pathways for CP’s known to target proteins in the pathway using seven different methods: PASs = pathway activity signatures using our new method; KD = pathway signatures constructed using only CGS data, but not utilizing the pathway topology; TP = using only CP TSes and the pathway topology, but not using CGSs; RS = classical enrichment analysis not utilizing GP signatures or the pathway topology; (B) percentage of pathways predicted with the highest AUC for seven different methods across four different types of KEGG pathways; (C) heatmap of AUC’s for predicting affected KEGG signaling pathways for all seven methods

