

Abstract
Neuroimaging methods have improved the accuracy of diagnosis in patients with disorders of consciousness (DOC), but novel, clinically translatable methods for prognosticating this population are still needed. In this case series, we explored the association between topographic and global brain network properties and prognosis in patients with DOC. We recorded high-density electroencephalograms in three patients with acute or chronic DOC, two of whom also underwent an anesthetic protocol. In these two cases, we compared functional network motifs, network hubs and power topography (i.e. topographic network properties), as well as relative power and graph theoretical measures (i.e. global network properties), at baseline, during exposure to anesthesia and after recovery from anesthesia. We also compared these properties to a group of healthy, conscious controls. At baseline, the topographic distribution of nodes participating in alpha motifs resembled conscious controls in patients who later recovered consciousness and high relative power in the delta band was associated with a negative outcome. Strikingly, the reorganization of network motifs, network hubs and power topography under anesthesia followed by their return to a baseline patterns upon recovery from anesthesia, was associated with recovery of consciousness. Our findings suggest that topographic network properties measured at the single-electrode level might provide more prognostic information than global network properties that are averaged across the brain network. In addition, we propose that the brain network’s capacity to reorganize in response to a perturbation is a precursor to the recovery of consciousness in DOC patients.
Keywords: disorders of consciousness, electroencephalography, anesthesia, brain networks, graph theory, network motifs, network hubs
Introduction
Brain injury often leads to loss of consciousness. Individuals who survive but fail to regain behavioral responsiveness to pain or external cues are considered to be in a disorder of consciousness (DOC). Awareness fluctuates greatly in patients with DOC according to their diagnosis: in unresponsive wakefulness syndrome (UWS), individuals exhibit spontaneous eye opening and reflexive behaviors such as eye blinking and swallowing, but are not aware of themselves or their environment (Monti et al. 2010), while those in a minimally conscious state (MCS) are inconsistently able to respond to commands and to their environment (Giacino et al. 2002). When diagnoses are made based on clinical consensus, over 40% of patients in MCS are estimated to be misdiagnosed with UWS—a phenomenon that has been attributed to variations in behavioral assessment and interpretation (Schnakers et al. 2009; Peterson et al. 2015). Moreover, some patients diagnosed with UWS have demonstrated awareness through willful modulation of their brain activity in a functional magnetic resonance imaging (fMRI) scanner (Owen et al. 2006; Monti et al. 2010) and during high-density electroencephalography (EEG) recordings (Cruse et al. 2011). Such neuroimaging approaches have revealed that even when the best available behavioral assessment (Coma Recovery Scale—Revised [CRS-R]) is used, there is still a misdiagnosis rate of approximately 15% (Kondziella et al. 2016). Both the high misdiagnosis rate of behavioral assessment and the presence of “covert” consciousness in behaviorally unresponsive patients highlight the need for objective assessment tools. However, as the gold standard for the assessment of consciousness is self-report and response to commands, there will always be uncertainty associated with any new diagnostic test for unresponsive individuals (Peterson et al. 2015). An alternative approach is to develop tools for prognostication: since clinical outcomes can be reliably gathered, prognostic tools have the potential to achieve higher reliability and accuracy than diagnostic tools in this population. Such tools can have substantial impact on patient quality of life, influencing treatment and end-of-life decision-making.
Advances in neuroimaging have improved prognostication in this patient population beyond what is possible with clinical measures such as age at injury or etiology alone. Positron-emission tomography (PET) measures of brain glucose metabolism and fMRI measures of functional connectivity in the default mode and attention networks have predicted outcomes with accuracies of up to 88% (Stender et al. 2016; Song et al. 2018). EEG in particular has been extensively explored for prognosis due to its high translational potential. Spectral power ratios (Sitt et al. 2014; Bagnato et al. 2017) and the presence of long-latency event-related potentials (ERPs) have been established as predictors of recovery from DOC (Wijnen et al. 2007; Faugeras et al. 2011, 2012; Steppacher et al. 2013). More recently, brain network characteristics have been explored for their prognostic value. Network features including low functional connectivity in low frequency bandwidths (Sitt et al. 2014; Bai et al. 2019), and feedback-dominant frontoparietal connectivity and posterior-dominant network hubs (Blain-Moraes et al. 2016) have been associated with favorable outcomes in patients with DOC. Graph theory analysis of EEG has demonstrated that path length, participation coefficient, modularity, and clustering of brain networks are potential prognostic markers (Chennu et al. 2017; Stefan et al. 2018). Finally, the complexity of the brain’s EEG response to transcranial magnetic stimulation has been associated with the degree of recovery from DOC (Casarotto et al. 2016). While these EEG studies have established the enormous potential of this neuroimaging technique for prognosis in this population, to date, none have achieved sufficient prognostic accuracy, specificity, and sensitivity to be clinically useful (85% for all three metrics), particularly in UWS patients. There is therefore a need to explore novel EEG prognostic measures, or refine existing ones, in this population.
Brain network motifs are recurring connectivity patterns in a network that are present at numbers significantly higher than in random networks (Milo et al. 2002). These subgraphs are thought to be the building blocks of larger networks, with functional motifs representing communication channels between nodes (Sporns and Kötter 2004). Motifs may reveal granular changes in network composition that are associated with the capacity of a network to sustain consciousness (Shin et al. 2013; Kafashan et al. 2016), and thus may have strong prognostic value for DOC patients. Our group has demonstrated in healthy participants that three-node functional motifs exhibit topographically distinct patterns associated with states of anesthetic-induced unconsciousness (Duclos et al. 2020). We have also demonstrated the feasibility of using anesthesia to perturb the brain networks of a DOC patient, allowing us to measure changes in the network that herald the recovery of consciousness (Blain-Moraes et al. 2016). Driven by these findings, in this study, we investigate the prognostic potential of three-node functional network motifs in three DOC patients in an acute or chronic state, two of whom were exposed to anesthesia. We hypothesize that patient prognosis is associated with motif topography before, during and after exposure to anesthesia. Furthermore, we compared motif topography to other topographic network properties (network hubs and power topography) and global network properties (graph theoretical network properties and relative power). We predict that the spatial information provided by topographic network properties will be more predictive of patient outcome compared to global brain network characteristics, which are averaged across nodes in the network.
Materials and Methods
Participants
A convenience sample of three patients in a DOC following acquired brain injury was recruited from the Montreal Neurological Hospital and the surrounding Montreal area. Participants were included if they were between 18 and 80 years old and were in UWS or MCS, as assessed using the CRS-R by a trained experimenter (CA). They were excluded if they presented with elevated intracranial pressure, hepatic or renal failure, and/or hemodynamic instability, were receiving active vasopressor therapy, were in a medically induced coma for intracranial hypertension or status epilepticus, had a neurosurgical intervention in the 72 h prior to the study (due to open-head injury or intracranial pathology), or had a documented allergy to propofol. Participants were also excluded for pregnancy, or if they were deemed medically unsuitable for the study by their attending physician. Next of kin provided written informed consent for all participants. The study was approved by the McGill University Health Center Research Ethics Board (15-996-MP-CUSM).
Experimental design
We present a series of case studies of three patients in a DOC, who underwent a high-density EEG recording. Details of each case are presented in the Results section. Importantly, two patients were in an acute state (<3 months post-injury), while one was in a chronic state. We expected that the acute patient in MCS would exhibit EEG patterns similar to healthy controls (positive control), whereas the chronic UWS patient would not (negative control). In the acute UWS patient, we tested the hypothesis that topographic network properties—particularly, network motifs—were associated with prognosis.
Two of the three patients were also exposed to anesthesia, as per the anesthetic protocol detailed in Blain-Moraes et al. (2016). Briefly, high-density EEG was measured at baseline, during exposure to anesthesia, and after recovery from anesthesia. We followed the guidelines of the Canadian Anesthesiologists’ Society in all regards, including pre-anesthetic assessment, fasting, and monitoring. An Alaris PK Carefusion pump (Carefusion, Switzerland) was used to administer propofol in a target-controlled infusion mode using the Marsh kinetic set (Marsh et al. 1991). The parameters to drive the pump were based on the age and weight of the patients. The effect site concentration was of 2 μg/ml and was held constant for the duration of the anesthetic exposure (40 min). The patients maintained adequate spontaneous respiration throughout. The beginning of the recovery period was defined as the moment the effect site concentration reached 0.5 μg/ml.
Global and topographic network properties in DOC patients were compared against nine healthy controls undergoing anesthetic-induced unconsciousness, induced by propofol and maintained for 3 h using isoflurane (Maier et al. 2017; Duclos et al. 2020). Similarly to DOC patients, high-density EEG was recorded during baseline, anesthesia exposure, and recovery.
Electroencephalographic data acquisition and preprocessing
EEG signals were collected from the scalp using a 128-channel electrode net (Electrical Geodesics, Inc., Eugene, OR, USA) referenced to Cz. Data were sampled at 1 kHz, and electrode impedances were kept below 50 kΩ. Preprocessing was performed in EEGLAB (Delorme and Makeig 2004). The data were bandpass filtered from 0.1 to 50 Hz, and non-scalp channels were discarded, leaving 99 channels for subsequent analyses. Noisy channels were also removed, and the data were re-referenced to an average reference. When present, eye blinks were removed using Independent Component Analysis. Five-minute segments of EEG were extracted during three analysis epochs—baseline, anesthesia, and recovery—while patients were presented with auditory stimuli to induce ERPs. (The results of ERP analysis are not presented in this publication.) Upon visual inspection by a trained experimenter (DN), noisy segments within each epoch were removed.
Network construction
Functional networks were constructed using custom MATLAB scripts (version R2018b). Data were first filtered into the delta (1–4 Hz), theta (4–8 Hz), or alpha (8–13 Hz) band using a Butterworth filter. Functional connectivity and directed functional connectivity were calculated across 10-s windows and averaged within each analysis epoch and frequency band to generate representative connectivity matrices for baseline, anesthesia, and recovery periods. Functional connectivity was calculated using weighted phase lag index (wPLI), and directed functional connectivity using directed phase-lag index (dPLI)—measures robust against the effects of volume conduction (Vinck et al. 2011; Stam and van Straaten 2012).
The wPLI between two channels was computed as:
where is the imaginary part of the cross-spectrum between signals and , and is the signum function. When one signal leads the other, the wPLI is close to 1, with a value of 1 indicating perfect phase locking between signals. When there is no phase relationship between the signals, the wPLI is equal to 0.
A Hilbert transform yielded the instantaneous phase time series for each channel, and the phase difference between all pairs of signals and was calculated. dPLI was defined as:
where is the length of the analysis segment and is a given time point. is the Heaviside step function, such that when leads , the dPLI is between 0.5 and 1; when leads , the dPLI is between 0 and 0.5; and, when there is no phase relationship between the signals, the dPLI is equal to 0.5. As the matrices were symmetrical, they were transformed into phase-lead matrices. dPLI values below 0.5 (i.e. phase-lag) were set to zero, and the remainder (i.e. phase-lead) were normalized between 0 and 1.
The effects of spurious phase relationships in both the wPLI and dPLI connectivity matrices were controlled through a surrogate analysis, where signal remained fixed while the phase time series of signal was scrambled, abolishing the phase relationship between the signals while maintaining their other (e.g. spectral) properties. wPLI and dPLI values were compared against a distribution of the means of 20 surrogate analyses and were retained if they were significantly different ( < 0.05 level). Non-significant connections were set to 0 (wPLI) or 0.5 (dPLI).
Global network properties
We defined global network properties as network measures which were averaged across all nodes in the network, resulting in a single value for each network. The global network properties examined in this study were relative power, and a set of graph theoretical network properties.
Relative power analysis
Spectral power in the delta, theta, alpha, and broadband (1–13 Hz) frequency bands was computed over 10-s windows using a multi-taper power spectral density estimate (number of tapers = 3, time-bandwidth product = 2, spectrum window size = 3 s) from the Chronux package (Mitra 2007; Mitra et al. xxxx). Power was averaged across time windows and all electrodes. Relative spectral power was equal to the ratio between the average delta, theta, or alpha power and the average broadband power.
Graph theoretical network properties
In each network, four graph theoretical properties were computed using the Brain Connectivity Toolbox (BCT) (Rubinov and Sporns 2010): (i) Global efficiency - the inverse of the average path length (), where is the average shortest path length between all pairs of nodes in the network (Latora and Marchiori 2001). A high global efficiency reflects a more integrated network, where nodes across the network are connected using short paths. (ii) Clustering coefficient ()—the ratio between the number of connections between a node’s neighbors, and the number of possible connections these neighbors could make, averaged across all nodes (Watts and Strogatz 1998). A high clustering coefficient indicates a more segregated network with high local efficiency, where nodes tend to cluster together. (iii) Modularity—the sum of the strength of connections within a module, where modules are computed using Louvain’s algorithm (Rubinov and Sporns 2010). High modularity indicates a more segregated network, with strong within-module connections and weak between-module connections (Newman 2006). (iv) Binary small-worldness—the ratio between the clustering coefficient and the average path length (). This measure reflects both the segregation and integration required in an efficient network (Watts and Strogatz 1998).
Prior to computing these properties, networks constructed using wPLI (see Network construction section) were binarized by thresholding them at the top % of connectivity values. To determine the optimal threshold for each participant, custom MATLAB scripts were used to explore thresholds ranging from 1% to 90%. Specifically, for each participant’s baseline network, was decreased from 90% in steps of 1% until at least one node became disconnected from the rest of the graph. Disconnection was assessed using path length; when disconnected, nodes had an infinite path length. The smallest that did not result in node disconnection was selected for each participant (’s ranged from 13 to 59 for healthy controls and from 33 to 48 for DOC patients). This procedure resulted in networks which had a minimal number of connections but no isolated nodes (Kim et al. 2018), corresponding to what we would expect in a human brain network with no isolated brain regions and an economical number of connections. When connectivity values fell above the selected optimal threshold, connections were set to 1, while all others were set to 0.
Network properties for baseline, anesthesia and recovery epochs were calculated by averaging the properties across 10-s windows within each epoch. To account for spurious measurements, 10 random binary networks where the degree distribution of connections was fixed, but the connections were randomized, were computed. Connections were randomly rewired 10 times while preserving node degree (Maslov and Sneppen 2002). Global efficiency and clustering coefficient were normalized by taking the ratio between the properties of the original network and the properties of the average random network.
Topographic network properties
We defined topographic network properties as measures that were computed at the single-node level and visualized on a topographic head map. Topographic maps were plotted using EEGLAB’s topoplot function (Delorme and Makeig 2004).
Power analysis
As described previously, spectral power in the delta, theta, and alpha frequency bands was computed using the multi-taper method (see Relative power analysis section). Power topography was mapped as the power at each node relative to all the other nodes in its network. Specifically, the z-score for each node was calculated using the mean and standard deviation of power across all nodes in the network.
Hub analysis
From the binarized wPLI networks (see Graph theoretical network properties section), the degree of each node in each network was calculated to assess the location of high-degree network hubs, using the BCT. The topographic distribution of hubs was mapped as the degree of each node relative to all the other nodes in its network. Specifically, the z-score for each node was calculated using the mean and standard deviation of the degrees of all nodes in the network. For clarity, hub topographic maps were visualized using wPLI matrices binarized at the top 5% of connections.
Motif analysis
While motifs can theoretically be calculated for any number of nodes in a network, the exponentially increasing computational cost—and reduction in clinical translatability—associated with higher numbers of nodes were motivators to focus this analysis on three-node motifs. Of the 13 possible three-node motifs, only five (ID = 1, 2, 3, 5, 7) can be constructed based on the unidirectional connectivity between nodes as calculated by dPLI (Fig. 1).
Figure 1.

Three-node unidirectional network motifs explored during motif analysis. Only unidirectional motifs can be computed using the directed phase-lag index (dPLI) and are surrounded by boxes. Circles indicate nodes in the network and arrows represent functional relationships between nodes.
Motifs were computed on the dPLI networks (see Network construction section) using custom MATLAB scripts and the BCT. The motif topography for each analysis epoch was calculated based on motif frequency—the number of times a given node in the network participated in a given motif with any other node in the network. Spurious connectivity was accounted for by comparing the sum of motif frequencies across all nodes in each network against 100 surrogate networks using a z-score. Surrogate networks were generated by randomly shuffling connections while preserving the degree and weight distributions of each node in the network. When the sum of motif frequencies was non-significant (), the frequency for all nodes in that network was set to zero.
The topographic distribution of each motif was mapped as the motif frequency at each node relative all the other nodes in its network. Specifically, the z-score for each node was calculated using the mean and standard deviation of the motif frequencies across all nodes in the network.
Comparison of electroencephalographic measures across states of anesthesia exposure and against conscious controls
Comparison across states of anesthesia exposure
Within each subject, topographic network properties across baseline, anesthesia, and recovery were compared using cosine similarity (s):
where and are the z-scores corresponding to motif frequency, node degree or power for states 1 and 2. Cosine similarity ranges between −1 and 1, with 1 indicating identical and −1 indicating completely opposite topographic distributions. A value of 0 indicates orthogonality or decorrelation.
Comparison against conscious controls
For topographic properties, cosine similarity was used to compare motif, hub, and power topographies between DOC patients and each healthy control. The median cosine similarity value was used as a representative quantitative measure of the comparison between each patient and the group of controls.
For global properties, DOC patients’ properties were plotted relative to the distribution of properties for the control population. This allowed us to estimate whether DOC patients were outliers (greater or less than the median 1.57 times the interquartile range), and whether changes in global network properties across baseline, anesthesia, and recovery were similar between patients and controls.
Results
The ability of topographic and global network properties to distinguish between consciousness and anesthetic-induced unconsciousness was first validated in the healthy control dataset. Then, for each DOC patient, a case report, followed by the results of each analysis is presented. A summary of patients’ demographic and clinical data is shown in Table 1. For clarity, results for the alpha band are presented in the main body of the article, while results for the theta and delta bands are presented in the Supplementary material.
Table 1.
Demographic and clinical data of patients
| Case | Age | Sex | Etiology | Time post-injury | State | Clinical diagnosis | CRS-R score |
||||||
|---|---|---|---|---|---|---|---|---|---|---|---|---|---|
| Auditory | Visual | Motor | Oromotor | Communication | Arousal | Total | |||||||
| 1 | 35 | F | Stroke | 53 days | Acute | MCS | 2 | 3a | 4a | 1 | 0 | 2 | 12 |
| 2 | 50 | F | Stroke | 25 days | Acute | UWS | 1 | 1 | 1 | 0 | 0 | 0 | 3 |
| 3 | 24 | M | Anoxia | 8 years 6 months | Chronic | UWS | 1 | 0 | 2 | 1 | 0 | 1 | 5 |
Denotes MCS.
Validation of analysis techniques in conscious controls
Topographic network properties
Motif analysis. Motifs 1, 2, and 7 were present at frequencies statistically higher than in random networks across participants. On average, in the alpha band, motif 1 was centrally dominant during consciousness and shifted posteriorly during unconsciousness, while motif 7 demonstrated the reverse pattern (i.e. posterior-dominant during consciousness, both posterior- and anterior-dominant during unconsciousness) (Fig. 2A). These visual changes were reflected by a decrease in cosine similarity during anesthesia, and an increase post-anesthesia (Fig. 2B). Motifs in the theta band exhibited similar patterns (Supplementary Fig. 1A), while motifs in the delta band did not clearly reorganize across states (Supplementary Fig. 2A). Motif 2 did not reflect changes in states of consciousness, and therefore was not discussed in this paper.
Figure 2.

Topographic network properties in the alpha band distinguish between consciousness and anesthetic-induced unconsciousness in healthy controls; adapted from Duclos et al. (2020). In a cohort of nine healthy controls, the average topographies of alpha motif frequency, node degree, and power undergo anterior–posterior shifts across stages of anesthetic-induced unconsciousness. Topographic maps represent z-scores comparing motif frequency (A), node degree (C), and power (E) of each electrode to the distribution across all electrodes. Cosine similarity to baseline quantitatively reflects these shifts (B, D, and F, respectively). M1, motif 1; M7, motif 7.
Hub analysis. Network hubs underwent topographic shifts associated with states of consciousness. On average, alpha hubs were posterior-dominant during consciousness, and anterior-dominant during unconsciousness (Fig. 2C). Visually observed changes were captured by cosine similarity (Fig. 2D). Theta hubs exhibited similar patterns (Supplementary Fig. 1B), while delta hubs exhibited the opposite pattern (i.e. anterior-dominant during consciousness and posterior-dominant during unconsciousness) (Supplementary Fig. 2B).
Power analysis. Alpha power topography distinguished between states of consciousness. On average, alpha power was concentrated posteriorly during consciousness and shifted anteriorly under anesthesia (Fig. 2E). These changes were captured by cosine similarity (Fig. 2F). In the theta band, power was concentrated anteriorly at baseline, and was suppressed under anesthesia (Supplementary Fig. 1C). There were no anesthetic-induced topographical shifts in power in the delta band (Supplementary Fig. 2C).
Global network properties
Graph theoretical network properties. In the alpha band, there was an increase in clustering coefficient, binary small worldness and modularity during anesthesia, and no change in global efficiency (Fig. 6A, blue boxes).
Figure 6.

Comparison of alpha global network properties between conscious controls and individuals with disorders of consciousness. Graph theoretical network properties were not associated with prognosis (A), but relative power in the delta band (B) was elevated relative to conscious controls in the patient who did not recover consciousness. Boxes represent the interquartile range of the values for conscious controls, with the median indicated by a horizontal line. The whiskers extend to the minimal and maximal values which are not outliers, while outliers, defined as values greater than the median 1.57 times the interquartile range, are represented by crosses. Values for disorders of consciousness patients who recovered behavioral responsiveness are represented by circles, while the values for the patient who remained in unresponsive wakefulness syndrome are represented by a diamond. CTRL, conscious controls; P, patient.
Relative power analysis. During anesthesia, there was a decrease in relative alpha power, as well as an increase in relative theta and delta power (Fig. 6B, blue boxes).
Case 1: Motif patterns in minimally conscious state are similar to healthy controls
Case report
A 35-year-old female presented with a ponto-mesencephalic intracerebral hemorrhage due to a ruptured arteriovenous malformation (AVM). After an initial partial recovery (with complete return of her level of consciousness), she went to a rehabilitation center where, 5 months later, she experienced a second intraparenchymal hemorrhage in the pons and midbrain, extending to the fourth ventricle, complicated by seizures and hydrocephalus. Once more, she regained consciousness following this second hemorrhage and underwent a surgical resection of her AVM eighteen days after the second ictus. During the operation, she suffered from a hemorrhage in the fourth ventricle and in the pontine surgical cavity. Post-operatively, she developed obstructive hydrocephalus which was treated with extraventricular drainage. However, she failed to regain normal consciousness during the weeks that followed. She was recruited to the study 53 days post-operation, when she was in MCS (CRS-R = 12, Table 1). This patient was excluded from the anesthetic protocol as she was persistently febrile. Two weeks after data collection, she began obeying commands with her right foot and left arm. Upon discharge, 5 months and 23 days after data collection, the patient was behaviorally responsive and communicative (CRS-R = 23).
Topographic network properties
Motif analysis. The participant’s alpha motifs had similar topographic patterns to conscious controls (Fig. 3A). As they were close to emergence (CRS-R = 12), this was expected and may suggest that their brain network had the capacity to sustain consciousness. Motif 1 was concentrated in central brain regions ( 0.530); motif 7 was spread across peripheral electrodes ( 0.476). Motifs in the theta (Supplementary Fig. 3A) and delta bands (Supplementary Fig. 4A) were also similar to conscious controls.
Figure 3.
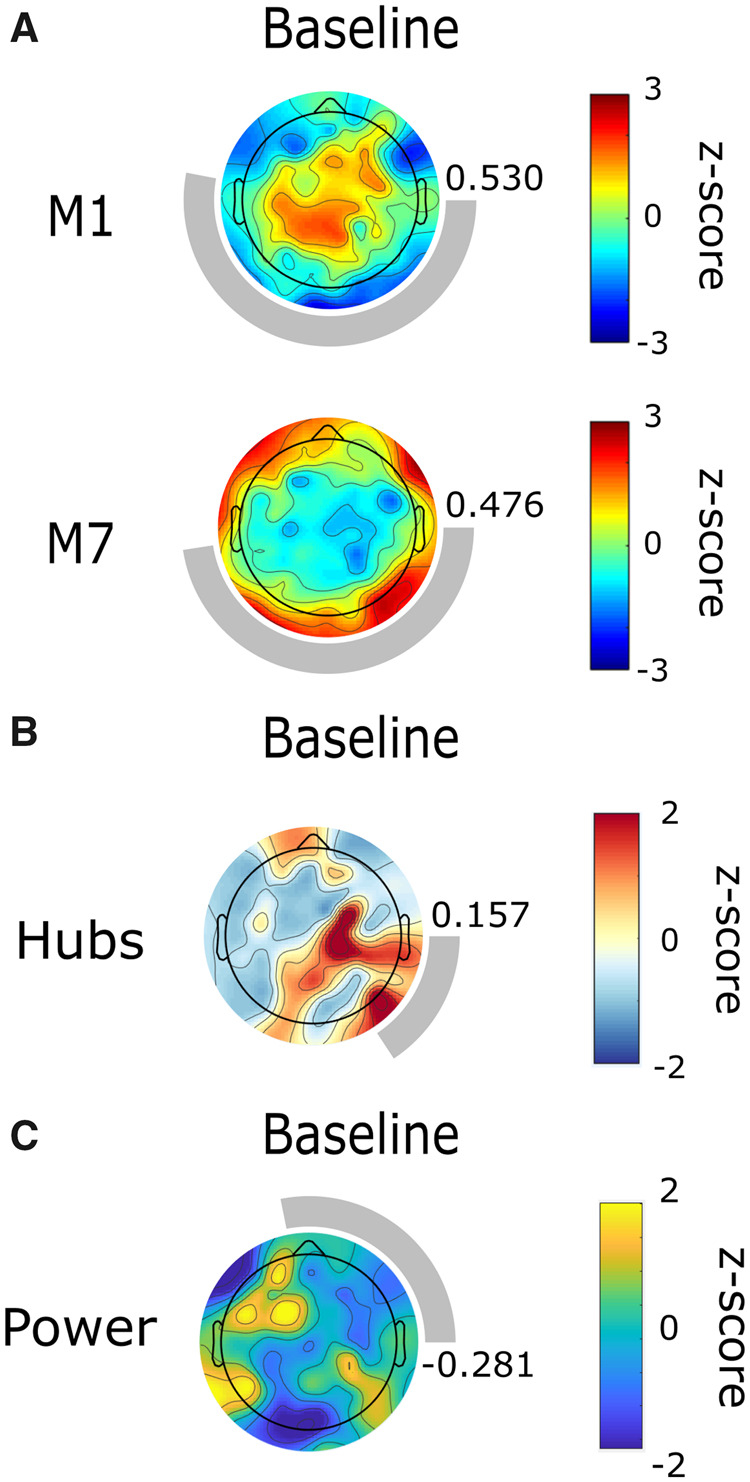
Alpha network motif topographies resemble those of healthy controls in an individual who emerged from minimally conscious state. Topography of alpha motif frequency, but not of node degree or power, are similar to those of healthy controls at baseline. Topographic maps represent z-scores comparing motif frequency (A), node degree (B), and power (C) of each electrode to the distribution across all electrodes. Rings surrounding the topographic maps represent the median cosine similarity to conscious controls; a more complete ring corresponds to higher similarity, the value of which is also indicated to the right of each topographic map. M1, motif 1; M7, motif 7.
Hub analysis. Alpha network hubs were dissimilar to conscious controls (0.157) (Fig. 3B), as were hubs in the theta (Supplementary Fig. 3B) and delta bands (Supplementary Fig. 4B).
Power analysis. At baseline, alpha power topography did not resemble the distribution for conscious controls (0.281) (Fig. 3C). Neither did theta (Supplementary Fig. 3C) or delta (Supplementary Fig. 4C) power topography.
Global network properties
Graph theoretical network properties. At baseline, in the alpha band, global efficiency was within the range of conscious controls, while clustering coefficient, binary small-worldness, and modularity were all elevated relative to conscious controls (Fig. 6A, red circles). Graph theoretical properties in the theta (Supplementary Fig. 9, red circles) and delta band (Supplementary Fig. 10, red circles) were either lower than or within the range of conscious controls.
Relative power analysis. Relative power in the delta band was within the range of conscious controls, while relative theta power was higher and relative alpha power was lower than in conscious controls (Fig. 6B, red circles).
Case 2: Motif, hub, and power topographic reorganization in unresponsive wakefulness syndrome is similar to healthy controls and predicts recovery of consciousness
Case report
A 50-year-old female presented with a high-grade subarachnoid hemorrhage (Fisher Grade IV, World Federation of Neurosurgeons (WFNS) Grade V, with a right frontotemporal intraparenchymal hematoma) secondary to a ruptured right middle cerebral artery (MCA) aneurysm. She was behaviorally unresponsive upon admission (GCS = 3). The patient underwent a decompressive craniectomy and clot evacuation as well as the insertion of an extraventricular drain on the day of admission. She did not regain consciousness after this first surgery. Two days later, she underwent a second operation for clipping of her right MCA aneurysm. She did not regain normal consciousness during the 4 weeks that followed. At the time of data collection, 25 days post-injury, the patient was behaviorally unresponsive and in UWS (CRS-R = 3, Table 1). It is important to note that the right bone flap of the patient was resected prior to data collection. As the electrode net lacked tension on this side of the skull, their brain networks’ topographic patterns were skewed. Three months and seven days following data collection, the patient recovered behavioral responsiveness, and was able to spontaneously open her eyes, obey commands, and produce slow but oriented speech (GCS = 15).
Topographic network properties
Motif analysis. At baseline, this participant’s alpha motif topography was similar to conscious controls, although skewed (0.404, 0.528) (Fig. 4A). Strikingly, nodes participating in motifs 1 and 7 reorganized during exposure to anesthesia (Fig. 4A and B). While the topographic distribution of motifs in the anesthetized state only has a weak similarity to anesthetic-induced unconsciousness in healthy controls (i.e. not posteriorly or anteriorly dominant) the patient’s brain network adaptively reconfigured in response to propofol and the topographic patterns returned to their baseline state upon cessation of the anesthetic, perhaps suggesting that the patient was either conscious or had the capacity for consciousness at the time of data collection. In the theta band, motif topographies are dissimilar to conscious controls at baseline but undergo similar topographic reorganization during anesthesia (Supplementary Fig. 5A). Motifs in the delta band are similar to conscious controls but did not undergo clear reorganization during anesthesia (Supplementary Fig. 6A).
Figure 4.

Alpha network motif, hub, and power topographic reorganization under anesthesia in a patient who emerged from unresponsive wakefulness syndrome. Topography of alpha motif frequency, but not of node degree or power, are similar to those of healthy controls at baseline. Motif, node degree, and power distributions undergo topographic reorganization under anesthesia, similar to healthy controls. Topographic maps represent z-scores comparing motif frequency (A), node degree (C), and power (E) of each electrode to the distribution across all electrodes. Rings surrounding the topographic maps represent the median cosine similarity to conscious controls; a more complete ring corresponds to higher similarity, the value of which is also indicated to the right of each topographic map. Cosine similarity to the participant’s own baseline quantitatively reflects these shifts (B, D, and F, respectively). M1, motif 1; M7, motif 7.
Hub analysis. Alpha network hubs were dissimilar to conscious controls at baseline (0.051) (Fig. 4C) but reorganized under anesthesia in a similar manner as healthy individuals (i.e. posterior-to-anterior shift) (Fig. 4C and D). This may once again be suggestive of consciousness or the capacity of the brain network to sustain consciousness. Theta (Supplementary Fig. 5B) and delta hubs (Supplementary Fig. 6B) also underwent topographic reorganization under anesthesia.
Power analysis. At baseline, alpha power topography did not resemble the distribution for conscious controls ( 0.317) (Fig. 4E) but reorganized under anesthesia (posterior-to-anterior) (Fig. 4E and F). Neither theta (Supplementary Fig. 5C) or delta (Supplementary Fig. 6C) power topography shifted under anesthesia.
Global network properties
Graph theoretical network properties. In the alpha band, all global network properties were similar to conscious controls (Fig. 6A, orange circles). While these properties changed across baseline, anesthesia, and recovery, they did not shift in an expected pattern. This was also the case in the theta (Supplementary Fig. 9, orange circles) and the delta bands (Supplementary Fig. 10, orange circles).
Relative power analysis. Relative power in the delta band was within the range of conscious controls, while relative theta power was higher and relative alpha power was lower than in conscious controls (Fig. 6B, orange circles).
Case 3: Motif, hub, and power topographies in persistent unresponsive wakefulness syndrome are dissimilar to healthy controls
Case report
A 24-year-old male suffered from an anoxic brain injury 8 years prior to this study, following cardiac arrest caused by commotio cordis resulting from a blow to the precordial region, leaving the patient without vital signs for ∼30 min. He did not recover normal consciousness following this injury. At the time of data collection, the patient was diagnosed with UWS (CRS-R = 5, Table 1). At the time of publication, this patient remains in UWS.
Topographic network properties
Motif analysis. At baseline, motif topographies were dissimilar to conscious controls ( 0.211, 0.451). Motif 1 was spatially dispersed, while motif 7 exhibited the opposite polarity of topographic distribution that we would expect based on observations in healthy controls (i.e. motif 7 was anteriorly instead of posteriorly dominant) (Fig. 5A). This was expected as the participant was in a chronic UWS state and might suggest that the inability of the brain network to sustain consciousness is reflected by its motif characteristics. The topographic organization of motifs 1 and 7 shifted in response to anesthesia but failed to return to baseline state post-anesthesia (Fig. 5A and B). Contrary to what we would expect in a healthy individual, high-frequency nodes seemed to become more polarized towards anterior brain regions for motif 1, and posterior brain regions for motif 7. At recovery, node participation in motif 1 regained a disorganized pattern, while motif 7 became insignificant. There were no clear patterns in motif topography or reorganization in the theta (Supplementary Fig. 7A) and delta bands (Supplementary Fig. 8A); motifs at these frequencies were often non-significant.
Figure 5.

Alpha network motif, hub and power topographies are spatially incoherent in an individual with persistent unresponsive wakefulness syndrome. Topography of alpha motif frequency, node degree and power are dissimilar to healthy controls at baseline. Under anesthesia, distributions either did not reorganize, or did not follow the pattern expected based on observations in healthy controls. Topographic maps represent z-scores comparing motif frequency (A), node degree (C), and power (E) of each electrode to the distribution across all electrodes. Rings surrounding the topographic maps represent the median cosine similarity to conscious controls; a more complete ring corresponds to higher similarity, the value of which is also indicated to the right of each topographic map. Cosine similarity to the participant’s own baseline quantitatively reflects the failure of topographic patterns to reorganize in a clear pattern (B, D, and F, respectively). M1, motif 1; M7, motif 7.
Hub analysis. Alpha network hubs did not resemble conscious controls at baseline 0.101) (Fig. 5C) or return to baseline state post-anesthesia (Fig. 5C-D). This may further emphasize that the inability of the brain network to sustain consciousness is associated with topographic network properties. There were no clear patterns in hub topography or reorganization in the theta band (Supplementary Fig. 7B), although hubs did undergo anesthetic-induced topographic reorganization in the delta band (Supplementary Fig. 8B).
Power analysis. At baseline, alpha power topography did not resemble the distribution for conscious controls (0.343) (Fig. 4E) and did not reorganize under anesthesia (Fig. 4E and F). Neither theta (Supplementary Fig. 7C) nor delta (Supplementary Fig. 8C) power topography shifted under anesthesia.
Global network properties
Graph theoretical network properties. At baseline, in the alpha band, global efficiency was within the range of conscious controls, while clustering coefficient, binary small worldness and modularity were all elevated relative to conscious controls (Fig. 6a, blue diamonds). While these properties changed across baseline, anesthesia, and recovery, they did not shift in an expected pattern. This was also the case in the theta (Supplementary Fig. 9, blue diamonds) and the delta bands (Supplementary Fig. 10, blue diamonds).
Relative power analysis. Relative power in the theta band was within the range of conscious controls, while relative delta power was higher and relative alpha power was lower than in conscious controls (Fig. 6B, blue diamonds). Importantly, this patient, who did not recover consciousness, was the only one with elevated delta power relative to conscious controls.
Discussion
In this study, we provide preliminary evidence, through a series of three DOC cases, that network motifs may be associated with prognosis in this patient population. Further, we compared network motifs to other established topographic and global network properties. In the cases presented here, topographic network properties appear to have more prognostic value than global network properties, bringing to light issues that may arise during whole-brain averaging of brain network properties in brain-injured populations. Our findings suggest that network motifs are a promising addition to the existing repertoire of prognostic EEG measures and demonstrate that the perturbation of resting state brain networks using anesthesia can further inform prognosis.
Brain network motifs show promise as a novel prognostic measure in disorders of consciousness
In the three presented cases, the topographic distribution of three-node functional motifs resembles conscious controls at baseline in patients who later emerged from their DOC. In these cases, nodes participating in motif 1 were concentrated over central brain regions, while those participating in motif 7 were localized over lateral brain regions. Importantly, in a patient who later recovered consciousness, motif topography reconfigured under anesthesia and returned to baseline topography post-anesthesia. This was not the case in the patient in persistent UWS who underwent the same anesthetic protocol.
This is the first study to explore network motifs as prognostic markers in DOC patients. Previously, the emergence and suppression of motifs across states of anesthetic-induced unconsciousness have been observed using EEG (Shin et al. 2013) and fMRI (Kafashan et al. 2016) in healthy individuals. We build upon this emerging field of study through our use of high-density EEG, which provides greater spatial resolution, and by applying this method in a novel clinical context.
While the neural mechanisms underlying motif topography remain unclear, the specific configuration of motifs 1 and 7 informs hypotheses regarding their role in the brain. Motif 1, which consists of two nodes which converge on an apical node, has been associated with balancing between-module integration and segregation (Sporns and Kötter 2004). In particular, the apical node is thought to integrate information as part of the “rich club,” a core network of highly connected hubs (Gollo et al. 2015). Motif 7 forms a closed loop and has been implicated in fast, within-module integration, particularly in peripheral sensory brain regions (Gollo et al. 2015). Interestingly, nodes participating in motif 7 in both controls and DOC patients are located over peripheral brain regions, and their topography is complimentary to that of motif 1, supporting this theory. In the context of persistent UWS, we observed a disruption of nodes participating in motifs 1 and 7. This may be driven by a breakdown in between- and within-module integration, which has been associated with reduced consciousness (Tononi 2004; Dehaene and Changeux 2011). In UWS, reduced thalamocortical integration, mediated by cortical, thalamic, or fiber damage, is believed to underly negative behavioral outcomes (Rosanova et al. 2012) and global network integration is thought to shift in favor of local, segregated information processing (Rizkallah et al. 2019).
Our results demonstrate that motif reorganization is not associated with anterior–posterior shifts in alpha power across states of consciousness. The anteriorization of alpha power has traditionally been considered a marker of anesthetic-induced unconsciousness (Tinker et al. 1977; John et al. 2001). While this phenomenon can be observed in Case 2, the reorganization of network motifs in this participant do not exhibit patterns of change that are associated with the topographic shift in alpha power. Case 3 provides further evidence of the dissociation between alpha power and motifs, as alpha power remains anterior across all three states, while the motif topography reorganizes. Our results also demonstrate that motif reorganization is not associated with shifts in network hub location. Previous studies have shown that posterior hub locations are associated with states of consciousness, and anterior hub locations with states of unconsciousness (Lee et al. 2013; Blain-Moraes et al. 2016). In both Cases 2 and 3, the shift in the topographic distribution of network node degree are not paralleled by the topographic shift in motif 1 or 7. While these results do not provide an explanation of the motif’s underlying neural mechanism, they demonstrate the added value of this granular network analysis above and beyond these more traditional markers of levels of consciousness. Motif topography in Cases 1 and 2 was more similar to conscious controls at baseline than alpha and hub topography, further suggesting the added value of motif analysis.
Topographic network properties may be more strongly associated with recovery from disorders of consciousness than global network properties
Global network properties, which are averaged across nodes in the network, were not strongly associated with prognosis. At baseline and across states of anesthesia none of the graph theoretical network properties in any of the frequency bands consistently predicted recovery of behavioral responsiveness. This is in contrast to studies demonstrating that clustering and path length in the alpha band (Stefan et al. 2018), as well as clustering and modularity in the delta band (Chennu et al. 2017) predicted outcomes in large cohorts of DOC patients. In terms of relative power, the patient who did not recover exhibited elevated relative power in the delta band as compared to conscious controls. This is in line with several studies that have associated high delta power with negative outcomes (Sitt et al. 2014; Bagnato et al. 2017; Golkowski et al. 2017; Stefan et al. 2018). On the other hand, topographic network properties were consistently associated with behavioral outcomes. In patients who eventually recovered consciousness, we observed that nodes participating in functional motifs, high-degree nodes and nodes with high alpha power were organized in distinct patterns that reconfigured under anesthesia and returned to their baseline state post-anesthesia. We replicated the finding that alpha network hub and power location shifts under anesthesia, predicting behavioral outcome in patients who will eventually recover consciousness (Blain-Moraes et al. 2016).
Interestingly, unlike global network properties, the information provided by topographic network properties had prognostic value despite the heterogeneity of types of brain injury in our sample. While global network properties provide an overall representation of network functioning, our results suggest that valuable information may be lost during spatial averaging of network properties. Motifs capture region-specific changes in brain functioning and thus have the potential to be more attuned to granular network changes that affect the capacity for consciousness. This is especially promising in DOC patients, where the heterogeneity of pathological brain networks across individuals calls for analysis techniques that are sensitive to changes in the building blocks of a network.
The capacity of brain networks to reorganize post-perturbation may predict the recovery of consciousness
Topographic network properties provided additional prognostic information when measured in the context of anesthesia. We observed anterior–posterior shifts in network motif participation, hubs and power that were predictive of a patient’s recovery from UWS. In the case of network hubs and power topography, perturbing the brain using anesthesia was particularly informative, as, on their own, similarity of hub and power topographies to controls at baseline was not predictive of patient outcome. Although this lack of prognostic ability at baseline may have been a result of the cortical lesions distorting DOC patients’ brain network organization, this observation nevertheless highlights the prognostic value of applying a perturbation to patients’ brain networks.
One of the greatest challenges in DOC diagnosis and prognosis is the absence of a gold standard by which to validate novel assessment tools (Demertzi et al. 2017). In the absence of self-reported levels of consciousness, DOC patients are often compared to healthy controls. As we have demonstrated in this case series, baseline comparison to controls is not always sufficient for detecting patients who will recover consciousness (as was the case for network hubs and power topography in the cases presented here). The perturbation of DOC brain networks using anesthesia allows for the within-subject comparison of patients to their own baseline. In this way, we control for the heterogeneity of etiology and chronicity of brain injury, which influences between-group comparisons.
The concept of perturbing the brain with an external stimulus and measuring its capacity to adapt to that perturbation in the context of DOC is not new. In particular, transcranial magnetic stimulation has been investigated as one such perturbation. The speed and spatial distribution (Rosanova et al. 2012), as well as the complexity of the brain’s response to this type of stimulation (Casali et al. 2013; Casarotto et al. 2016) have shown promise as diagnostic and prognostic markers, achieving prognostic accuracy of up to 81%. Further, right before recovery of consciousness in healthy controls undergoing anesthetic-induced unconsciousness, brain networks meet the conditions required for rapid reconfiguration and synchronization (Kim et al. 2016). In a similar vein, higher levels of consciousness have been associated with a higher probability of transitioning between patterns of connectivity measured using fMRI, whereas the brain networks of UWS patients showing no signs of covert consciousness tend to remain in a static pattern (Demertzi et al. 2019). These findings are strongly supported by our study, as evidenced by the brain network of a patient who remained in UWS, which did not respond in an ordered way to anesthetic perturbation. Here, we add to the growing body of evidence suggesting that the brain’s ability to reorganize following a perturbation and to transition between states are precursors to emergence from disordered states of consciousness.
Topographic network analysis strikes a balance between the predictive power of neuroimaging and the need for clinical translatability
We found that clinical measures do not always predict recovery of behavioral responsiveness. It has been established that DOC patients who are older at the time of injury, who experience an anoxic brain injury, who are further from the date of injury, and who are diagnosed as UWS or have low CRS-R scores are less likely to recover consciousness (Chennu et al. 2017; Song et al. 2018). Consistent with these findings, in the cases presented here, the individual in UWS who did not recover was the only case of anoxic brain injury and the most chronic DOC patient at over 8 years post-injury. Clinically, this patient was therefore the most unlikely to recover consciousness and it is worth nothing that topographic network properties reaffirmed this. Our study provides further evidence that measures usually obtained in the clinic are important but insufficient to establish a definite prognosis and could be supplemented with neuroimaging assessments.
While, as previously discussed, PET and fMRI imaging achieve high prognostic accuracy, these techniques are not always amenable to clinical implementation. Both neuroimaging methods pose a financial barrier, are unsafe or distorted in the presence of metallic implants, and are highly susceptible to movement artifacts, which may result from the involuntary movements of DOC patients. Studies on DOC prognosis based on motor imagery in fMRI have labeled up to 17% of data as unusable due to excessive motion artifacts (Cruse et al. 2011; Monti et al. 2010). Patients are often sedated using propofol to reduce movement during MRI but, as we and others have shown, anesthesia is known to impact functional connectivity (Demertzi et al. 2017; Kirsch et al. 2017). With this study, we demonstrate once more that EEG—through its cost efficiency, portability and limited contraindications—is an attractive middle-ground between strictly clinical assessment and PET or fMRI imaging.
Limitations and future directions
In this study, we presented a series of three exploratory DOC cases to demonstrate the feasibility and prognostic potential of motif analysis in this population, as well as the potential advantages of topographic versus global network analysis and within-subject comparisons. Our findings are preliminary and will need to be validated in a larger cohort of patients with diverse behavioral and demographic profiles, types of brain injury and chronicity of injury. For instance, the third patient presented was the most clinically unlikely to recover due to the chronicity and mechanism of their brain injury. Our results confirm the poor prognosis, demonstrating the validity of motif analysis in this case, but do not add any additional information beyond what can be discerned from the clinical profile. In addition, results were influenced by a missing bone flap in one patient; similarly, differences in brain lesions in our patient population may have skewed topographic maps. Future studies might employ source-localized EEG to evaluate functional connectivity between specific brain regions, mapped onto the individual brain anatomy of patients, in order to infer the neural mechanisms underlying the observed topographic reorganization and to account for heterogeneity of brain lesions. Furthermore, connectivity measures other than dPLI, such as symbolic transfer entropy (Staniek and Lehnertz 2008), could be used to measure bi-directional motifs, which were excluded from our analyses. Finally, limitations in our experimental design must be considered. DOC patients were subjected to a brief anesthetic protocol (40 min) using propofol, while healthy controls underwent propofol induction, followed by 3 h of isoflurane maintenance. Nevertheless, despite differences in the duration and type of anesthesia, patterns of topographic reorganization in motifs, hubs, and power are similar between groups.
Conclusion
In a series of three exploratory DOC cases, we found that topographic, but not global, brain network properties measured using high-density EEG were associated with prognosis. We showed that functional network motifs, network hubs and alpha power topography—and their topographical reorganization during anesthesia—may be associated with DOC patient outcomes. We propose that topographic network properties measured at the nodal level might be used to complement clinical and whole-brain global measures for the prognostication of DOC patients. In addition, our findings demonstrate that the brain’s capacity to adapt to a perturbation like anesthesia may be predictive of recovery from DOC.
Funding
This study was funded by the Canadian Institutes of Health Research (FRN 152562, CD; Fredrick Banting and Charles Best Canada Graduate Scholarship – Masters, DN); the Fonds de Recherche du Québec – Nature et technologies (YM); the Fonds de Recherche du Québec – Santé (DN); and the Natural Science and Engineering Research Council of Canada (Discovery Grant RGPIN-2016-03817; SBM).
Supplementary Material
Acknowledgments
We would like to thank participants and their caregivers for their involvement in this study.
Data availability statement
The data that support the findings of this study are available from the corresponding author upon reasonable request.
Conflict of interest statement. None declared.
References
- Bagnato S, Boccagni C, Prestandrea C, et al. Changes in standard electroencephalograms parallel consciousness improvements in patients with unresponsive wakefulness syndrome. Arch Phys Med Rehab 2017;98:665–72. [DOI] [PubMed] [Google Scholar]
- Bai Y, Xia X, Wang Y, et al. Electroencephalography quadratic phase self-coupling correlates with consciousness states and restoration in patients with disorders of consciousness. Clin Neurophysiol 2019;130:1235–42. [DOI] [PubMed] [Google Scholar]
- Blain-Moraes S, Boshra R, Ma HK, et al. Normal brain response to propofol in advance of recovery from unresponsive wakefulness syndrome. Front Hum Neurosci 2016;10:10. [DOI] [PMC free article] [PubMed] [Google Scholar]
- Casali AG, Gosseries O, Rosanova M, et al. A theoretically based index of consciousness independent of sensory processing and behavior. Sci Transl Med 2013;5:198ra105. [DOI] [PubMed] [Google Scholar]
- Casarotto S, Comanducci A, Rosanova M, et al. Stratification of unresponsive patients by an independently validated index of brain complexity. Ann Neurol 2016;80:718–729. [DOI] [PMC free article] [PubMed] [Google Scholar]
- Chennu S, Annen J, Wannez S, et al. Brain networks predict metabolism, diagnosis and prognosis at the bedside in disorders of consciousness. Brain 2017;140:2120–2132. [DOI] [PubMed] [Google Scholar]
- Cruse D, Chennu S, Chatelle C, et al. Bedside detection of awareness in the vegetative state: a cohort study. Lancet 2011;378:2088–2094. [DOI] [PubMed] [Google Scholar]
- Dehaene S, Changeux JP. Experimental and theoretical approaches to conscious processing. Neuron 2011;70:200–227. [DOI] [PubMed] [Google Scholar]
- Delorme A, Makeig S. EEGLAB: an open source toolbox for analysis of single-trial EEG dynamics including independent component analysis. J Neurosci Methods 2004;134:9–21. [DOI] [PubMed] [Google Scholar]
- Demertzi A, Sitt JD, Sarasso S, et al. Measuring states of pathological (un)consciousness: research dimensions, clinical applications, and ethics. Neurosci Conscious 2017;2017:1–13. [DOI] [PMC free article] [PubMed] [Google Scholar]
- Demertzi A, Tagliazucchi E, Dehaene S, et al. Human consciousness is supported by dynamic complex patterns of brain signal coordination. Sci Adv 2019;5:eaat7603. [DOI] [PMC free article] [PubMed] [Google Scholar]
- Duclos C, Mahdid Y, Nadin D, et al. Brain network motifs are markers of loss and recovery of consciousness. bioRxiv 2020; 1–34. doi: 10.1101/2020.03.X.993659. [DOI] [PMC free article] [PubMed] [Google Scholar]
- Faugeras F, Rohaut B, Weiss N, et al. Probing consciousness with event-related potentials in the vegetative state. Neurology 2011;77:264–268. [DOI] [PMC free article] [PubMed] [Google Scholar]
- Faugeras F, Rohaut B, Weiss N, et al. Event related potentials elicited by violations of auditory regularities in patients with impaired consciousness. Neuropsychologia 2012;50:403–418. [DOI] [PubMed] [Google Scholar]
- Giacino JT, Ashwal S, Childs N, et al. The minimally conscious state: definition and diagnostic criteria. Neurology 2002;58:349–353. [DOI] [PubMed] [Google Scholar]
- Golkowski D, Merz K, Mlynarcik C, et al. Simultaneous EEG–PET–fMRI measurements in disorders of consciousness: an exploratory study on diagnosis and prognosis. J Neurol 2017;264:1986–1995. [DOI] [PubMed] [Google Scholar]
- Gollo LL, Zalesky A, Hutchison RM, et al. Dwelling quietly in the rich club: brain network determinants of slow cortical fluctuations. Philos Trans R Soc Lond B Biol Sci 2015;370:1–15. [DOI] [PMC free article] [PubMed] [Google Scholar]
- John E, Prichep L, Kox W, et al. Invariant reversible QEEG effects of anesthetics. Conscious Cogn 2001;10:165–183. [DOI] [PubMed] [Google Scholar]
- Kafashan M, Ching S, Palanca BJ. Sevoflurane alters spatiotemporal functional connectivity motifs that link resting-state networks during wakefulness. Front Neural Circuits 2016;10:107. [DOI] [PMC free article] [PubMed] [Google Scholar]
- Kim H, Hudetz AG, Lee J, et al. Estimating the integrated information measure phi from high-density electroencephalography during states of consciousness in humans. Front Hum Neurosci 2018;12:42–42. [DOI] [PMC free article] [PubMed] [Google Scholar]
- Kim M, Mashour GA, Moraes S-B, et al. Functional and topological conditions for explosive synchronization develop in human brain networks with the onset of anesthetic-induced unconsciousness. Front Comput Neurosci 2016;10:10. [DOI] [PMC free article] [PubMed] [Google Scholar]
- Kirsch M, Guldenmund P, Ali Bahri M, et al. Sedation of patients with disorders of consciousness during neuroimaging: effects on resting state functional brain connectivity. Anesth Analg 2017;124:588–598. [DOI] [PubMed] [Google Scholar]
- Kondziella D, Friberg CK, Frokjaer VG, et al. Preserved consciousness in vegetative and minimal conscious states: systematic review and meta-analysis. J Neurol Neurosurg Psychiatry 2016;87:485–492. [DOI] [PubMed] [Google Scholar]
- Latora V, Marchiori M. Efficient behavior of small-world networks. Phys Rev Lett 2001;87:198701. [DOI] [PubMed] [Google Scholar]
- Lee H, Mashour GA, Noh G-J, et al. Reconfiguration of network hub structure after propofol-induced unconsciousness . Anesthesiology 2013;119:1347–1359. [DOI] [PMC free article] [PubMed] [Google Scholar]
- Maier KL, McKinstry-Wu AR, Palanca BJA, et al. Protocol for the reconstructing consciousness and cognition (ReCCognition) study. Front Hum Neurosci 2017;11:284Retrieved from https://www.ncbi.nlm.nih.gov/pmc/articles/PMC5461274/pdf/fnhum-11-00284.pdf [DOI] [PMC free article] [PubMed] [Google Scholar]
- Marsh B, White M, Morton N, et al. Pharmacokinetic model driven infusion of propofol in children. Br J Anaesth 1991;67:41–48. [DOI] [PubMed] [Google Scholar]
- Maslov S, Sneppen K. Specificity and stability in topology of protein networks. Science 2002;296:910–913. [DOI] [PubMed] [Google Scholar]
- Milo R, Shen-Orr S, Itzkovitz S, et al. Network motifs: simple building blocks of complex networks. Science 2002;298:824–827. [DOI] [PubMed] [Google Scholar]
- Mitra P. Observed Brain Dynamics. New York, USA: Oxford University Press, 2007. [Google Scholar]
- Mitra P, Bokil H, Maniar H, et al. Chronux, 2020, http://chronux.org/.
- Monti MM, Laureys S, Owen AM. The vegetative state. BMJ 2010;341:c3765. [DOI] [PubMed] [Google Scholar]
- Monti MM, Vanhaudenhuyse A, Coleman MR, et al. Willful modulation of brain activity in disorders of consciousness. N Engl J Med 2010;362:579–589. [DOI] [PubMed] [Google Scholar]
- Newman MEJ. Modularity and community structure in networks. Proc Natl Acad Sci USA 2006;103:8577–8582. [DOI] [PMC free article] [PubMed] [Google Scholar]
- Owen AM, Coleman MR, Boly M, et al. Detecting awareness in the vegetative state. Science 2006;313:1402–1402. [DOI] [PubMed] [Google Scholar]
- Peterson A, Cruse D, Naci L, et al. Risk, diagnostic error, and the clinical science of consciousness. NeuroImage: Clinical 2015;7:588–597. [DOI] [PMC free article] [PubMed] [Google Scholar]
- Rizkallah J, Annen J, Modolo J, et al. Decreased integration of EEG source-space networks in disorders of consciousness. NeuroImage: Clinical 2019;101841. [DOI] [PMC free article] [PubMed] [Google Scholar]
- Rosanova M, Gosseries O, Casarotto S, et al. Recovery of cortical effective connectivity and recovery of consciousness in vegetative patients. Brain 2012;135:1308–1320. [DOI] [PMC free article] [PubMed] [Google Scholar]
- Rubinov M, Sporns O. Complex network measures of brain connectivity: uses and interpretations. NeuroImage 2010;52:1059–1069. [DOI] [PubMed] [Google Scholar]
- Schnakers C, Vanhaudenhuyse A, Giacino J, et al. Diagnostic accuracy of the vegetative and minimally conscious state: clinical consensus versus standardized neurobehavioral assessment. BMC Neurol 2009;9:35. [DOI] [PMC free article] [PubMed] [Google Scholar]
- Shin J, Mashour GA, Ku S, et al. Subgraph “backbone” analysis of dynamic brain networks during consciousness and anesthesia. PLoS One 2013;8:e70899. [DOI] [PMC free article] [PubMed] [Google Scholar]
- Sitt JD, King J-R, El Karoui I, et al. Large scale screening of neural signatures of consciousness in patients in a vegetative or minimally conscious state. Brain 2014;137:2258–2270. [DOI] [PMC free article] [PubMed] [Google Scholar]
- Song M, Yang Y, He J, et al. Prognostication of chronic disorders of consciousness using brain functional networks and clinical characteristics. eLife 2018;7:1–53. [DOI] [PMC free article] [PubMed] [Google Scholar]
- Sporns O, Kötter R. Motifs in brain networks. PLoS Biol 2004;2:e369. [DOI] [PMC free article] [PubMed] [Google Scholar]
- Stam CJ, van Straaten ECW. Go with the flow: use of a directed phase lag index (dPLI) to characterize patterns of phase relations in a large-scale model of brain dynamics. NeuroImage 2012;62:1415–1428. [DOI] [PubMed] [Google Scholar]
- Staniek M, Lehnertz K. Symbolic transfer entropy. Phys Rev Lett 2008;100:158101. [DOI] [PubMed] [Google Scholar]
- Stefan S, Schorr B, Lopez-Rolon A, et al. Consciousness indexing and outcome prediction with resting-state EEG in severe disorders of consciousness. Brain Topogr 2018;31:848–862. [DOI] [PubMed] [Google Scholar]
- Stender J, Mortensen KN, Thibaut A, et al. The minimal energetic requirement of sustained awareness after brain injury. Curr Biol 2016;26:1494–1499. [DOI] [PubMed] [Google Scholar]
- Steppacher I, Eickhoff S, Jordanov T, et al. N400 predicts recovery from disorders of consciousness. Ann Neurol 2013;73:594–602. [DOI] [PubMed] [Google Scholar]
- Tinker JH, Sharbrough FW, Michenfelder JD. Anterior shift of the dominant EEG rhytham during anesthesia in the Java monkey: correlation with anesthetic potency. Anesthesiology 1977;46:252–259. [DOI] [PubMed] [Google Scholar]
- Tononi G. An information integration theory of consciousness. BMC Neurosci 2004;5:42–42. [DOI] [PMC free article] [PubMed] [Google Scholar]
- Vinck M, Oostenveld R, van Wingerden M, et al. An improved index of phase-synchronization for electrophysiological data in the presence of volume-conduction, noise and sample-size bias. NeuroImage 2011;55:1548–1565. [DOI] [PubMed] [Google Scholar]
- Watts DJ, Strogatz SH. Collective dynamics of ‘small-world’networks. Nature 1998;393:440. [DOI] [PubMed] [Google Scholar]
- Wijnen V, Van Boxtel G, Eilander H, et al. Mismatch negativity predicts recovery from the vegetative state. Clin Neurophysiol 2007;118:597–605. [DOI] [PubMed] [Google Scholar]
Associated Data
This section collects any data citations, data availability statements, or supplementary materials included in this article.
Supplementary Materials
Data Availability Statement
The data that support the findings of this study are available from the corresponding author upon reasonable request.
Conflict of interest statement. None declared.