Abstract
Background
Coronavirus disease 2019 (COVID-19) affects vulnerable populations (VP) adversely.
Purpose
To evaluate overall imaging utilization in vulnerable subgroups (elderly, racial/ethnic minorities, socioeconomic status [SES] disadvantage) and determine if a particular subgroup has worse outcomes from COVID-19.
Materials/Methods
Of 4110 patients who underwent COVID-19 testing from March 3-April 4, 2020 at NewYork-Presbyterian Hospital (NYP) health system, we included 1121 COVID-19 positive adults (mean age 59±18 years, 59% male) from two academic hospitals and evaluated imaging utilization rates and outcomes, including mortality.
Results
Of 897 (80%) VP, there were 465 (41%) elderly, 380 (34%) racial/ethnic minorities, and 479 (43%) SES disadvantage patients. Imaging was performed in 88% of patients and mostly portable/bedside studies, with 87% of patients receiving chest radiographs. There were 83% hospital admissions, 25% ICU admissions, 23% intubations, and 13% deaths. Elderly patients had greater imaging utilization, hospitalizations, ICU/intubation requirement, longer hospital stays, and >4-fold increase in mortality compared to non-elderlies (adjusted hazard ratio[aHR] 4.79, p<0.001). Self-reported minorities had fewer ICU admissions (p=0.03) and reduced hazard for mortality (aHR 0.53, p=0.004; complete case analysis: aHR 0.39, p<0.001 excluding “not reported”; sensitivity analysis: aHR 0.61, p=0.005 “not reported” classified as minorities) with similar imaging utilization, compared to non-minorities. SES disadvantage patients had similar imaging utilization and outcomes as compared to their counterparts.
Conclusions
In a predominantly hospitalized New York City cohort, elderly patients are at highest mortality risk. Racial/ethnic minorities and SES disadvantage patients fare better or similarly to their counterparts, highlighting the critical role of access to inpatient medical care during the COVID-19 pandemic.
Keywords: SARS Virus, Healthcare Disparities, COVID-19, severe acute respiratory syndrome coronavirus 2, Diagnostic Imaging, Radiology, Mortality
Summary
In a predominantly hospitalized New York City cohort, elderly patients are at highest mortality risk, whereby minorities and those socioeconomically disadvantaged fare better or similar to their counterparts when given access to inpatient medical care.
Key Points
■ In a predominantly inpatient cohort, elderly patients (age ≥65 years) had higher imaging utilization and >4-fold increase in mortality compared to younger patients.
■ Racial/ethnic minorities and those socioeconomically disadvantaged had similar imaging utilization rates and fared better or similarly to their counterparts with respect to outcomes when given access to inpatient medical care.
■ Imaging utilization was driven by portable/bedside imaging studies, such as chest radiographs.
INTRODUCTION
New York City (NYC) emerged as the initial epicenter within the United States (US) of the highly contagious novel severe acute respiratory syndrome coronavirus 2 (SARS-CoV-2). (1) Despite the considerable progress NYC has made over the past several months in reducing coronavirus disease 2019 (COVID-19)-related hospitalizations and mortality, many other cities and states across the country are seeing a sharp rise in COVID-19 with record highs for daily new cases. (2) With the spread of COVID-19 disease across the US, a troubling picture emerged with reports of inequitable distribution and utilization of resources, (3) along with population-level evidence of vulnerable patients being infected and dying at higher rates. (4, 5) The virus has disproportionately affected our most vulnerable populations (VP), including the elderly, racial and ethnic minorities, and the socioeconomic status (SES) disadvantaged (such as the under-insured, prisoners, and homeless). (4, 6-9)
While potential causes for these population-level disparities during the pandemic have been suggested to be due to social inequities, such as high population density, income disparity, (10) or distribution of hospital beds per capita, (5) the cause is likely multifactorial. Furthermore, the patient-level utilization of healthcare resources amongst those seeking treatment for COVID-19 is not yet established. It is unknown if a particular vulnerable subgroup is at increased risk for greater disease burden, which subgroup is at most risk for fatality, or whether all VP are equally susceptible to the devastating effects of this virus. Thus, we aim to compare VP and its subgroups to non-VP equivalents with respect to imaging utilization and outcomes, including mortality, at a large healthcare system in NYC.
METHODS
Study Population and Patient Selection
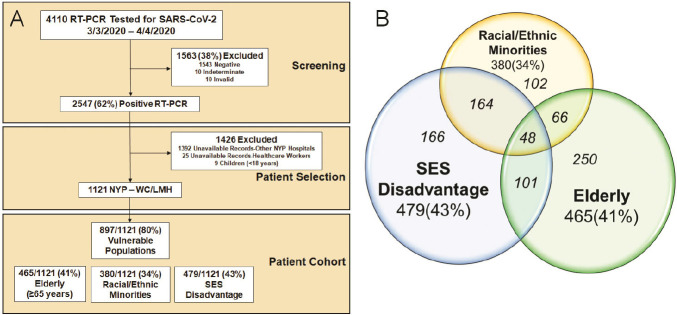
A total of 4110 patients underwent nasopharyngeal or oropharyngeal reverse-transcriptase polymerase chain reaction (RT-PCR) testing for SARS-CoV-2 at NewYork-Presbyterian (NYP) per clinical routine between March 3, 2020 and April 4, 2020 and were identified using the COVID-19 Institutional Data Repository (IDR) for inclusion in this cross-sectional observational study (Figure 1A). The COVID-19 IDR is a registry of suspected COVID-19 patients that were tested by RT-PCR (up to five RT-PCR tests) at NYP and contains clinical data extracted from the electronic medical record. NYP is a large healthcare system in NYC that is comprised of both academic and community hospitals across multiple boroughs including Brooklyn, Manhattan, and Queens. NYP is affiliated with several institutions including Weill Cornell Medicine (WCM). The authors are affiliated with WCM and have access to complete medical records and radiology images for NYP-Weill Cornell (NYP-WC) and NYP-Lower Manhattan Hospital (NYP-LMH).
Figure 1.
A. Consort Diagram of the Screening and Patient Selection for the 1121 RT-PCR (+) Patient Cohort. B. Venn Diagram of the Distribution of the 897 Vulnerable Populations and the 3 Vulnerable Subgroups. The vulnerable subgroups are not mutual exclusive, with the italicized numbers within each group summing up to 897 patients. RT-PCR denotes reverse-transcriptase polymerase chain reaction; SARS-CoV-2, severe acute respiratory syndrome coronavirus 2; SES, socioeconomic status; NYP, New York Presbyterian; WC, Weill Cornell; LMH, Lower Manhattan Hospital.
Exclusion criteria (Figure 1A) included patients with RT-PCR test results that were deemed negative, indeterminate or invalid (n=1563), those whose medical records were unavailable for review (from other NYP Hospitals, n=1392) or restricted (healthcare workers, n=25), and pediatric cases (n=9). A total of 1121 adult patients who tested positive for RT-PCR for COVID-19 were included in the final cohort from NYP-WC and NYP-LMH, and manual chart review from the electronic medical records was performed for each patient from the time period of April 24, 2020 to May 7, 2020. The study was approved by our institutional review board and a waiver of informed consent was granted.
Definitions of Vulnerable Populations
VP was defined as any of the vulnerable subgroups of elderly, racial/ethnic minorities, and SES disadvantage patients (Figure 1B). Elderly was defined as age ≥65 years. Racial/ethnic minorities included self-reported Black, Hispanic, and Native Americans patients. SES disadvantage patients included those on Medicaid, those with no insurance reported, those in prison, and those who are homeless.
End Points
The imaging end point is the utilization of any imaging study. Imaging studies include radiography (X-ray), computed tomography (CT), magnetic resonance imaging (MR), ultrasound (US), echocardiography, nuclear imaging, and invasive angiography.
The outcomes end points include highest level of care, hospitalization length of stay, intubation rate and time to intubation from admission, successful extubation rate and duration of intubation, and all-cause mortality. Highest level of care was internally stratified as outpatient, inpatient, and intensive care unit (ICU). Since outpatient in-person office visits have dramatically decreased during this pandemic (11), patients evaluated in the emergency room and not admitted were classified as outpatient.
Statistical Analysis: Descriptive statistics, including mean ± standard deviation or median with interquartile range [IQR], were used to summarize continuous variables and comparisons were made using t-tests or the Wilcoxon rank-sum test. Frequencies and percentages were used to summarize categorical variables and comparisons were made using Fisher’s exact test or Chi-square test.
For the survival analyses, we used the date of the RT-PCR specimen collection of the first positive COVID-19 test to death date or to the last documented note in the electronic medical record when the patient was noted to be alive. Comparison of mortality between groups were estimated using the product limit (Kaplan-Meier) methods and log-rank test. We performed separate Cox-proportional hazard regression models for VP and its subgroups and adjusted for potential confounders with p<0.1 from Table 1 and Table 2 and stratified by time-dependent covariates of each model. Sex and/or BMI were included in all models based on a priori knowledge. We tested the proportional hazard assumption using time-varying covariates in all Cox regression models; no violations were observed. To account for patients with “not reported” race or ethnicity, in addition to the pre-specified analysis of self-reported minorities, we performed a complete case analysis where all patients with race or ethnicity as “not reported” were excluded, and a sensitivity analysis whereby all “not reported” race or ethnicity patients were classified into the racial/ethnic minority group. Similar stratified Cox-proportional hazard regression model was performed for the subgroup analysis of elderly patients with adjustment for potential confounders with p<0.1 from Supplemental Table 1.
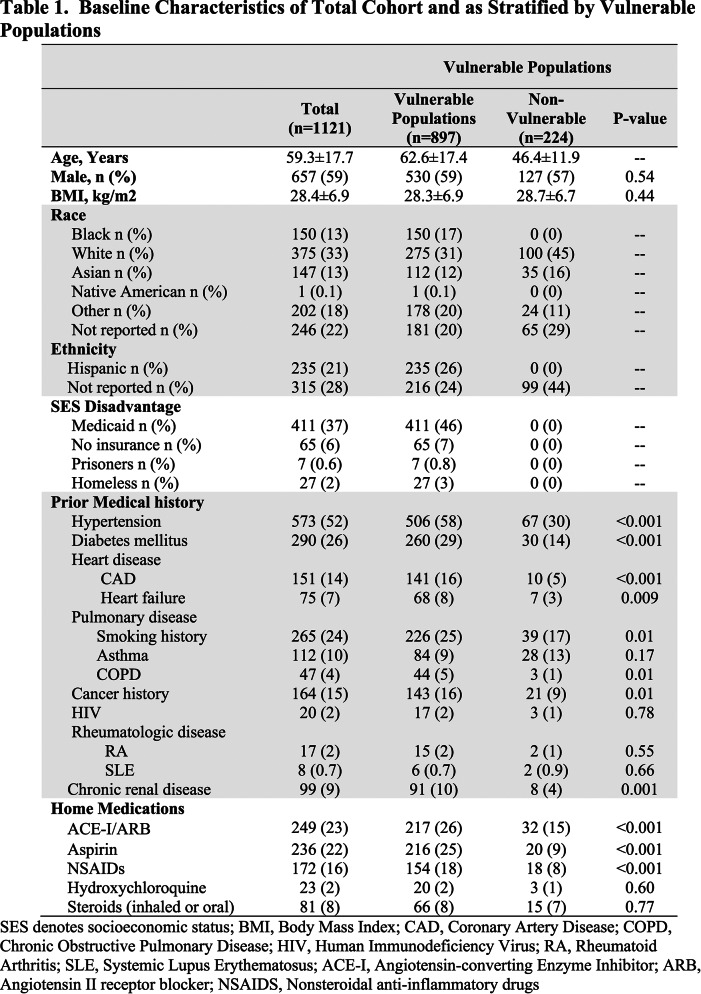
Table 1.
Baseline Characteristics of Total Cohort and as Stratified by Vulnerable Populations
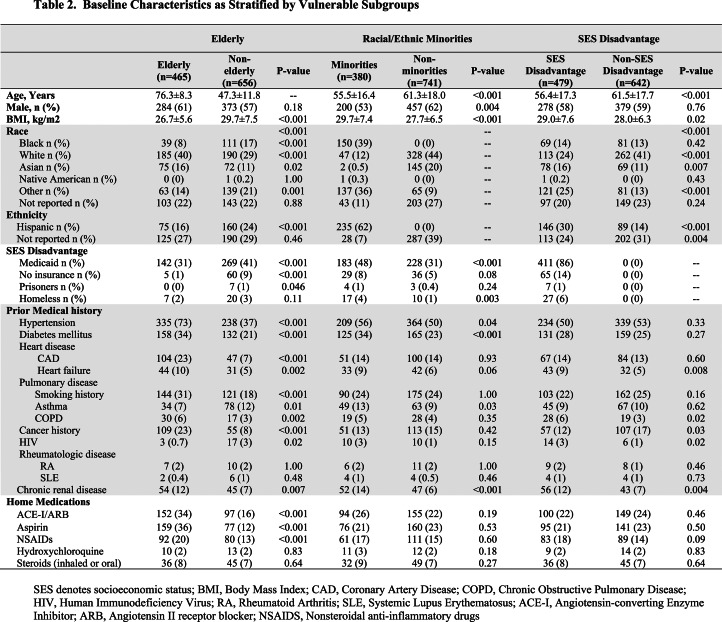
Table 2.
Baseline Characteristics as Stratified by Vulnerable Subgroups
A 2-tailed p-value <0.05 was considered statistically significant. SAS version 9.4 (SAS Institute Inc., Cary, NC) was used to perform all statistical analyses.
RESULTS
From the 4110 patients who had RT-PCR testing for SARS-CoV-2, there were 2547 (62%) patients who tested positive for COVID-19 during the first month of testing availability (Figure 1A). Of the 1121 patients included in the study, a total of 897 (80%) were considered VP with 465 (41%) elderly, 380 (34%) racial/ethnic minorities, and 479 (43%) SES disadvantage patients. The 3 vulnerable subgroups were not mutually exclusive, with overlap depicted in Figure 1B.
Table 1 and Table 2 show the baseline characteristics of the RT-PCR (+) cohort of 1121 patients and compare the differences between VP and the vulnerable subgroups to their non-vulnerable counterparts. VP and elderly patients had higher rates of baseline comorbidities including hypertension, diabetes mellitus (DM), coronary artery disease (CAD), heart failure (HF), smoking history, chronic obstructive pulmonary disease (COPD), cancer history, chronic renal disease and were more frequently on home angiotensin-converting enzyme inhibitors/angiotensin II receptor blockers (ACEI/ARB), aspirin, and nonsteroidal anti-inflammatory drugs (NSAIDs) when compared to non-VP and younger patients, respectively. In addition, elderly patients were more frequently white race with lower body mass index (BMI) and lower prevalence of asthma, home steroids usage, human immunodeficiency virus (HIV), and SES disadvantage status when compared to younger patients. While there were fewer overall differences in baseline comorbidities, and no differences in home medications, minorities were younger, more frequently female, had higher BMIs, and higher prevalence of SES disadvantage status, DM, asthma, renal disease compared to non-minorities; and SES disadvantage patients were younger, less likely of white race and more likely Hispanic, had higher BMIs and more frequent HF, COPD, cancer history, HIV, and renal disease compared to their non-SES disadvantage counterparts.
Image Utilization
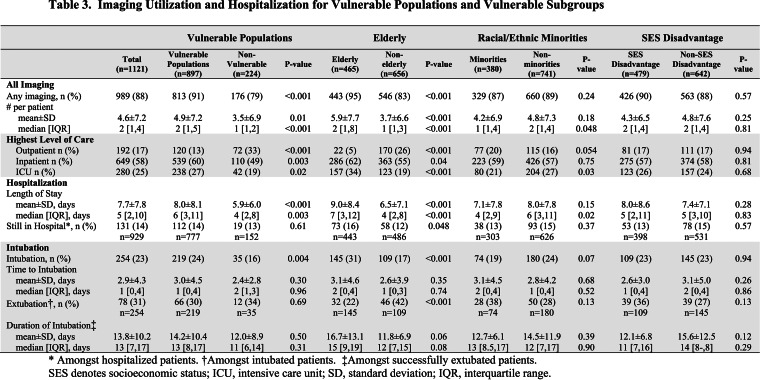
Table 3 depicts the image utilization of the cohort and as stratified by VP and the 3 subgroups. The majority of patients (88%, n=989) received at least one imaging study, ranging from 0 to 47 tests. VP and elderly patients underwent more testing as compared to their non-VP and non-elderly counterparts (all p<0.001), respectively. In general, imaging utilization rates were similar for racial/ethnic minorities and SES disadvantage patients compared to their non-vulnerable counterparts.
Table 3.
Imaging Utilization and Hospitalization for Vulnerable Populations and Vulnerable Subgroups
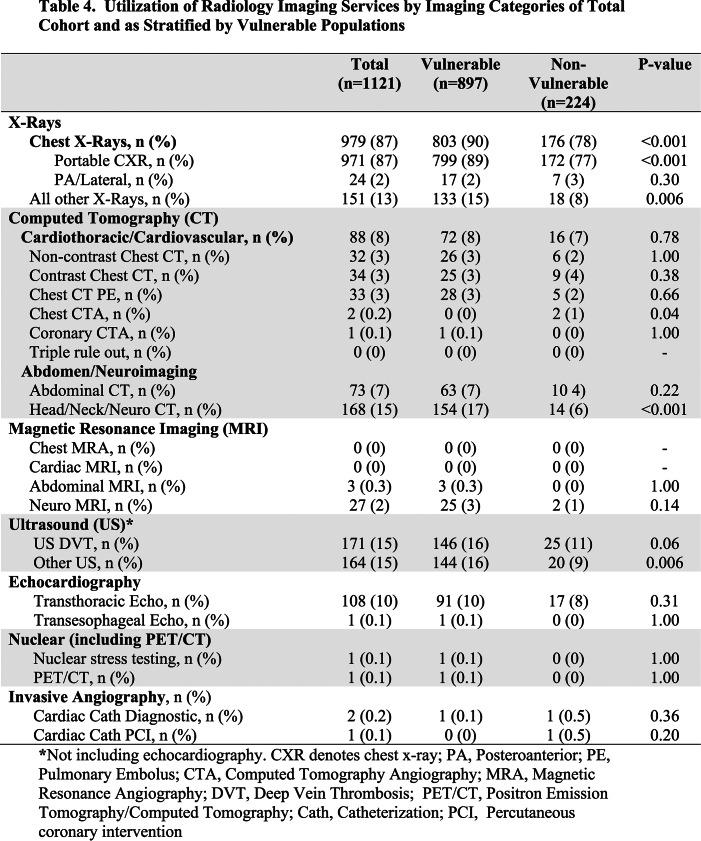
Table 4 and Supplemental Table 2 show the imaging utilization by imaging categories. The vast majority of patients (87%) underwent at least one chest radiograph (Figure 2A), followed by ultrasound (15%) and neuro CT scans (15%), and then transthoracic echocardiography (10%). Only 8% of patients received chest CTs (Figure 2B) and very few patients received coronary-related imaging studies. There were no “triple rule out” (coronary artery, pulmonary embolism, aortic dissection) studies or cardiac/chest MR studies during this period. Overall, VP and elderly patients received more imaging than their counterparts, while racial/ethnic minorities and SES disadvantage patients underwent a similar number of imaging studies (Supplemental Table 2).
Table 4.
Utilization of Radiology Imaging Services by Imaging Categories of Total Cohort and as Stratified by Vulnerable Populations
Figure 2a.
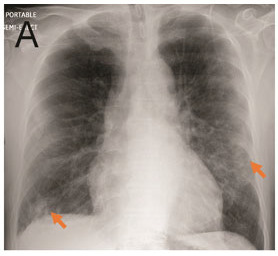
A. Portable Chest Radiograph in a RT-PCR (+) Patient with COVID-19. There are bilateral ill-defined opacities (arrows) in a lower lung predominant distribution. B. Chest CTA Pulmonary Embolus Scan of a RT-PCR (+) Patient with COVID-19. Axial image demonstrating bilateral peripheral ground glass opacities and consolidation (arrows). No pulmonary embolus was detected.
Figure 2b.
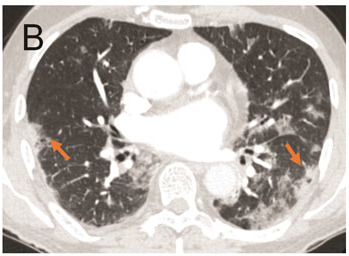
A. Portable Chest Radiograph in a RT-PCR (+) Patient with COVID-19. There are bilateral ill-defined opacities (arrows) in a lower lung predominant distribution. B. Chest CTA Pulmonary Embolus Scan of a RT-PCR (+) Patient with COVID-19. Axial image demonstrating bilateral peripheral ground glass opacities and consolidation (arrows). No pulmonary embolus was detected.
Hospitalization
The majority (83%, n=929) of our cohort was admitted to the hospital, with 649 (58%) to the medical floor and 280 (25%) to the ICU (Table 3). Only 192 (17%) RT-PCR (+) patients were managed as outpatients during our first month of the crisis and were either evaluated in the ambulatory setting or not admitted from the emergency department. VP and elderly patients were more likely to be admitted, required ICU care, and had longer hospital length of stay compared to non-VP and younger patients (all p≤0.04), respectively. While more minorities were treated as outpatients (20%) compared to non-minorities (16%), the difference was not statistically significant (p=0.054). However, minorities required fewer ICU admissions compared to non-minorities (21% vs 27%, p=0.03). There were no differences in the hospital admission rate or need for ICU for SES disadvantage patients when compared to their non-disadvantaged counterparts (all p≥0.68). VP and elderly patients were more frequently intubated than their counterparts, and elderly patients were less likely to be successfully extubated (all p≤0.004). There was no difference in intubation or extubation rate for minorities or SES disadvantage patients compared to their counterparts (all p≥0.07).
All-Cause Mortality
Of the 1121 RT-PCR (+) patients, there were 148 deaths with an overall mortality rate of 13%. The mortality rate was 16% (n=146) for the 929 hospitalized patients, 30% (n=75) for the 257 intubated patients, and 30% (n=84) for the 280 patients requiring ICU care. The mean follow-up period was 14.1±12.8 days, with a range up to 53 days.
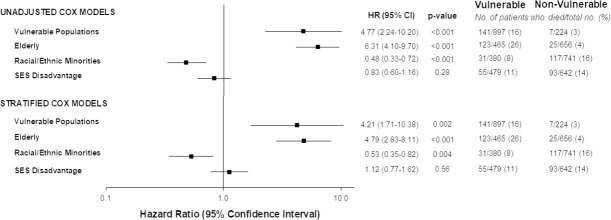
Figure 3 shows the survival curves of VP and the vulnerable subgroups. From the time of RT-PCR (+) test sampling, there were over 4-fold increase in hazard for death in VP (adjusted HR 4.21) and the elderly (adjusted HR 4.79, both p≤0.002) as compared to their counterparts (Figure 4, Supplemental Table 3). For VP, we stratified by HF and COPD, and adjusted for sex, BMI ≥ 30 kg/m2, hypertension, DM, CAD, smoking history, cancer history, chronic renal disease, ACEI/ARB, aspirin, and NSAIDs). For elderly, we stratified by COPD, and adjusted for sex, BMI≥30 kg/m2, racial/ethnic minority, SES disadvantage, hypertension, DM, CAD, HF, smoking history, asthma, cancer history, HIV, chronic renal disease, ACEI/ARB, aspirin, NSAIDs, and steroids.
Figure 3.
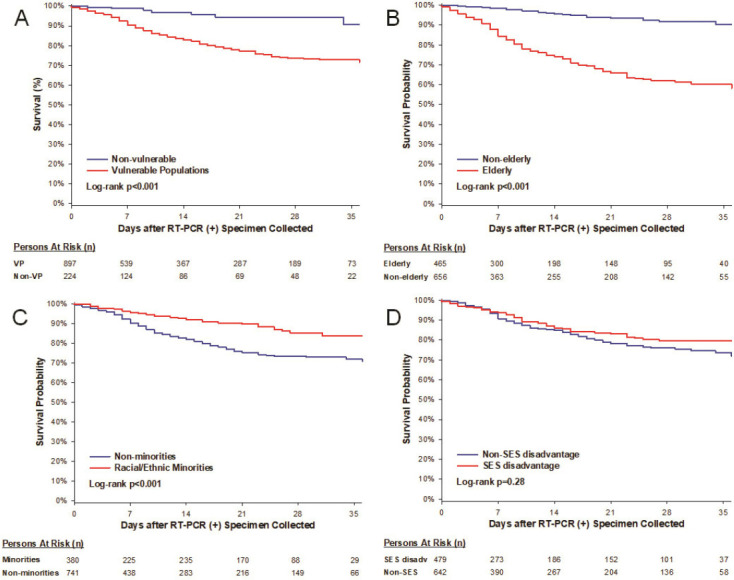
Kaplan-Meier Curves of Mortality from Time of RT-PCR (+) sampling in (A) Vulnerable Populations and Non-vulnerable population and (B-D) as Stratified by Vulnerable Subgroups.
Figure 4.
Unadjusted and Stratified Cox-Proportional Models of Vulnerable Populations and Vulnerable Subgroups for Mortality. Models were adjusted based on potential confounders with p<0.1 from Table 1 and Table 2. *Sex and/or BMI were forced into the models based on a priori knowledge. VP: Stratified by HF and COPD, and adjusted for sex*, BMI≥30 kg/m2*, hypertension, DM, CAD, smoking history, cancer history, chronic renal disease, ACEI/ARB, aspirin, and NSAIDS. Elderly: Stratified by COPD, and adjusted for sex*, BMI≥30 kg/m2, racial/ethnic minority, SES disadvantage, hypertension, DM, CAD, HF, smoking history, asthma, cancer history, HIV, chronic renal disease, ACEI/ARB, aspirin, NSAIDs, and steroids. Racial/Ethnic Minorities: Adjusted for age≥65 years, sex, BMI≥30 kg/m2, SES disadvantage, hypertension, DM, HF, asthma, and chronic renal disease. SES Disadvantage: Adjusted for age≥65 years, sex*, BMI≥30 kg/m2, racial/ethnic minority, HF, COPD, cancer history, HIV, chronic renal disease, and NSAIDs. VP denotes vulnerable populations; SES, socioeconomic status; HR, hazard ratio; CI, confidence interval; body mass index, BMI; coronary artery disease, CAD; chronic obstructive pulmonary disease, COPD; human immunodeficiency virus, HIV; angiotensin-converting enzyme inhibitors/angiotensin II receptor blockers, ACEI/ARB; nonsteroidal anti-inflammatory drugs, NSAIDs.
Moreover, there was a 47% reduction in hazard for mortality when comparing the minority subgroup (adjusted HR 0.53, p=0.004) to non-minorities, and no difference in hazard for SES disadvantage patients (p=0.56) compared to their counterparts. For racial/ethnic minorities, we adjusted for age≥65 years, sex, BMI≥30 kg/m2, SES disadvantage, hypertension, DM, HF, asthma, and chronic renal disease. For SES disadvantage, we adjusted for age≥65 years, sex, BMI≥30 kg/m2, racial/ethnic minorities, HF, COPD, cancer history, HIV, chronic renal disease, and NSAIDs.
When examining the individual components driving mortality, advanced age, white and Asian race, non-Hispanic ethnicity, and those receiving Medicare had highest mortality rates (Figure 5). Supplemental Table 4 depicts the proportion of patients still in the hospital and those who died, as subcategorized by age, race, ethnicity, and SES disadvantage status.
Figure 5.
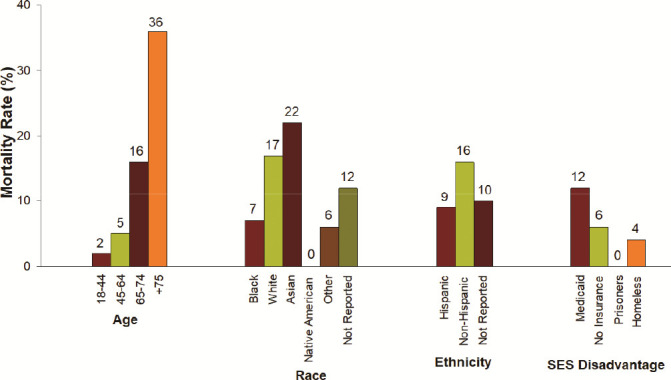
Mortality Rates as Subcategorized by Age, Race, Ethnicity, and SES Disadvantage Status.
Complete Case and Sensitivity Analyses of Racial/Ethnicity Minorities
In our pre-specified analysis for racial/ethnic minorities, we compared self-reported minorities to the rest of the cohort, including those “not reported.” As shown in Figure 4, there were 31 (8%) deaths in the racial/ethnic minority subgroup, with an adjusted HR for mortality of 0.53 (95% confidence interval [CI] 0.34-0.82), p=0.004, after adjustment for age, sex, SES disadvantage status, BMI, HTN, DM, HF, asthma, and renal disease.
Of the 1121 patients, there were 395 (35%) patients who did not disclose their race or ethnicity and were classified as “not reported.” Of the 395 “not reported” patients, there were 45 (11%) deaths.
In a complete case analysis of 726 patients who self-reported their race/ethnicity, we excluded all patients whose race or ethnicity were “not reported.” There were 309 (43%) patients who were minorities and 21 (7%) minority deaths. The adjusted HR for mortality was 0.39 (95% CI 0.23-0.66), p<0.001, after adjustment for age, sex, SES disadvantage status, BMI, HTN, DM, HF, asthma, and renal disease.
In a sensitivity analysis of the 1121 patients, all 395 patients whose race or ethnicity were “not reported” were classified into the minority subgroup, resulting in 704 (63%) patients classified as minorities. In this analysis, there were 66 (9%) minority deaths, with an adjusted HR for mortality of 0.61 (95% CI 0.43-0.86), p=0.005, after adjustment for age, sex, SES disadvantage status, BMI, HTN, DM, HF, asthma, and renal disease.
Mutually Exclusive Four-Group Comparisons
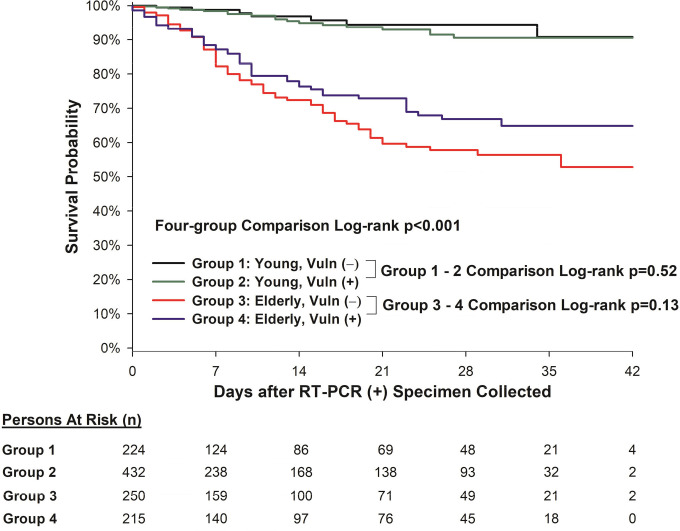
Figure 6 depicts the Kaplan-Meier survival curves of the mutually exclusive four-group comparisons. Group 1 was defined as young (age < 65) and “vulnerable negative” (without either racial/ethnicity minorities nor SES disadvantage). Group 2 was defined as young (age < 65) and “vulnerable positive” (with either self-reported racial/ethnic minorities or classified as having SES disadvantage status, or both). Group 3 was defined as elderly (age ≥ 65) and “vulnerable negative” (without either racial/ethnicity minorities nor SES disadvantage). Group 4 was defined as elderly (age ≥ 65) and “vulnerable positive” (with either self-reported racial/ethnic minorities or classified as having SES disadvantage status, or both). While there were differences in the survival curves amongst all four groups (log-rank p<0.001), there was no difference between young patients who were “vulnerable positive” or “vulnerable negative” (log-rank p=0.52), nor any difference between elderly patients who were “vulnerable positive” or “vulnerable negative” (log-rank p=0.13).
Figure 6.
Kaplan-Meier survival curves of the mutually exclusive four-group comparisons. Group 1: young (age < 65) and “vulnerable negative” (without either racial/ethnicity minorities nor SES disadvantage). Group 2: young (age < 65) and “vulnerable positive” (with either self-reported racial/ethnic minorities or classified as having SES disadvantage status, or both). Group 3: elderly (age ≥ 65) and “vulnerable negative” (without either racial/ethnicity minorities nor SES disadvantage). Group 4: elderly (age ≥ 65) and “vulnerable positive” (with either self-reported racial/ethnic minorities or classified as having SES disadvantage status, or both).
As older patients were prone to having pre-existing co-morbidities and most susceptible to mortality from COVID-19, we performed a subgroup analysis of 465 elderly patients (age ≥65 years). There were 215 (46%) patients in Group 4 who were “vulnerable positive,” and 250 (54%) patients in Group 3 who were “vulnerable negative.” Supplemental Table 1 shows the baseline characteristics between the two groups. There were 114 (25%) deaths amongst these elderly patients. There was no difference in survival amongst elderly patients who were self-reported as a minority or as SES disadvantage (Group 4 “vulnerable positive”) when compared to those who were neither (Group 3 “vulnerable negative”; adjusted HR 0.84, 95% CI 0.55-1.27, p=0.41), after stratification for HF and adjustment for age, sex, BMI≥30, hypertension, DM, chronic renal disease, and ACEI/ARB usage.
DISCUSSION
There are several key findings in our study of 1121 RT-PCR (+) patients during the first month of the COVID-19 crisis in NYC. We found that the elderly patients had higher admission rates with longer hospital length of stay, increased need for ICU care, fewer successful extubations, and most importantly, had higher risk for death when compared to younger patients. As such, imaging utilization was higher in these elderly patients. Racial/ethnic minorities had less ICU admissions and had lower mortality risk, despite similar imaging utilization compared to their non-minority counterparts. SES disadvantage patients had similar outcomes to their non-SES disadvantage counterparts, with similar imaging utilization rates.
In the early stages of the COVID-19 pandemic in NYC, the Centers for Disease Control (CDC) had strict guidelines for who qualified for testing, as there were limited testing capabilities. (12) During the first month of the crisis, the New York City Department of Health and Mental Hygiene issued a health advisory discouraging COVID-19 testing in patients with illness not severe enough to require hospitalization. (13) As a result, our cohort had a high positive test rate of 62% and admission rate of 83%.
It is not surprising that VP, driven by elderly patients, had worse outcomes compared to their counterpart. With advancing age, the immune system is less robust and more susceptible to infectious diseases. (14) In addition, older patients additionally had higher baseline co-morbidities (15) and were dying with COVID-19 and their co-morbidities. However, our analysis showed that even after adjusting for co-morbidities, there remained a >4-fold increase in mortality for elderly patients compared to younger patients. As expected, the imaging utilization rates were higher in the elderly group, which is likely attributable to worsening disease severity and need for mechanical ventilation. When examining our cohort in mutually exclusive four-group comparisons, elderly patients had the highest mortality, irrespective of self-reported racial/ethnic minorities or SES disadvantage status.
Most surprising and unexpected is our finding of better outcomes for racial/ethnic minorities. While it is established that COVID-19 mortality is seen disproportionately among Black Americans (16), in our predominantly hospitalized (83%) cohort, we found that racial/ethnic minorities had a lower hazard of dying compared to their non-minority counterparts, even after adjusting for age, SES disadvantage status, and co-morbidities. Our results were unchanged in both complete case and sensitive analyses to account for patients who did not disclose their race or ethnicity. Our mostly inpatient cohort consisted of a heterogeneous group of people of various races and ethnicities, as expected in the diverse NYC metropolitan area, with self-reported 13% Black race and 21% Hispanic ethnicity. Our findings are in-line with the National Health Interview Survey of 8,405 young adults that found higher vulnerability to severe COVID-19 illness for the white subgroup compared with the Black, Hispanic, and Asian subgroups. (17) Moreover, our findings are not contradictory to the Louisiana cohort of 3481 COVID-19 patients that reported high rates (70.6%) of death in Black patients, but found that Black race was not associated with higher in-hospital mortality compared to white race. (18) Thus, the discrepancy between the CDC report of higher mortality in racial/ethnic minorities and our findings may be theorized as being driven by a combination of higher out-of-hospital mortality and social determinants of health, such as poorer access to healthcare (16, 18, 19).
Our findings reinforce that racial health and social inequities, such a disproportionately high rates of poverty, medical comorbidities, and incarceration rates, are intimately connected and responsible for the disproportionate death rates among minorities, and highlight the importance of equitable access to inpatient medical care (16). While there is known reported racial disparity in imaging utilization rates, (20) minorities received similar imaging utilization compared to non-minorities in our study. Moreover, in addition to lower risk for death, minority subgroups fared better than their counterparts, with fewer ICU admissions, further highlighting the critical role of access to medical care.
Another unexpected finding from our study is no difference in imaging utilization or outcomes including mortality for the SES disadvantage subgroup compared to their counterpart. As there are reports of less resource utilization and worse outcomes for those who are SES disadvantage, (10, 20, 21) it is reassuring that imaging utilization was not affected by SES status in our cohort. Our findings of similar outcomes are of interest given the high prevalence of COVID-19 in SES disadvantage subgroup due to suboptimal living situations such as low-income, high-density neighborhoods/housing, imprisonment, and homelessness(6-8). Furthermore, the increased use of public transportation among SES disadvantage patients (22) may make it difficult for adequate “social distancing,” a key recommendation to mitigate the spread of the disease. It appears that access to inpatient medical care yields similar outcomes to their non-SES disadvantage counterparts. Thus, other social determinants of health and health inequities may be key to alleviating the reported outcomes disparities.
As initially described in the Wuhan cohort, the initial and most visually apparent sequelae of COVID-19 were the pulmonary complications and manifestations. (23, 24) However, despite the potential for overutilization of imaging in COVID-19 patients, our data and experience show that radiology imaging utilization had a more limited role during the first month of the outbreak in NYC. While the vast majority of our patient received some kind of diagnostic imaging, most were portable/bedside studies, such as chest radiographs, ultrasounds, and transthoracic echocardiography. There were surprisingly few chest CTs, and very few to no advanced imaging such as coronary CTA, “triple rule out,” or cardiac/chest MR studies. These findings are a reflection of selective ordering of advanced imaging tests that would not alter management in highly contagious, critically-ill patients during a time when personal protective equipment was limited, and potential exposure to healthcare workers was unknown.
Study Limitations: Our cohort was derived from two large tertiary academic hospitals and ambulatory outpatient practices in Manhattan. Thus, our findings may not be generalizable to other hospitals or practices, particularly underfunded hospitals (25) or different regions of the US. Our findings may be bias to the fact that we are based at large academic centers, which lead to better resource allocation and possibly a different patient population than in non-university community hospitals. Our cohort represented symptomatic patients who had RT-PCR (+) during the first month of the pandemic in NYC when the testing availability was limited and thus may not reflect a later time period of the crisis or those suspected COVID-19 patients who were not tested or tested negative. While the RT-PCR sensitivity is known to be modest, (26) we included patients with up to 5 RT-PCR tests. As many would consider patients with chronic illnesses “vulnerable”, we did not include them in our definition of VP since that would result in lack of a sizable comparator non-vulnerable group. Instead, we captured baseline co-morbidities and adjusted for them in our survival analyses, thus our results are less likely explained by the influence of confounding covariates. While our race/ethnicity analyses should be interpreted with caution, as approximately 1/3 of patients did not report race or ethnicity, we performed both complete case and sensitivity analyses to account for the “not reported” cases and found similar results amongst all the analyses. Patients may be inclined to not disclose their race or ethnicity for a multitude of reasons, and this is beyond the scope of our study. We acknowledge that the definition of SES is more expansive, such as education level, salary/wages, and even immigration status. However, this information is not typically available in the electronic medical records. Incorporation bias is likely present in our study, as imaging studies were likely used to decide if a patient needed to be admitted to the hospital or ICU versus discharged. Future studies designed to compare different types of health systems and clinical practices may provide further insight on the relationship between imaging utilization and outcomes. Additional studies to examine the social determinants of health on racial/ethnic minorities and SES disadvantage patients are warranted.
CONCLUSION
In a predominantly hospitalized RT-PCR (+) cohort in NYC, elderly patients have the highest mortality risk, in contrast to racial/ethnic minorities with lower mortality risk. SES disadvantage subgroup fares similarly to their counterparts. Imaging utilization rates mirror the mortality risk, and are driven by portable/bedside imaging studies. Our findings provide further support that elderly patients are the most vulnerable for adverse outcomes from COVID-19, which should be taken into consideration as COVID-19 continues to remain a highly contagious and threatening health risk worldwide. Additionally, our study highlights the importance of access to inpatient medical care for all, particularly racial/ethnic minorities and SES disadvantage patients.
Disclosures: All authors have no disclosures.
D.T. and S.S.M. contributed equally to this work.
Journal Subject Codes: Infectious diseases/SARS; Health systems and health services research/Health disparities; Health systems and health services research/Race-ethnicity; Health systems and health services research/Access to care
Funding Sources: This study received support from NewYork-Presbyterian Hospital (NYPH) and Weill Cornell Medical College (WCMC), including the Clinical and Translational Science Center (CTSC) (UL1 TR000457) and Joint Clinical Trials Office (JCTO). Dr. Mahmood reports grant research support from the New York Academy of Medicine.
Abbreviations:
- COVID-19
- Coronavirus disease 2019
- CT
- Computed tomography
- ICU
- Intensive care unit
- MR
- Magnetic resonance imaging
- NYC
- New York City
- RT-PCR
- Reverse-transcriptase polymerase chain reaction
- SES
- Socioeconomic status
- US
- Ultrasound
- SARS-CoV-2
- Severe acute respiratory syndrome coronavirus 2
- VP
- Vulnerable populations
REFERENCES
- 1.McKinley J. New York City Region Is Now an Epicenter of the Coronavirus Pandemic. The New York Times. Published March 22, 2020.
- 2.Hawkins D, Michael B, Kornfield M, Siobhán OG, Kareem C, Iati M, Sonmez F. Arizona, Florida, Texas are latest coronavirus epicenters. The Washington Post. Published June 29, 2020.
- 3.Harris A. It Pays to Be Rich During a Pandemic. Atlantic Online. Published March 15, 2020.
- 4.Yancy CW. COVID-19 and African Americans. JAMA 2020. doi: 10.1001/jama.2020.6548 [DOI] [PubMed] [Google Scholar]
- 5.Wadhera RK, Wadhera P, Gaba P, Figueroa JF, Joynt Maddox KE, Yeh RW, Shen C. Variation in COVID-19 Hospitalizations and Deaths Across New York City Boroughs. JAMA 2020. doi: 10.1001/jama.2020.7197 [DOI] [PMC free article] [PubMed] [Google Scholar]
- 6.Arons MM, Hatfield KM, Reddy SC, Kimball A, James A, Jacobs JR, Taylor J, Spicer K, Bardossy AC, Oakley LP, Tanwar S, Dyal JW, Harney J, Chisty Z, Bell JM, Methner M, Paul P, Carlson CM, McLaughlin HP, Thornburg N, Tong S, Tamin A, Tao Y, Uehara A, Harcourt J, Clark S, Brostrom-Smith C, Page LC, Kay M, Lewis J, Montgomery P, Stone ND, Clark TA, Honein MA, Duchin JS, Jernigan JA. Presymptomatic SARS-CoV-2 Infections and Transmission in a Skilled Nursing Facility. N Engl J Med 2020. doi: 10.1056/NEJMoa2008457 [DOI] [PMC free article] [PubMed] [Google Scholar]
- 7.Hawks L, Woolhandler S, McCormick D. COVID-19 in Prisons and Jails in the United States. JAMA Intern Med 2020. doi: 10.1001/jamainternmed.2020.1856 [DOI] [PubMed] [Google Scholar]
- 8.Baggett TP, Keyes H, Sporn N, Gaeta JM. Prevalence of SARS-CoV-2 Infection in Residents of a Large Homeless Shelter in Boston. JAMA 2020. doi: 10.1001/jama.2020.6887 [DOI] [PMC free article] [PubMed] [Google Scholar]
- 9.Owen WF, Jr., Carmona R, Pomeroy C. Failing Another National Stress Test on Health Disparities. JAMA 2020. doi: 10.1001/jama.2020.6547 [DOI] [PubMed] [Google Scholar]
- 10.Wilson C. These Graphs Show How COVID-19 Is Ravaging New York City’s Low-Income Neighbhorhoods. Time. Published April 15, 2020.
- 11.Mehrotra A, Chernew M, Linetsky D, Hatch H, Cutler D. What Impact Has COVID-19 Had on Outpatient Visits? To the Point: Commonwealth Fund, April 23, 2020.
- 12.Shear MD, Goodnough A, Kaplan S, Fink S, Thomas K, Weiland N. The Lost Month: How a Failure to Test Blinded the U.S. to Covid-19. The New York Times. Published April 1, 2020.
- 13.Daskalakis D. 2020 Advisory #8 COVID-19 Update for New York City. New York City Department of Health and Mental Hygiene, March 20, 2020. [Google Scholar]
- 14.Thompson WW, Shay DK, Weintraub E, Brammer L, Cox N, Anderson LJ, Fukuda K. Mortality associated with influenza and respiratory syncytial virus in the United States. JAMA 2003;289(2):179-186. doi: 10.1001/jama.289.2.179 [DOI] [PubMed] [Google Scholar]
- 15.Mehra MR, Desai SS, Kuy S, Henry TD, Patel AN. Cardiovascular Disease, Drug Therapy, and Mortality in Covid-19. N Engl J Med 2020. doi: 10.1056/NEJMoa2007621 [DOI] [PMC free article] [PubMed] [Google Scholar] [Retracted]
- 16.Brooks RA. African Americans struggle with disproportionate COVID death toll. National Geographic April 24, 2020.
- 17.Adams SH, Park MJ, Schaub JP, Brindis CD, Irwin CE, Jr. Medical Vulnerability of Young Adults to Severe COVID-19 Illness-Data From the National Health Interview Survey. J Adolesc Health 2020. doi: 10.1016/j.jadohealth.2020.06.025 [DOI] [PMC free article] [PubMed] [Google Scholar]
- 18.Price-Haywood EG, Burton J, Fort D, Seoane L. Hospitalization and Mortality among Black Patients and White Patients with Covid-19. N Engl J Med 2020;382(26):2534-2543. doi: 10.1056/NEJMsa2011686 [DOI] [PMC free article] [PubMed] [Google Scholar]
- 19.Wortham JM, Lee JT, Althomsons S, Latash J, Davidson A, Guerra K, Murray K, McGibbon E, Pichardo C, Toro B, Li L, Paladini M, Eddy ML, Reilly KH, McHugh L, Thomas D, Tsai S, Ojo M, Rolland S, Bhat M, Hutchinson K, Sabel J, Eckel S, Collins J, Donovan C, Cope A, Kawasaki B, McLafferty S, Alden N, Herlihy R, Barbeau B, Dunn AC, Clark C, Pontones P, McLafferty ML, Sidelinger DE, Krueger A, Kollmann L, Larson L, Holzbauer S, Lynfield R, Westergaard R, Crawford R, Zhao L, Bressler JM, Read JS, Dunn J, Lewis A, Richardson G, Hand J, Sokol T, Adkins SH, Leitgeb B, Pindyck T, Eure T, Wong K, Datta D, Appiah GD, Brown J, Traxler R, Koumans EH, Reagan-Steiner S. Characteristics of Persons Who Died with COVID-19 - United States, February 12-May 18, 2020. MMWR Morb Mortal Wkly Rep 2020;69(28):923-929. doi: 10.15585/mmwr.mm6928e1 [DOI] [PubMed] [Google Scholar]
- 20.Schrager JD, Patzer RE, Kim JJ, Pitts SR, Chokshi FH, Phillips JS, Zhang X. Racial and Ethnic Differences in Diagnostic Imaging Utilization During Adult Emergency Department Visits in the United States, 2005 to 2014. J Am Coll Radiol 2019;16(8):1036-1045. doi: 10.1016/j.jacr.2019.03.002 [DOI] [PubMed] [Google Scholar]
- 21.Brinjikji W, El-Sayed AM, Rabinstein AA, McDonald JS, Cloft HJ. Disparities in imaging utilization for acute ischemic stroke based on patient insurance status. AJR Am J Roentgenol 2014;203(2):372-376. doi: 10.2214/AJR.13.12008 [DOI] [PubMed] [Google Scholar]
- 22.Goldbaum C, Cook LR. They Canʼt Afford to Quarantine. So They Brave the Subway. The New York Times. Published March 30, 2020. [Google Scholar]
- 23.Bernheim A, Mei X, Huang M, Yang Y, Fayad ZA, Zhang N, Diao K, Lin B, Zhu X, Li K, Li S, Shan H, Jacobi A, Chung M. Chest CT Findings in Coronavirus Disease-19 (COVID-19): Relationship to Duration of Infection. Radiology 2020:200463. doi: 10.1148/radiol.2020200463 [DOI] [PMC free article] [PubMed] [Google Scholar]
- 24.Huang C, Wang Y, Li X, Ren L, Zhao J, Hu Y, Zhang L, Fan G, Xu J, Gu X, Cheng Z, Yu T, Xia J, Wei Y, Wu W, Xie X, Yin W, Li H, Liu M, Xiao Y, Gao H, Guo L, Xie J, Wang G, Jiang R, Gao Z, Jin Q, Wang J, Cao B. Clinical features of patients infected with 2019 novel coronavirus in Wuhan, China. The Lancet 2020. doi: 10.1016/s0140-6736(20)30183-5 [DOI] [PMC free article] [PubMed] [Google Scholar]
- 25.Rosenthal BM, Goldstein J, Otterman S, Fink S. Why Surviving the Virus Might Come Down to Which Hospital Admits You. The New York Times. Published July 1, 2020.
- 26.West CP, Montori VM, Sampathkumar P. COVID-19 Testing: The Threat of False-Negative Results. Mayo Clin Proc 2020. doi: 10.1016/j.mayocp.2020.04.004 [DOI] [PMC free article] [PubMed] [Google Scholar]


