

Abstract
Aims:
To examine the cost-effectiveness of hepatitis C (HCV) treatment of people who inject drugs (PWID), combined with medication-assisted treatment (MAT) and syringe-service programs (SSP), to tackle the increasing HCV epidemic in the United States.
Design:
HCV-transmission and disease progression models with cost-effectiveness analysis using a health care perspective and measuring benefits in quality-adjusted life-years (QALYs).
Setting:
Rural Perry County, Kentucky (PC), and urban San Francisco, California (SF),USA. Compared with PC, SF has a greater proportion of PWID with access to MAT or SSP. HCV treatment of PWID is negligible in both settings.
Participants:
PWID, data collected between 1998 and 2015 from Social Networks Among Appalachian People, U Find Out, Urban Health Study, and National HIV Behavioral Surveillance System studies.
Measurements:
Three intervention scenarios modeled: baseline—existing SSP and MAT coverage with HCV screening and treatment with direct-acting antiviral for ex-injectors only as per standard of care; Intervention 1—scale-up of SSP and MAT without changes to treatment; and Intervention 2—scale-up as Intervention 1 combined with HCV screening and treatment for current PWID. Incremental cost-effectiveness ratios (ICERs) and uncertainty using cost-effectiveness acceptability curves.
Findings:
For both settings, Intervention 2 is preferred to Intervention 1 and the appropriate comparator for Intervention 2 is the baseline scenario. Relative to baseline, for PC Intervention 2 averts 1,852 more HCV infections, increases QALYS by 3,095, costs $21.6 million more, and has an ICER of $6,975/QALY. For SF, Intervention 2 averts 36,473 more HCV infections, increases QALYs by 78,93, costs $ 872 million more, and has an ICER of $11,044/QALY. The cost-effectiveness of Intervention 2 was robust to several sensitivity analysis.
Conclusions:
Hepatitis C screening and treatment for people who inject drugs, combined with medication-assisted treatment and syringe-service programs, is a cost-effective strategy for reducing hepatitis C burden in the United States.
Keywords: Hepatitis C, persons who inject drugs, opioid, modeling, cost-effectiveness analysis, medication-assisted treatment, syringe-service programs, direct-acting-antiviral HCV treatment
INTRODUCTION
Hepatitis C virus (HCV) is a blood-borne virus that usually results in life-long chronic infection that can lead to liver disease and death. In 2010, an estimated 3.5 million Americans had chronic HCV infection [1], and in 2015 there were 19,629 deaths reported to CDC with HCV listed on the death certificate [2]. If not addressed, the HCV-associated cost burden will remain substantial. Total healthcare cost associated with HCV infection was $6.5 billion in 2011, with an expected peak in 2024 at $9.1 billion [3].
HCV is primarily transmitted through injection drug use in the United States [4], with a seroprevalence above 50% among people who inject drugs (PWID) [5–8]. Many parts of the United States, particularly rural areas, are experiencing an epidemic of prescription and illicit opioid use, including heroin and fentanyl, with corresponding large increases in HCV infection [9, 10].
A recent treatment revolution brought new direct-acting antiviral treatments (DAAs) for HCV infection, with high efficacy (sustained viral response [SVR] or cure rate > 90%), short duration (8–12 weeks) and few side-effects [11]. Although prices have dramatically declined, the high treatment cost ($26,400 for the cheapest pan-genotype drug approved so far [12]) and the large number needing treatment raise questions of affordability for scaling up treatment rates.
Guidelines recommend infected individuals to be treated [11]. However, payer policies deter HCV treatment for PWID [13]. Medication-assisted treatment (MAT, principally methadone or buprenorphine) and syringe-service programs (SSPs) can reduce the risk of HCV acquisition among PWID. Combining MAT and SSP with HCV treatment can impact both incidence and prevalence of HCV infection, and may be more effective in reducing the transmission of HCV among PWID than any one of those strategies alone [14]. Therefore, a comprehensive approach to cost-effectiveness assessment necessitates inclusion of comprehensive programs comprised of MAT, SSP and HCV screening and treatment.
The objective of this analysis is to evaluate the cost-effectiveness of scaling up MAT and SSP paired with or without HCV screening and DAA treatment for PWID. We evaluated these interventions in one rural and one urban U.S. setting.
METHODS
Model Description
Our analysis uses two validated dynamic, deterministic, compartmental models of HCV-transmission and disease progression among current and ex-PWID [15]. One model is used for Perry County, Kentucky (PC), and the other is used for San Francisco (SF). The models used for the two locations vary slightly, reflecting different demographics and injecting drug use dynamics. Models were stratified by age (SF) or injection duration (PC); intervention status (MAT, SSP, or no intervention); and low- or high-risk behavior (defined as sharing injection equipment in the past 6 months). The rate of HCV transmission depends on the prevalence of HCV among the PWID population, MAT/SSP status, HCV treatment status, low- or high-risk status, and age or injection duration. Once infected, individuals either spontaneously clear infection or develop life-long chronic infection. However, if diagnosed, most people who are HCV-infected, including PWID, may receive antiviral treatment. People who achieve SVR are no longer infectious but may become re-infected at the same rate as susceptible PWID and can then be re-treated.
Population
We separately modeled the PWID population in urban SF and rural PC. These locations characterize two types of U.S. PWID populations; SF has an older stable population of PWID who primarily inject heroin with relatively high coverage of SSP and moderate coverage of MAT [16, 17]; whereas PC’s PWID population is young and increasing, primarily injects prescription opioids, and has no SSP (after model building an SSP has been in place since April 2, 2018) and limited MAT [5, 18].
Model Parameterization
The PC model used data from the Social Networks Among Appalachian People (SNAP) cohort study [5], which recruited PWID in PC. The model assumed an increasing PWID population size between 1990 and 2000 with an estimated 700 PWID in 2009. At baseline, MAT coverage was assumed to be low (4.7%) with no SSP or HCV treatment for current PWID. In 2009, the HCV seroprevalence among PWID was 53.3% and HCV incidence during follow-up (2008–2015) was 18.3 per 100 person-years (pyrs).
The SF model was parameterized to data from the UFO study [19, 20], the National HIV Behavioral Surveillance System (NHBS) [21], and the Urban Health Study (UHS) [22]. The model assumed an aging (20% of PWID < 30 years old) and slowly decreasing PWID population, with an estimated 30,000 PWID in 2007 [18]. At baseline, MAT coverage was assumed to be low-moderate (12%), with high SSP coverage since the late 90s (84%), but no HCV treatment for current PWID. In the absence of recent data, UHS data from 1998–2000 estimated the HCV seroprevalence among PWID younger than 30 as 60.8%, those 30 to 49 as 93.5%, and those older than 50 as 96.3% [22]. The HCV incidence among PWID younger than 30 years was 25.1 per 100pyrs in 2001, remaining stable since then [23, 24].
For both models, we assume MAT and SSP reduce HCV transmission risk based on a recent Cochrane review [25], by 50% and 56% for MAT and SSP on their own, respectively, and by 72% if on both (product of the risk ratios). The SVR rate of DAAs was varied between 85–95% (Table 1).
Table 1.
Model Parameters: Treatment Effects, Costs and Utilities
| Perry County | San Francisco | ||||
|---|---|---|---|---|---|
| Input Parameter | Value | Distribution (a,b) | Value | Distribution (a,b) | Reference |
| Effect of MAT, SSP and DAAs | |||||
| Relative risk of acquiring HCV while on MAT | 0.5 | Log-normal (−0.69, 0.013) | 0.5 | Log-normal (−0.69, 0.013) | Platt et al., 2017 [25] |
| Relative risk of acquiring HCV while on SSP | 0.44 | Log-normal (−0.82, 0.094) | 0.44 | Log-normal (−0.82, 0.094) | Platt et al., 2017 [25] |
| Relative risk of acquiring HCV while on MAT+SSP | Product of relative risk for MAT and SSP | ||||
| DAA SVR rate | 85–95% | Uniform | 85–95% | Uniform | AASL 2017 [11] |
| Screening and diagnosis costs, 2016 USD | |||||
| Screening with rapid test (negative result) | 35 | Gamma (15, 2) | 28 | Gamma (15, 2) | Cipriano et al., 2012 [32]; Medicaid, 2016 [33]; SAMHSA 2016 [35] |
| Screening with rapid test (positive result) and diagnosis (negative RNA) | 105 | Gamma (15, 7) | 79 | Gamma (15, 5) | |
| Screening with rapid test (positive result) and diagnosis (positive RNA) and labs | 569 | Gamma (15, 37) | 375 | Gamma (15, 24) | |
| MAT and SSP per person costs, 2016 USD | |||||
| Methadone treatment, per day | 14 | Gamma (198, 0) | 14 | Gamma (198, 0) | Jackson et al., 2015 [36] |
| SSP, per year | 127 | Gamma (15, 8) | 127 | Gamma (15, 8) | Nguyen et al., 2014 [37]; Bluthenthal et al., 2015 [84]; personal communication with Michael Discepola (2016) and Henry Fisher Raymond (2015) |
| HCV treatment per person costs, 2016 USD | |||||
| Antiviral therapy | 58,906 | Gamma (3, 17381) | 59,466 | Gamma (3, 17371) | AASL 2017 [11], Medicaid, 2016 [33] |
| HCV treatment monitoring (12 weeks) | 443 | Gamma (15, 29) | 274 | Gamma (15, 18) | |
| Complications costs | |||||
| F0-F4 (without antiviral treatment) | 793 | Gamma (2, 330) | 793 | Gamma (2, 330) | Rein et al., 2015 [38] |
| CC (without antiviral treatment) | 1,509 | Gamma (9, 161) | 1,509 | Gamma (9, 161) | |
| DC (without antiviral treatment) | 20,348 | Gamma (39, 517) | 20,348 | Gamma (39, 517) | |
| HCC | 42,833 | Gamma (73, 588) | 42,833 | Gamma (73, 588) | |
| 1 year after liver transplant | 200,458 | Gamma (80, 2,512) | 200,458 | Gamma (80, 2,512) | |
| >1 year after liver transplant | 36,203 | Gamma (148, 245) | 36,203 | Gamma (148, 245) | |
| Annual monitoring cost after SVR | 237 | Gamma (4, 61) | 237 | Gamma (4, 61) | |
| Utilities | |||||
| Quality-of-life multipliers for each health state | |||||
| IFN-free therapy-related multiplier | 0.95 | Beta (108, 6) | 0.95 | Beta (108, 6) | Chong et al. [39]; Chhatwal et al. [40] |
| F0, F1 | 0.93 | Beta (47, 4) | 0.93 | Beta (47, 4) | |
| F2, F3 | 0.93 | Beta (47, 4) | 0.93 | Beta (47, 4) | |
| Compensated Cirrhosis | 0.9 | Beta (31,3) | 0.9 | Beta (31,3) | |
| DC | 0.8 | Beta (12, 3) | 0.8 | Beta (12, 3) | |
| HCC | 0.79 | Beta (11, 3) | 0.79 | Beta (11, 3) | |
| First year, post-liver transplant | 0.84 | Beta (54, 10) | 0.84 | Beta (54, 10) | |
| Post SVR | 1 | Beta (3,834, 4) | 1 | Beta (3834, 4) | |
| Quality-of-life multipliers for PWID | |||||
| PWID not on MAT | 0.8 | — | 0.8 | — | Zaric et al., 2000 [42] |
| PWID on MAT | 0.9 | — | 0.9 | — | |
| PWID on SSP | 0.8 | — | 0.8 | — | Assumed |
CC = compensated cirrhosis; DAA= direct-acting antiviral treatments; DC = decompensated cirrhosis; HCC = hepatocellular carcinoma; HCV = hepatitis C virus; MAT = medication-assisted treatment; PWID = people who inject drugs; SSP = syringe-service program; SVR = sustained viral response
Model Calibration
Five thousand parameter sets were sampled from the parameter uncertainty ranges for each setting. First, each model was initially calibrated to population demographics in each setting, which allowed for injecting increases in the 1990s in PC but decreases in SF. Second both models were fit to the coverage of MAT and SSP in each setting and the proportion of PWID at high risk. Lastly, the PC model was fitted to the HCV seroprevalence among PWID injecting for less than 3 years, and the SF model to the HCV incidence in PWID younger than 30 and seroprevalence in PWID older than 50. Model projections were validated with prevalence in those injecting over three years and HCV incidence in PC, and prevalence in those aged under 30 in SF. More details on model structure, parameterization and calibration are in the accompanying paper and summarized in Appendix 1.
Intervention Scenarios
The time horizon for our analyses was 10 years of intervention (2017–2026) followed by 50-year follow-up (2027–2076) at baseline levels of intervention coverage to capture long-term prevention and morbidity benefits. For our main analysis, we considered three intervention scenarios:
Baseline: Maintain current levels of SSP (0% in PC and 84% in SF) and MAT (4.7% in PC and 12% in SF) with existing HCV care and treatment. This includes usual HCV screening and treatment with DAAs for persons who formerly injected drugs but not for those currently injecting. For persons who formerly injected drugs, this includes annual screening of 2%–10% for persons with asymptomatic disease (fibrosis stages F0–F3) and 25%–50% for persons with more progressed disease [26–28], followed by treatment of 10%–20% for any diagnosed individual [29–31].
Intervention 1 (Scale-up MAT and SSP): Scale-up of SSP (only applicable for PC) and MAT to 50% coverage with no change in screening and treatment rates.
Intervention 2 (Scale-up MAT and SSP plus HCV treatment for PWID): Scale-up of SSP and MAT as for Intervention 1, plus annual screening of 90% of PWID for HCV, followed by treatment with DAAs for 90% of diagnosed PWID.
Costs and Health Outcomes
The perspective on costs was that of the third-party payer (2016 prices). The model included costs for HCV screening with a rapid test, laboratory-confirmatory testing (RNA test) for all positives, and other laboratory tests (markers of liver disease) for all diagnosed individuals [32–35]. Existing studies were used to get the costs of MAT with methadone [36] and the costs of SSP [37]. HCV treatment costs included the current average cost of DAAs and costs for treatment monitoring [11, 33]. The model also included the estimated health care costs associated with different HCV-related disease stages [38], and annual monitoring costs after achieving SVR [38]. Input costs and sources are in Table 1 with more details in Appendix 2.
Main model health outcomes were the number of new HCV infections and quality-adjusted life-years (QALYs). QALYs were estimated using existing Canadian utility weights unadjusted by the Canadian population norm [39, 40], adjusted both to the U.S. population [41], and to account for lower utilities among PWID (than general population) which are heightened among PWID on MAT [42] (see Table 1). All costs and QALYs were discounted at 3% annually.
Cost-Effectiveness Analysis
Incremental cost-effectiveness ratios (ICERs; additional cost to gain one QALY) comparing non-dominated scenarios were estimated [43]. A scenario is dominated (i.e. not cost-effective) if it is more expensive and less effective (strict dominance) than another, or if it has a higher ICER than a more costly intervention (extended dominance)[44]. The preferred scenario is determined by comparing the ICER with what decision makers are willing to pay for an additional QALY. There is no consensus on decision makers’ willingness-to-pay (WTP) in the United States, although a threshold of $50,000 to $100,000 per QALY saved has been used elsewhere [45, 46].
Uncertainty in the model projections was assessed using cost-effectiveness acceptability curves (CEACs) to graphically show the probability that each strategy is the most cost-effective based on different WTP thresholds [43, 44]. Uncertainty distributions for each parameter are given in Table 1 (costs and utilities) and Appendix 2 (other parameters). Five thousand parameter draws were randomly sampled from these distributions, and the model was run for each scenario to give a distribution of model outcomes. The analysis conformed to good practice guidelines on cost-effectiveness analyses [47].
Sensitivity Analyses
We conducted 9 one-way sensitivity analyses to test the robustness of our results to variations in key parameters. 1. To account for further reductions in the cost of DAAs due to the recent announcement of generic DAAs [48], we reduced the cost of DAAs by 25%, 50%, and 75%. 2. To analyze the impact of lower DAA effectiveness, the SVR rate was reduced from between 85–95% to between 70% and 80%. 3. The impact of the time horizon of the analysis was assessed by changing it from 60 years to 35 and 110 years (maintaining 10 years of intervention). 4. Intervention 2 includes nearly universal screening (90%) and HCV treatment uptake (90%), based on current guidelines. We considered less favorable assumption for screening (45%) and treatment uptake (45%). 5. We conducted 3 separate sensitivity analysis on our utility values. 5.1 We assessed the impact of using lower utility values, as reported in Wittenberg et al. [49], for PWID not in MAT (0.574 instead of base-case 0.8), and PWID in MAT (0.722 instead of base-case 0.9). 5.2 We also assessed the impact of using the minimum quality of life estimator with our baseline utility values, which assigns the lower individual value of multiple co-morbid conditions in this population [50]. 5.3 Finally, we assessed the impact of using both lower utility values and the minimum quality of life estimator. 6. Because the time constraints of pretest counseling make its widespread adoption unlikely, we conducted a sensitivity analysis that excluded the cost of pre-test counseling ($16) from screening costs. 7. To account for the possibility of higher treatment rates for diagnosed persons who formerly injected drugs, we assumed 53.8% of diagnosed persons who formerly injected drugs would be treated (Yea-Hung Chen, personal communication 2019), instead of the base-case assumptions of only 10–20% [29–31]. 8. To account for a possible lower HCV prevalence in San Francisco, for those older than 50 we changed the base-case value of 96% to 75.6% (64.6% – 86.6%), based on the results of rapid testing from the latest 2018 NHBS round [51] which reported prevalence using voluntary testing. 9. Finally, we assessed the impact of accounting for an increased risk of death in the four weeks before and after starting MAT [52].
To ascertain which parameters were most important in contributing to the uncertainty in the incremental cost and QALYs gained, we performed analyses of covariance (ANCOVA) [53–55]. The proportion of the sum of squares contributed by each parameter was calculated to determine the importance of each parameter on outcome’s variability.
RESULTS
Cost-effectiveness Analysis
Table 2 presents the number of infections, QALYs, costs and ICER for each setting. Other base-case outcomes associated with each strategy, including life-years, numbers reached, cumulative number of complications, and disaggregated costs, are in Appendix 3.
Table 2.
Base-Case Number of New Infections and Cost-Effectiveness Results for Baseline, MAT+SSP scale-up, and MAT+SSP scale-up with HCV Screening and Treatment Scenarios
| Number of New Infections* | Cost (2016 USD) | QALY | ICER (Inc cost/Inc QALY) Intervention 2 vs. baseline** | |
|---|---|---|---|---|
| Kentucky | ||||
| Baseline | 4,158 | $42,870,668 | 46,779 | |
| Intervention 1 MAT+SSP | 3,907 | $57,010,657 | 47,531 | |
| Intervention 2 MAT+SSP+HCV treat PWID | 2,306 | $64,456,601 | 49,874 | $6,975 |
| San Francisco | ||||
| Baseline | 42,221 | $1,610,582,798 | 706,637 | |
| Intervention 1 MAT+SSP | 41,175 | $1,996,599,159 | 714,536 | |
| Intervention 2 MAT+SSP+HCV treat PWID | 5,748 | $2,482,369,200 | 785,576 | $11,044 |
DAA = direct-acting antiviral agent; HCV = hepatitis C virus; ICER = incremental cost-effectiveness ratio; MAT = medication-assisted treatment; QALY = quality-adjusted life-year; SSP = syringe-service program; PWID = people who inject drugs.
Small impact of MAT+SSP on number of new infections is due to the bounce back in the HCV epidemic in both settings after 10 years of intervention, such that most infections averted become re-infected throughout the 50-year follow-up. HCV treatment achieves more impact in terms of percentage of HCV infections averted in San Francisco due to the much slower bounce back in that epidemic after treatment ceases (Figure A3–1).
Intervention 1 is not cost-effective because of extended dominance (i.e., the ICER of Intervention 1 vs baseline is higher than the ICER of Intervention 2 versus Intervention 1)
All estimates are over a 60-year time horizon, the scale-up of MAT+SSP and the screening and HCV treatment lasts 10 years; costs and QALYs discounted at 3% annual rate, 2016 prices. Intervention 1 is weakly dominated by Intervention 2 in both settings. Baseline: current levels of SSP and MAT with limited, usual care, annual screening and HCV treatment with DAAs for persons who formerly injected drugs; Intervention 1: scale-up of SSP and MAT to 50% for 10 years with the same level of screening and HCV treatment for persons who formerly injected drugs as in baseline; Intervention 2: scale-up of SSP and MAT, plus annually screening 90% of PWID for HCV, followed by HCV treatment with DAAs for 90% of persons found to be chronically infected.
In both PC and SF, Intervention 1 is not cost-effective (Intervention 2 is preferred through extended dominance) and the appropriate comparator for Intervention 2 is the baseline scenario. For PC, relative to baseline, Intervention 2 averted 1,852 more HCV infections and gained 3,095 QALYS, for an additional cost of $21.6 million, and an ICER of $6,975 per QALY gained. For SF, relative to baseline, Intervention 2 averted 36,473 more HCV infections and gained 78,939 QALYs, for an additional costs of $ 872 million, and an ICER of $11,044 per QALY gained.
Figure 1a shows that in PC the baseline scenario is the most cost-effective intervention for WTP values below $6,000 per QALY. For WTP values above $6,000, scale-up of MAT and SSP and HCV screening and treatment for PWID (Intervention 2) becomes most cost-effective and achieves a higher than 95% probability of being cost-effective for WTP values above $19,000 per QALY gained. Figure 1b shows that in SF, the baseline scenario is the most cost-effective intervention for WTP values below $10,000 per QALY, after which Intervention 2 is more cost-effective, achieving a higher than 95% probability of being cost-effective for WTP values above $28,000 per QALY.
Figure 1. Base-case results for Kentucky (a) and San Francisco (b) in the form of cost-effectiveness acceptability curves (CEACs).
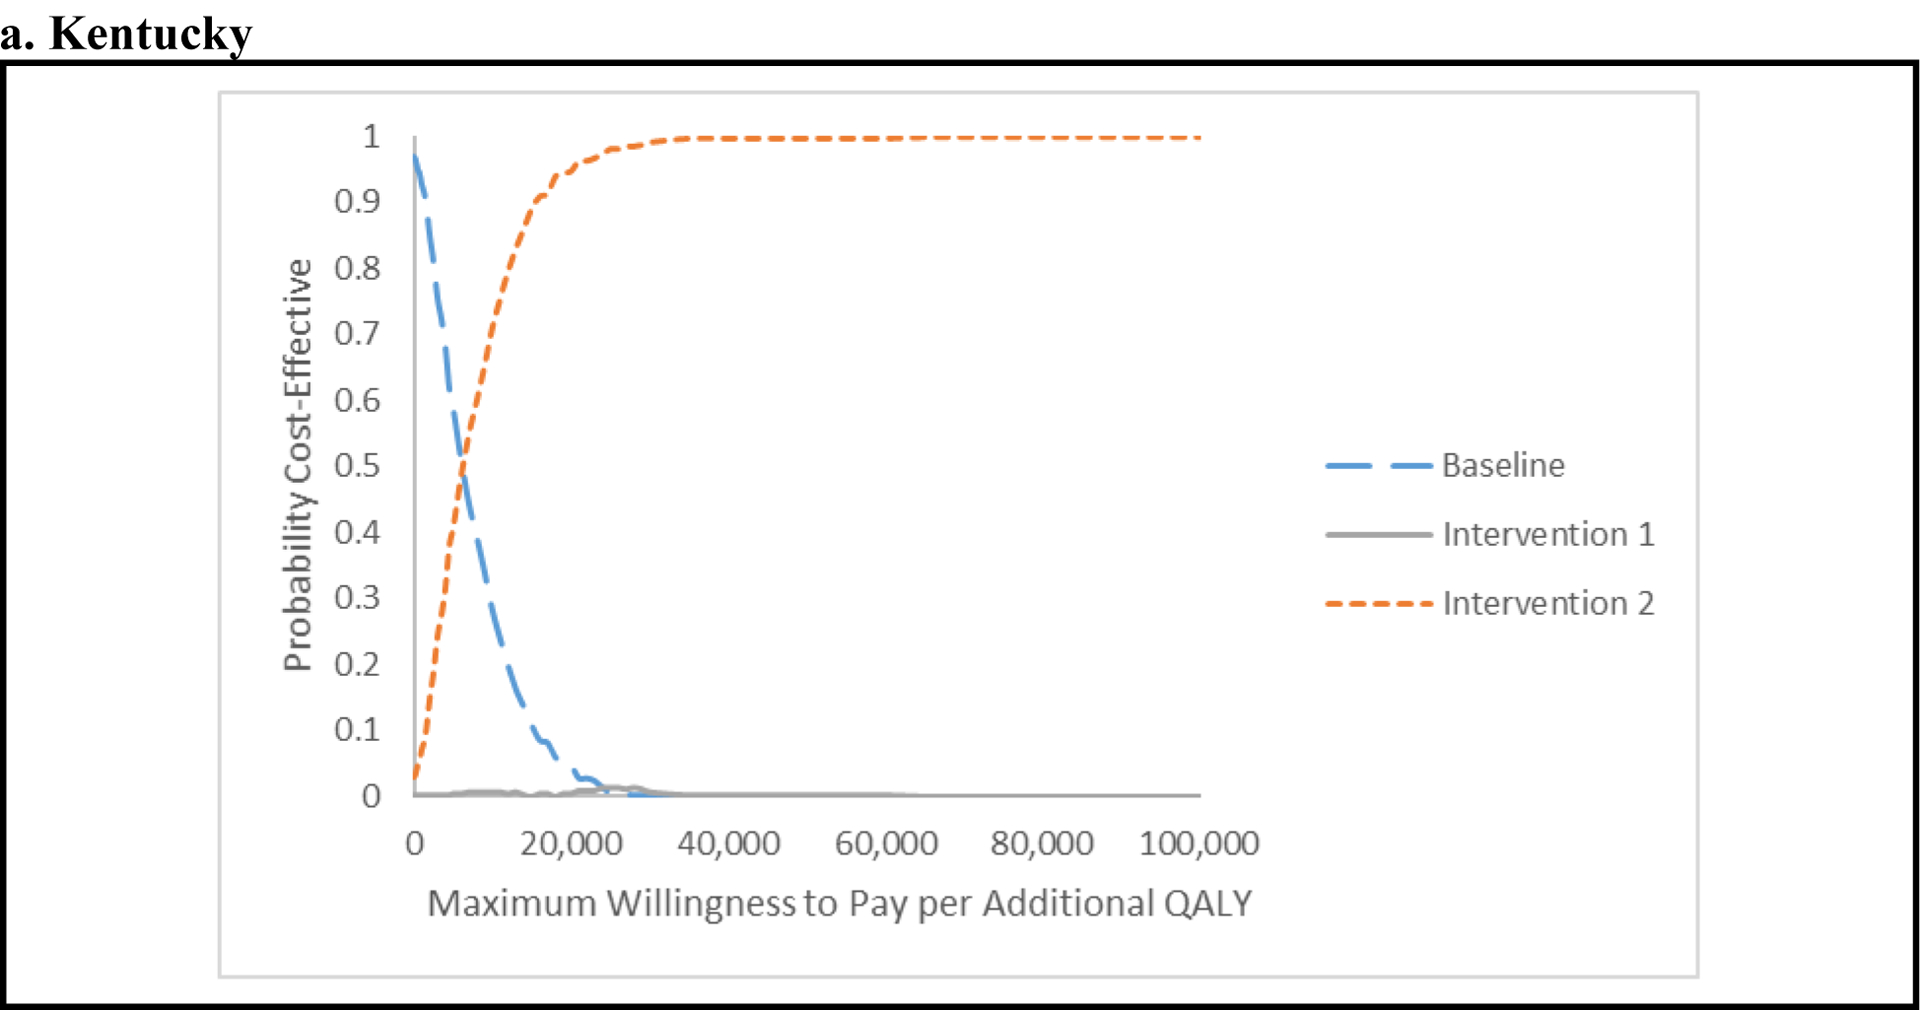
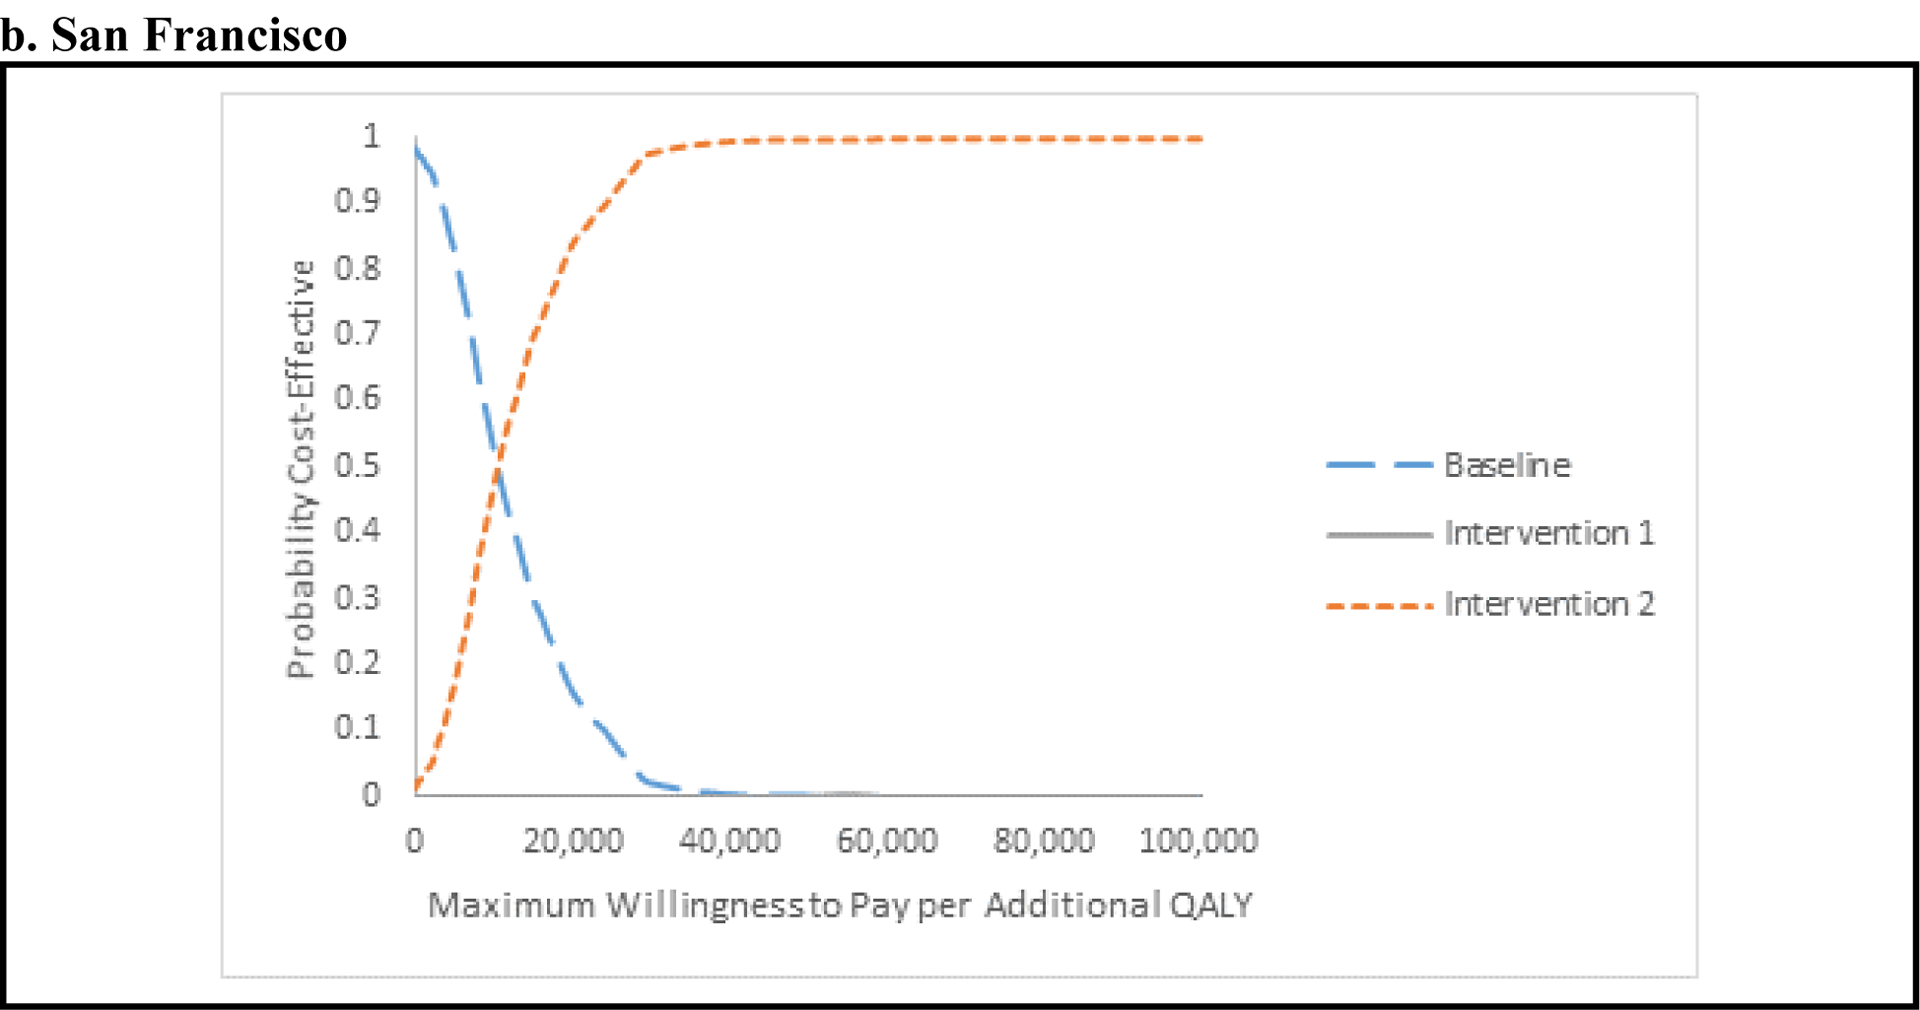
The CEACs show the probability that one strategy is preferred to the other, for different maximum willingness-to-pay (WTP) for an additional quality-adjusted life-year (QALY). As decision makers are willing to pay more for an additional QALY, the more-costly and effective strategy is preferred. Baseline: current levels of syringe-service program (SSP) and medication-assisted treatment (MAT) with limited, usual hepatitis C virus (HCV) care including HCV screening and treatment with direct-acting antiviral agents (DAAs) for ex-injectors. Intervention 1: Scale-up of SSP and MAT to 50% coverage with the same level of screening and HCV treatment for ex-injectors as in the baseline intervention. Intervention 2: Scale-up of SSP and MAT to 50% coverage, plus annually screening of 90% of current injectors for HCV, followed by HCV treatment with DAAs for 90% of persons found to be chronically infected.
Sensitivity Analyses
For both settings, the ICER for Intervention 2 compared with the baseline scenario was most sensitive to reductions in the cost of DAAs, changes in the time horizon of the analysis, and reductions in screening and HCV treatment uptake (see Figure 2). 1. In both settings, Intervention 2 became even more cost-effective, with ICERs below $5,000/QALY, when using a cost of DAAs similar to the cost of the less expensive DAAs currently in the market (50% below baseline value). 2. Decreasing the SVR rate of DAAs slightly increased the ICER (less cost-effective) in both settings. 3. Increasing the time horizon improved the ICER in SF and PC. Conversely, shortening the time horizon made the intervention less cost-effective. 4. Reducing screening and HCV treatment uptake rates to 45% each, increased the ICER from 6,975/ QALY to $12,240 per QALY in PC, and from $11,044/ QALY to $14,606 per QALY in SF. 5. Using the minimum utility estimator resulted in slightly lower quality of life gains with Intervention 2 because the utility values for those not in MAT are always lower than HCV states, making the quality-of-life benefit from HCV treatment only observable if the individual is on MAT and for the cirrhosis health state and subsequent stages of chronic HCV disease. Nevertheless, for all sensitivity analysis on the QoL estimates, the ICERs were very close to the baseline values. 6. Excluding the cost of pre-test counseling had a minimal impact on the ICERs for both sites. 7. Assuming a higher treatment rate of diagnosed persons who formerly injected drugs, considerably improved the ICER for Kentucky ($4,516/ QALY), and slightly improved the ICER for San Francisco ($10,676/ QALY). 8. Using a lower prevalence of HCV among those older than 50 in SF resulted in a slightly increased ICER of 13,537/ QALY. 9. Accounting for the increased risk of death before and after MAT led to a modest increase in the ICER in both Kentucky ($7,581/ QALY) and San Francisco ($11,338/ QALY).
Figure 2. Tornado diagram of univariate sensitivity analyses for Kentucky (a) and San Francisco (b).
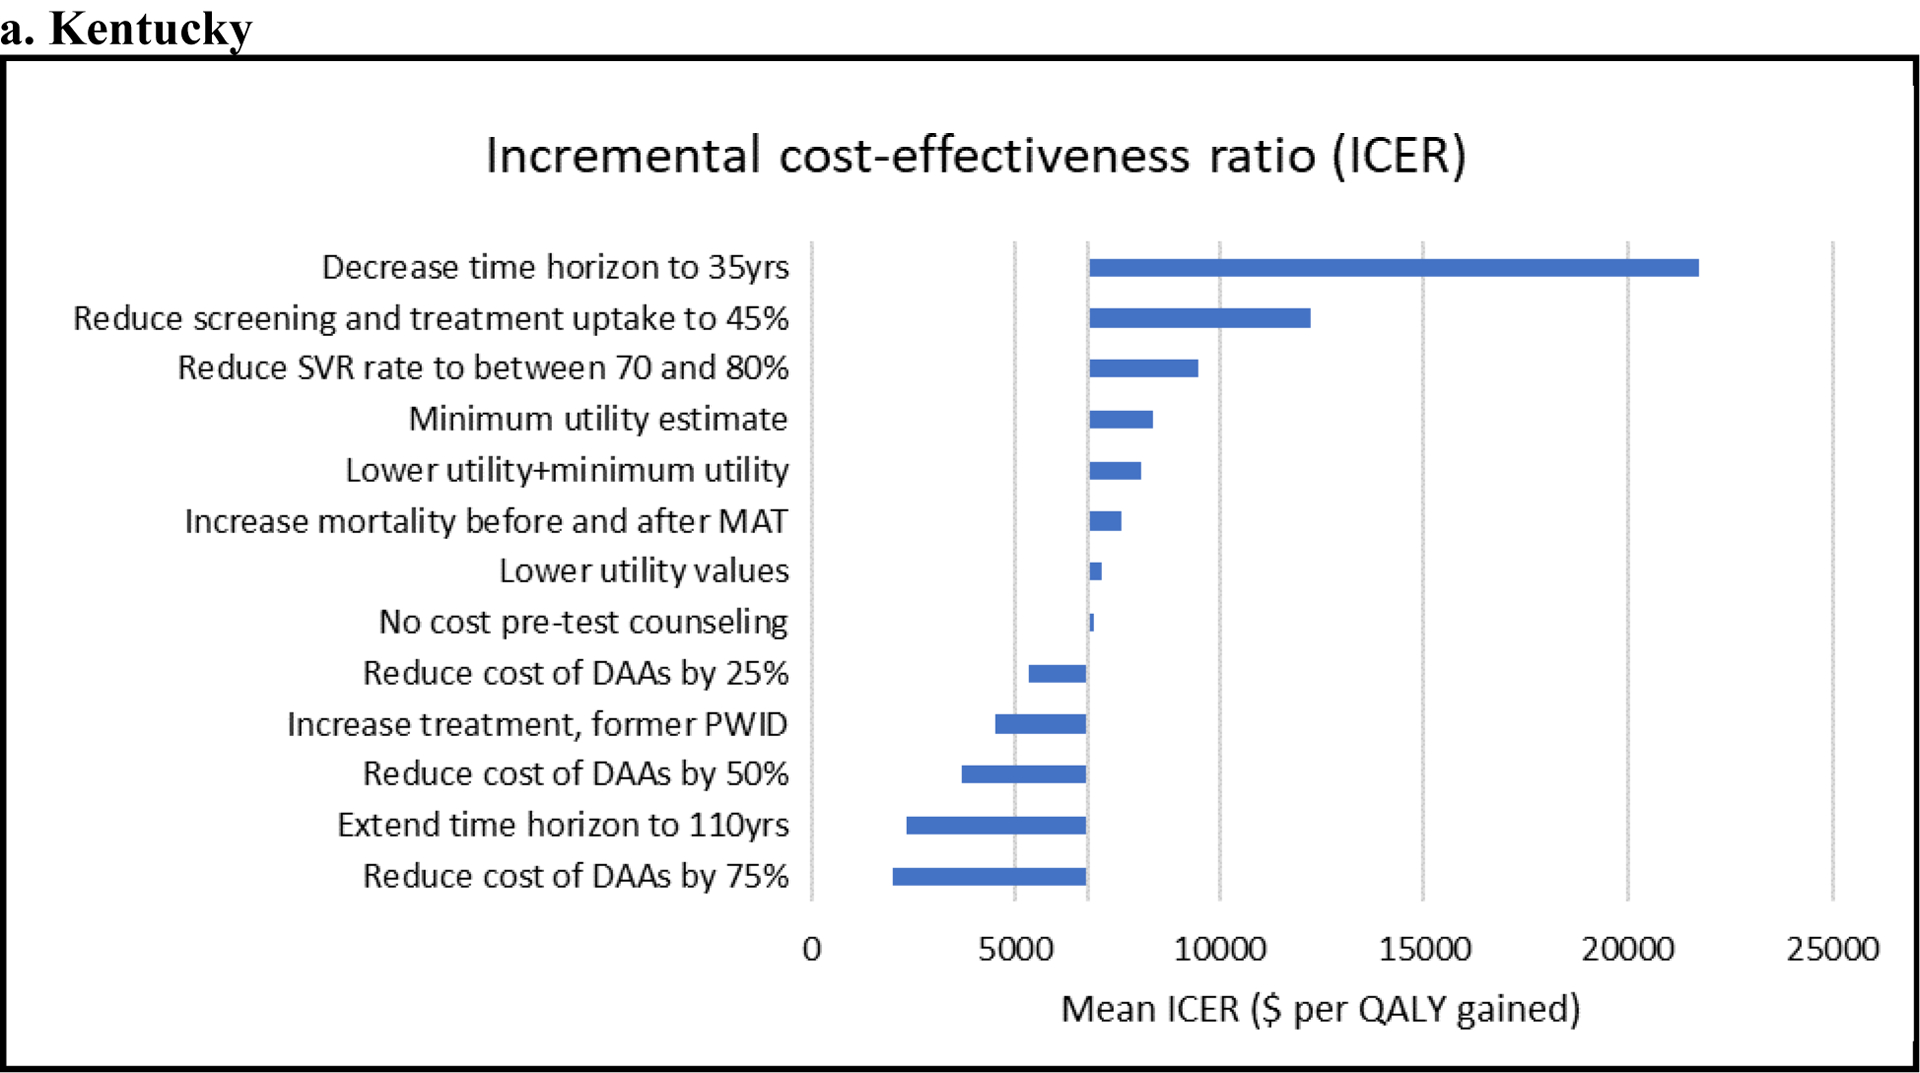
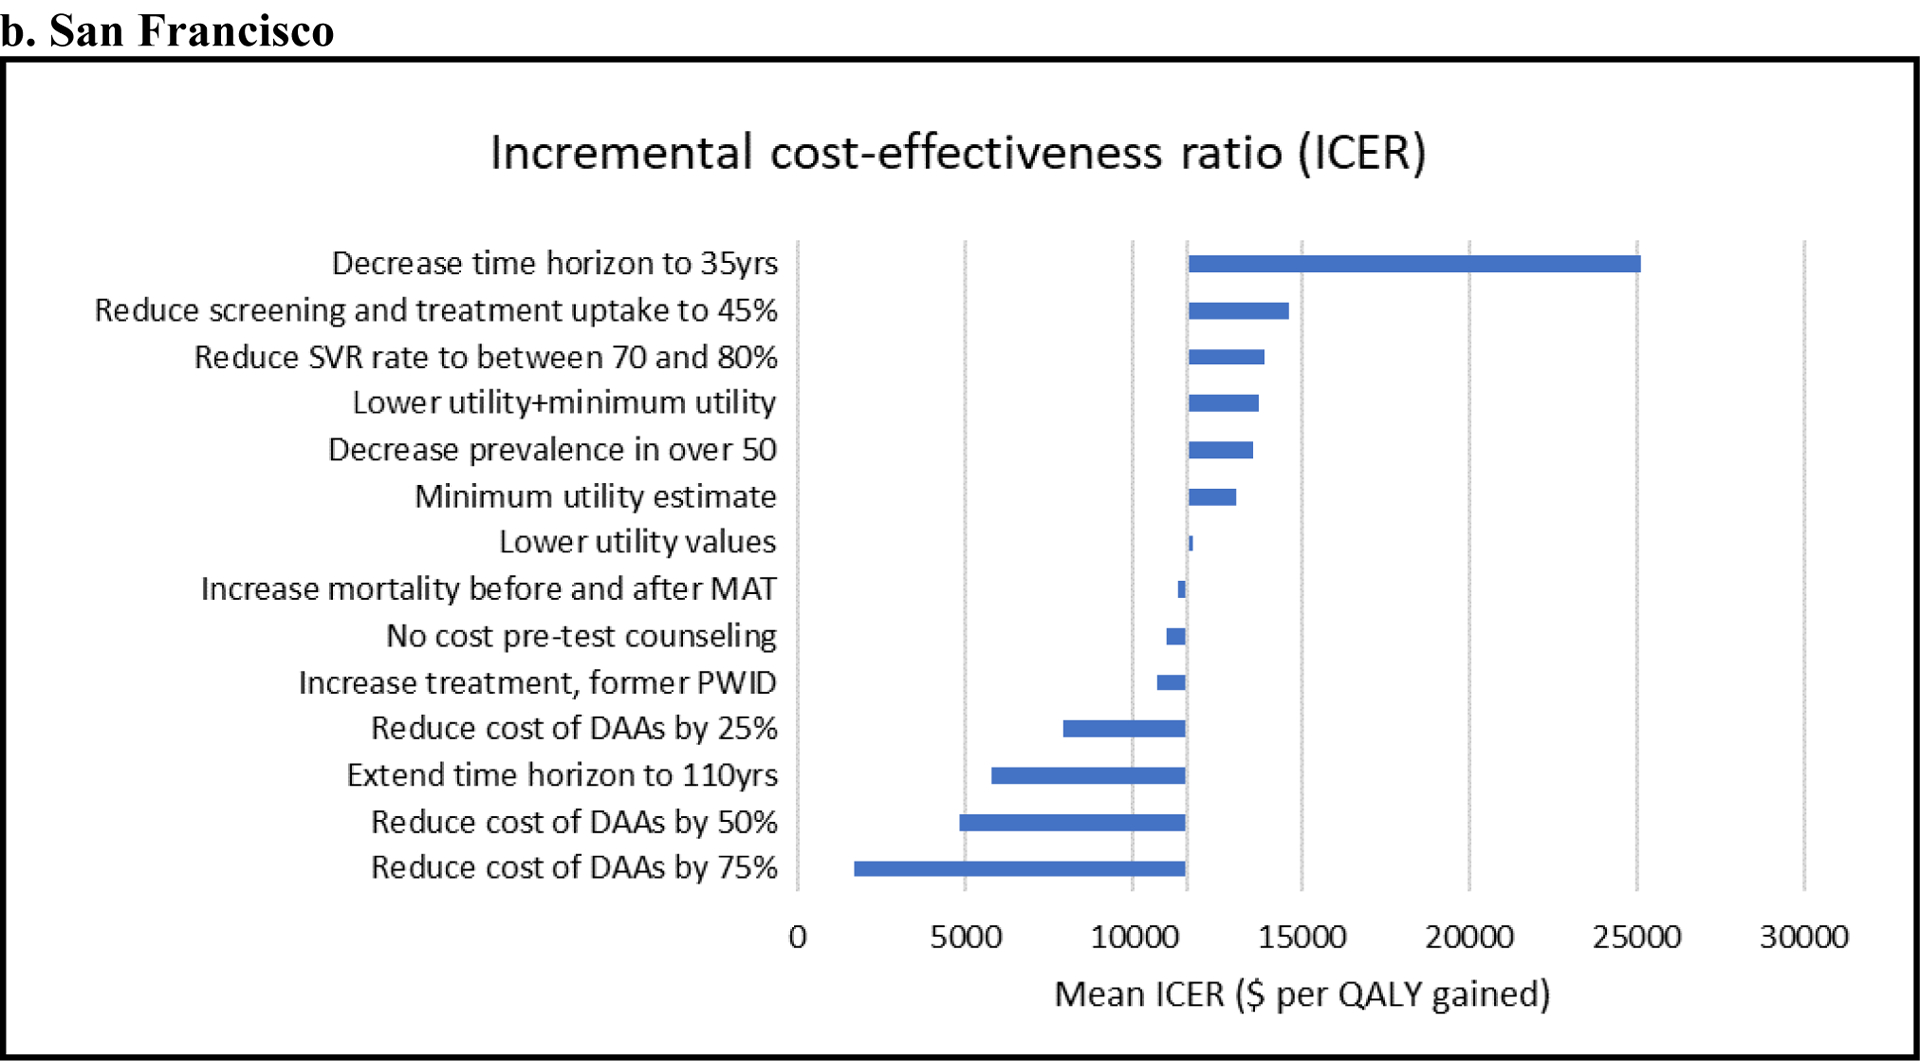
Shows the change in ICERs (horizontal axis; $/quality-adjusted life-year [QALY]) compared to the base-case ICER ($6,975 per QALY for Kentucky and $11,044 per QALY for San Francisco) when different model assumptions are changed (see vertical axis). These analyses consider Intervention 2 where scale-up of MAT and SSP with hepatitis C virus screening and treatment is compared with the baseline scenario. For example, for both settings, Intervention 2 becomes more cost-effective (lower ICER) when reducing the cost of DAAs and less cost-effective (higher ICER) when decreasing the time horizon of the analysis.
DAA = direct-acting antiviral agent; SSP = syringe-service program; PWID= people who inject drugs; SVR= sustained viral response; MAT= medication-assisted treatment
In the ANCOVA of costs, uncertainty in the cost of HCV treatment accounted for most (55% in PC and 84% in SF) of the variation in incremental costs in both settings. Uncertainty in the duration of injection (22%) and the HCV seroprevalence among those injecting <3 years (5%) also played an important role in PC. In the ANCOVA of QALYs, uncertainty in the PWID population sizes (26% in PC and 60% in SF), and utility weights associated with being in health states F0 or F1 (41% in PC and 11% in SF in total) were the main factors accounting for the variation in the incremental QALYs in both settings.
DISCUSSION
The current epidemic of opioid abuse in the United States has led to striking increases in HCV infection, particularly due to increasing injection drug use in rural settings [9, 56]. Therefore, targeting PWID for HCV prevention and treatment is critically important for controlling HCV in the United States [57]. Considering an integrated health care strategy in two settings, our results show that scaling up MAT and SSP, combined with HCV screening and treatment for PWID can be a highly cost-effective approach to reversing the increasing HCV incidence in the United States. This applies both in an urban setting with long-standing injection drug use and moderate to high coverage of MAT and SSP interventions, and in a rural setting with recent increases in injection drug use with negligible coverage of harm-reduction interventions. We show that a combined prevention and treatment approach optimizes the HCV prevention benefits achieved, with the expansion of MAT and SSP directly reducing the risk of new infections, while DAA treatments directly reduce the burden of current infection and indirectly reduce the risk of new infections.
The ICER for the combined intervention was $6,975 per QALY for PC and $11,044 per QALY for SF, which by most standards suggests that HCV screening and treatment of current PWID combined with SSP and MAT scale-up is highly cost-effective in reducing current HCV infections and preventing new ones. However, although cost-effective, it is important to note that most intervention costs (HCV screening and treatment among PWID and MAT and SSP scale-up) are upfront while the health care benefits and costs averted occur many years down the line, so the intervention is less cost-effective when viewed over shorter time frames.
Our results are based on model projections and need to be interpreted with the recognition of several simplifying assumptions. First, we restricted our analysis to direct medical costs. We did not consider the effect of HCV treatment on increasing productivity or any extra-hepatic benefits of treatment [58, 59]. We also did not incorporate the beneficial effects of MAT on HIV-transmission or HIV-treatment outcomes [60–62], on decreasing overdose risk, the number of PWID [63], and criminal activity [64], and improving employment status [65]. Including these effects would improve the cost-effectiveness of scaling up HCV treatment and MAT. We also did not account for patient out-of-pocket costs or costs accrued from prolonged life expectancy [66], which would have reduced the cost-effectiveness of our intervention. Impacts of MAT beyond reduction in HCV transmission can be addressed in a model that explicitly incorporates the natural history of opioid use disorder; the current model focuses on the dynamics of HCV infection amongst PWID.
Second, we assumed that the risk of reinfection was equal to that of initial infection. It is possible that PWID may reduce their risk behavior after HCV treatment [67] and also have a lower biological risk of reinfection [68, 69], which could confer prevention effects beyond our predictions.
Third, we did not account for heterogeneity in treatment compliance (e.g., high-risk individuals may be less likely to enter or comply with treatment). These limitations can be addressed in future modeling that uses empirical research on the effect of patient characteristics on HCV treatment access and compliance.
Fourth, our results were subject to limitations in data availability, particularly surrounding SSP costs and parameterizing and calibrating the model. Most importantly, these included limited data on the evolving injecting and HCV epidemic in both PC and SF. Our model projections included uncertainty in these factors, and although they were robust despite this, they could be improved with better data on these factors. Additionally, our baseline scenario for SF assumes no HCV treatment for active PWID. In 2016, SF initiated an aggressive campaign to eliminate HCV that promotes HCV treatment for at-risk groups, including PWID. Treatment rates are increasing, but specific rates for PWID are not available [70].
Recent health economic models for several settings (United Kingdom, Australia, Netherlands) suggest that early HCV treatment for PWID is likely to be cost-effective [71–74]. However, these previous cost-effectiveness analyses were not conducted in a U.S. setting and did not consider the joint impact of scaling up HCV treatment together with MAT and SSP. Other cost-effectiveness analyses of DAA treatment have been conducted in the United States [40, 75]; but none of those analyses focused on treatment of PWID in a community setting. Our study is the first cost-effectiveness analysis of U.S. HCV treatment combined with MAT and SSP for PWID.
Despite the high incidence of HCV in PWID and professional society guidelines and recommendations advocating HCV treatment for PWID [11, 76], few active PWID have received treatment for HCV [76, 77]. Reaching and engaging PWID has challenges associated with the illicit nature of injecting drug use and stigma, discrimination, and mistrust of health services [77]. However, successful treatment outcomes have been achieved in numerous settings, with integration of HCV care in substance use treatment settings or co-locating primary health care services and behavioral health services, including MAT and SSP, likely enhancing medication adherence [78]. Unfortunately, the cost of new DAA treatments and the high number needing treatment, Medicaid requirements for drug and alcohol abstinence, and restricting treatment to those with late-stage liver disease have curbed the use of HCV treatment as a prevention strategy in the United States. [79, 80]. Recently, competition between different DAA drug manufacturers has resulted in substantial decreases in the costs of HCV medications [11], while Medicaid’s ability to negotiate prices and easing of restrictions on treatment [81, 82] bring hope for the feasibility of HCV treatment as prevention in PWID. Also encouraging is the recent declaration by the President’s Commission on Combating Drug Addiction and the Opioid Crisis which led the president to declare the country’s opioid crisis a national emergency [83]. One of the commission’s recommendations is enhancing access to MAT, with such scale-up being an important avenue for a concomitant scale-up in HCV treatment among PWID.
Conclusions
Our study is the first to examine the cost-effectiveness of HCV treatment as prevention in U.S. rural and urban settings. Despite differences in the injecting epidemics, availability of MAT and SSP, and HCV epidemiology in the two settings, scaling up HCV treatment combined with MAT and SSP is a cost-effective approach for reducing HCV transmission in both settings. This finding may support policy change to reduce disparities in the management of HCV infection and encourage support for HCV treatment in PWID to optimize population-level prevention benefits.
Supplementary Material
Acknowledgements
CV was an employee of the US Centers for Disease Control and Prevention at the time the study began. AL was an employee of RTI International at the time the study began. The authors thank Yea-Hung Chen at the San Francisco Department of Public Health for providing analyses on prevalence data for our sensitivity analysis.
Funding and conflict of interest disclosure: Funding and conflict of interest disclosure: Financial support for this study was provided by Contract No. 200-2013-M-53964B GS-10F-0097L from the Centers for Disease Control and Prevention (CDC) to RTI International and a subcontract from RTI International to the University of Bristol. The findings and conclusions in this paper are those of the authors and do not necessarily represent the official position of CDC, RTI International, or the University of Bristol, the NHS, the NIHR, the Department of Health and Social Care or Public Health England.
PV was additionally supported by the National Institute for Drug Abuse [grant number R01 DA037773]. JE and KP were supported by the National Institute for Drug Abuse (3-R01 DA016017-14) as was JH (R01 DA024598). PV acknowledges the research was supported by the National Institute for Health Research Health Protection Research Unit (NIHR HPRU) in Evaluation of Interventions at the University of Bristol in partnership with Public Health England (PHE).
PV has received unrestricted research grants from Gilead unrelated to this work. HF has received an honorarium from MSD. KP has received research grant funding from Gilead unrelated to this work. All authors declare no conflict of interest.
REFERENCES
- 1.Edlin BR, Eckhardt BJ, Shu MA, Holmberg SD, Swan T. Toward a more accurate estimate of the prevalence of hepatitis C in the United States. Hepatology. 2015; 62(5):1353–63. 10.1002/hep.27978. [DOI] [PMC free article] [PubMed] [Google Scholar]
- 2.Centers for Disease Control and Prevention. Viral Hepatitis Surveillance United States, 2015. Available from: https://www.cdc.gov/hepatitis/statistics/2015surveillance/pdfs/2015HepSurveillanceRpt.pdf, Archived at: http://www.webcitation.org/78PtzMtMG on May 16th, 2019.
- 3.Razavi H, ElKhoury AC, Elbasha E, Estes C, Pasini K, Poynard T, et al. Chronic Hepatitis C Virus (HCV) disease burden and cost in the United States. Hepatology. 2013; 57(6):2164–70. 10.1002/hep.26218. [DOI] [PMC free article] [PubMed] [Google Scholar]
- 4.Centers for Disease Control and Prevention. Surveillance for Viral Hepatitis – United States, 2013. Available from: http://www.cdc.gov/hepatitis/statistics/2013surveillance/index.htm, Archived at http://www.webcitation.org/78Q7FBGbt on May 16th, 2019.
- 5.Havens JR, Lofwall MR, Frost SD, Oser CB, Leukefeld CG, Crosby RA. Individual and network factors associated with prevalent hepatitis C infection among rural Appalachian injection drug users. Am J Public Health. 2013; 103(1):e44–e52. [DOI] [PMC free article] [PubMed] [Google Scholar]
- 6.Peters PJ, Pontones P, Hoover KW, Patel MR, Galang RR, Shields J, et al. HIV infection linked to injection use of oxymorphone in Indiana, 2014–2015. N Engl J Med. 2016; 375(3):229–39. 10.1056/NEJMoa1515195. [DOI] [PubMed] [Google Scholar]
- 7.Zibbell JE, Hart-Malloy R, Barry J, Fan L, Flanigan C. Risk factors for HCV infection among young adults in rural New York who inject prescription opioid analgesics. Am J Public Health. 2014; 104(11):2226–32. [DOI] [PMC free article] [PubMed] [Google Scholar]
- 8.Zibbell JE, Asher AK, Patel RC, Kupronis B, Iqbal K, Ward JW, et al. Increases in acute hepatitis C virus infection related to a growing opioid epidemic and associated injection drug use, United States, 2004 to 2014. Am J Public Health. 2018; 108(2):175–81. 10.2105/ajph.2017.304132. [DOI] [PMC free article] [PubMed] [Google Scholar]
- 9.Zibbell JE, Iqbal K, Patel R, Suryaprasad A, Sanders K, Moore-Moravian L, et al. Increases in hepatitis C virus infection related to injection drug use among persons aged≤ 30 years-kentucky, tennessee, virginia, and west virginia, 2006–2012 MMWR Morb Mortal Wkly Rep. 2015; 64(17):453–8. [PMC free article] [PubMed] [Google Scholar]
- 10.Suryaprasad AG, White JZ, Xu F, Eichler B-A, Hamilton J, Patel A, et al. Emerging epidemic of hepatitis C virus infections among young nonurban persons who inject drugs in the United States, 2006–2012. Clin Infect Dis. 2014; 59(10):1411–9. 10.1093/cid/ciu643. [DOI] [PubMed] [Google Scholar]
- 11.American Association for the Study of Liver Diseases and Infectious Diseases Society of America. HCV guidance: Recommendations for testing, managing, and treating Hepatitis C. 2017. Available from: https://www.hcvguidelines.org/, Archived at http://www.webcitation.org/78Q7ujifx on May 16th, 2019. [DOI] [PMC free article] [PubMed]
- 12.Hepatitis C Online. Glecaprevir-Pibrentasvir. 2018. Available from: https://www.hepatitisc.uw.edu/page/treatment/drugs/glecaprevir-pibrentasvir/drug-summary, Archived at http://www.webcitation.org/78Q8Dpyq7, on May 16th, 2019.
- 13.Campbell CA, Canary L, Smith N, Teshale E, Ryerson AB, Ward JW. State HCV incidence and policies related to HCV preventive and treatment services for persons who inject drugs - United States, 2015–2016. MMWR Morb Mortal Wkly Rep. 2017; 66(18):465–9. 10.15585/mmwr.mm6618a2. [DOI] [PMC free article] [PubMed] [Google Scholar]
- 14.Fraser H, Zibbell J, Hoerger T, Hariri S, Vellozzi C, Martin NK, et al. Scaling-up HCV prevention and treatment interventions in rural United States-model projections for tackling an increasing epidemic. Addiction. 2018; 113(1):173–82. 10.1111/add.13948. [DOI] [PMC free article] [PubMed] [Google Scholar]
- 15.Fraser H, Vellozzi C, Hoerger TJ, Evans J, Kral AH, Havens J, et al. Scaling-up hepatitis C prevention and treatment interventions for achieving elimination in the United States – a rural and urban comparison. Am J Epidemiol. In Press 10.1093/aje/kwz097. [DOI] [PMC free article] [PubMed] [Google Scholar]
- 16.Hahn JA, Page-Shafer K, Lum PJ, Ochoa K, Moss AR. Hepatitis C virus infection and needle exchange use among young injection drug users in San Francisco. Hepatology. 2001; 34(1):180–7. 10.1053/jhep.2001.25759. [DOI] [PubMed] [Google Scholar]
- 17.Tsui JI, Evans JL, Lum PJ, Hahn JA, Page K. Association of opioid agonist therapy with lower incidence of hepatitis C virus infection in young adult injection drug users. JAMA Intern Med. 2014; 174(12):1974–81. 10.1001/jamainternmed.2014.5416. [DOI] [PMC free article] [PubMed] [Google Scholar]
- 18.Tempalski B, Pouget ER, Cleland CM, Brady JE, Cooper HL, Hall HI, et al. Trends in the population prevalence of people who inject drugs in US metropolitan areas 1992–2007. PLoS One. 2013; 8(6):e64789 10.1371/journal.pone.0064789. [DOI] [PMC free article] [PubMed] [Google Scholar]
- 19.Evans JL, Tsui JI, Hahn JA, Davidson PJ, Lum PJ, Page K. Mortality among young injection drug users in San Francisco: a 10-year follow-up of the UFO study. Am J Epidemiol. 2012; 175(4):302–8. 10.1093/aje/kwr318. [DOI] [PMC free article] [PubMed] [Google Scholar]
- 20.Page K, Hahn JA, Evans J, Shiboski S, Lum P, Delwart E, et al. Acute hepatitis C virus infection in young adult injection drug users: a prospective study of incident infection, resolution, and reinfection. J Infect Dis. 2009; 200(8):1216–26. 10.1086/605947. [DOI] [PMC free article] [PubMed] [Google Scholar]
- 21.Kral AH, Malekinejad M, Vaudrey J, Martinez AN, Lorvick J, McFarland W, et al. Comparing respondent-driven sampling and targeted sampling methods of recruiting injection drug users in San Francisco. J Urban Health. 2010; 87(5):839–50. 10.1007/s11524-010-9486-9. [DOI] [PMC free article] [PubMed] [Google Scholar]
- 22.Tseng FC, O’Brien TR, Zhang M, Kral AH, Ortiz-Conde BA, Lorvick J, et al. Seroprevalence of hepatitis C virus and hepatitis B virus among San Francisco injection drug users, 1998 to 2000. Hepatology. 2007; 46(3):666–71. 10.1002/hep.21765. [DOI] [PMC free article] [PubMed] [Google Scholar]
- 23.Hahn JA, Page-Shafer K, Lum PJ, Bourgois P, Stein E, Evans JL, et al. Hepatitis C virus seroconversion among young injection drug users: relationships and risks. J Infect Dis. 2002; 186(11):1558–64. [DOI] [PubMed] [Google Scholar]
- 24.Page K, Morris MD, Hahn JA, Maher L, Prins M. Injection drug use and hepatitis C virus infection in young adult injectors: using evidence to inform comprehensive prevention. Clin Infect Dis. 2013; 57(suppl 2):S32–S8. [DOI] [PMC free article] [PubMed] [Google Scholar]
- 25.Platt L, Minozzi S, Reed J, Vickerman P, Hagan H, French C, et al. Needle syringe programmes and opioid substitution therapy for preventing hepatitis C transmission in people who inject drugs. Cochrane Database Syst Rev. 2017(9) 10.1002/14651858.CD012021.pub2. [DOI] [PMC free article] [PubMed] [Google Scholar]
- 26.Spradling PR, Rupp L, Moorman AC, Lu M, Teshale EH, Gordon SC, et al. Hepatitis B and C virus infection among 1.2 million persons with access to care: factors associated with testing and infection prevalence. Clin Infect Dis. 2012; 55(8):1047–55. 10.1093/cid/cis616. [DOI] [PMC free article] [PubMed] [Google Scholar]
- 27.Linas BP, Hu H, Barter DM, Horberg M. Hepatitis C screening trends in a large integrated health system. Am J Med. 2014; 127(5):398–405. 10.1016/j.amjmed.2014.01.012. [DOI] [PMC free article] [PubMed] [Google Scholar]
- 28.Chhatwal J, Wang X, Ayer T, Kabiri M, Chung RT, Hur C, et al. Hepatitis C disease burden in the United States in the era of oral direct-acting antivirals. Hepatology. 2016; 64(5):1442–50. 10.1002/hep.28571. [DOI] [PMC free article] [PubMed] [Google Scholar]
- 29.Holmberg SD, Spradling PR, Moorman AC, Denniston MM. Hepatitis C in the United States. N Engl J Med. 2013; 368(20):1859–61. 10.1056/NEJMp1302973. [DOI] [PMC free article] [PubMed] [Google Scholar]
- 30.Yehia BR, Schranz AJ, Umscheid CA, Lo Re V. The treatment cascade for chronic hepatitis C virus infection in the United States: a systematic review and meta-analysis. PLoS One. 2014; 9(7):e101554 10.1371/journal.pone.0101554. [DOI] [PMC free article] [PubMed] [Google Scholar]
- 31.Maier MM, Ross DB, Chartier M, Belperio PS, Backus LI. Cascade of care for hepatitis C virus infection within the US Veterans Health Administration. Am J Public Health. 2016; 106(2):353–8. 10.2105/ajph.2015.302927. [DOI] [PMC free article] [PubMed] [Google Scholar]
- 32.Cipriano LE, Zaric GS, Holodniy M, Bendavid E, Owens DK, Brandeau ML. Cost effectiveness of screening strategies for early identification of HIV and HCV infection in injection drug users. PLoS One. 2012; 7(9):e45176 10.1371/journal.pone.0045176. [DOI] [PMC free article] [PubMed] [Google Scholar]
- 33.Medicaid. Clinical Diagnostic Laboratory Fee Schedule 2016. 2016. Available from: http://chfs.ky.gov/NR/rdonlyres/B7561EB5-C136-4722-A3F4-BF9CC0AF1E94/0/ClinicalDiagnosticLaboratoryFeeSchedule2016web.pdf, Archived at http://www.webcitation.org/78Q98Wpil, on May 16th, 2019.
- 34.SAMHSA. Coding for Screening and Brief Intervention Reimbursement. 2016. Available from: https://www.samhsa.gov/sbirt/coding-reimbursement, Archived at http://www.webcitation.org/78QDWyoaH on May 16th, 2019.
- 35.Medicare. Hepatitis C CPT Codes. 2016. Available from: http://www.mysupportpath.com/~/media/Files/mysupportpath_com/CPT_Codes.pdf, Archived at http://www.webcitation.org/78QDoPWcz on May 16th, 2019.
- 36.Jackson H, Mandell K, Johnson K, Chatterjee D, Vanness DJ. Cost-effectiveness of injectable extended-release naltrexone compared with methadone maintenance and buprenorphine maintenance treatment for opioid dependence. Subst Abuse. 2015; 36(2):226–31. 10.1080/08897077.2015.1010031. [DOI] [PMC free article] [PubMed] [Google Scholar]
- 37.Nguyen TQ, Weir BW, Des Jarlais DC, Pinkerton SD, Holtgrave DR. Syringe exchange in the United States: a national level economic evaluation of hypothetical increases in investment. AIDS Behav. 2014; 18(11):2144–55. 10.1007/s10461-014-0789-9. [DOI] [PMC free article] [PubMed] [Google Scholar]
- 38.Rein DB, Wittenborn JS, Smith BD, Liffmann DK, Ward JW. The cost-effectiveness, health benefits, and financial costs of new antiviral treatments for Hepatitis C virus. Clin Infect Dis. 2015; 61(2):157–68. 10.1093/cid/civ220. [DOI] [PMC free article] [PubMed] [Google Scholar]
- 39.Chong CAKY, Gulamhussein A, Heathcote EJ, Lilly L, Sherman M, Naglie G, et al. Health-state utilities and quality of life in hepatitis C patients. Am J Gastroenterol. 2003; 98(3):630–8. [DOI] [PubMed] [Google Scholar]
- 40.Chhatwal J, Kanwal F, Roberts MS, Dunn MA. Cost-effectiveness and budget impact of hepatitis C virus treatment with sofosbuvir and ledipasvir in the United States. Ann Intern Med. 2015; 162(6):397–406. 10.7326/M14-1336. [DOI] [PMC free article] [PubMed] [Google Scholar]
- 41.Hammer J, Lawrence WF, Anderson JP, Kaplan RM, Fryback DG. Report of nationally representative values for the noninstitutionalized US adult population for 7 health-related quality-of-life scores. Med Decis Making. 2006; 26(4):391–400. [DOI] [PubMed] [Google Scholar]
- 42.Zaric GS, Barnett PG, Brandeau ML. HIV transmission and the cost-effectiveness of methadone maintenance. Am J Public Health. 2000; 90(7):1100–11. 10.2105/ajph.90.7.1100. [DOI] [PMC free article] [PubMed] [Google Scholar]
- 43.Briggs A, Sculpher M, Claxton K. Decision modelling for health economic evaluation. Oxford University Press; 2006. [Google Scholar]
- 44.Drummond M, Sculpher M, Torrance G, Bernie OB, Stoddart G. Methods for the economic evaluation of health care programmes. Third ed. Oxford: Oxford University Press; 2005. [Google Scholar]
- 45.Grosse SD. Assessing cost-effectiveness in healthcare: history of the $50,000 per QALY threshold. Expert Rev Pharmacoecon Outcomes Res. 2008; 8(2):165–78. 10.1586/14737167.8.2.165. [DOI] [PubMed] [Google Scholar]
- 46.Neumann PJ, Cohen JT, Weinstein MC. Updating cost-effectiveness — the curious resilience of the $50,000-per-QALY threshold. N Engl J Med. 2014; 371(9):796–7. 10.1056/NEJMp1405158. [DOI] [PubMed] [Google Scholar]
- 47.Husereau D, Drummond M, Petrou S, Carswell C, Moher D, Greenberg D, et al. Consolidated Health Economic Evaluation Reporting Standards (CHEERS)--explanation and elaboration: a report of the ISPOR Health Economic Evaluation Publication Guidelines Good Reporting Practices Task Force. Value in health : the journal of the International Society for Pharmacoeconomics and Outcomes Research. 2013; 16(2):231–50. 10.1016/j.jval.2013.02.002. [DOI] [PubMed] [Google Scholar]
- 48.Welch CM. Generic Hepatitis C Treatments Coming in the United States. Life Beyond Hep C; 2018. Available from: Available from: https://www.lifebeyondhepatitisc.com/2018/10/generic-hepatitis-c-treatments-coming-in-the-u-s/, Archieved at http://www.webcitation.org/78Q9jfODp, on May 16th, 2019.
- 49.Wittenberg E, Bray JW, Aden B, Gebremariam A, Nosyk B, Schackman BR. Measuring benefits of opioid misuse treatment for economic evaluation: health-related quality of life of opioid-dependent individuals and their spouses as assessed by a sample of the US population. Addiction. 2016; 111(4):675–84. 10.1111/add.13219. [DOI] [PMC free article] [PubMed] [Google Scholar]
- 50.Wittenberg E, Bray JW, Gebremariam A, Aden B, Nosyk B, Schackman BR. Joint Utility Estimators in Substance Use Disorders. Value in health : the journal of the International Society for Pharmacoeconomics and Outcomes Research. 2017; 20(3):458–65. 10.1016/j.jval.2016.09.2404. [DOI] [PMC free article] [PubMed] [Google Scholar]
- 51.Centers for Disease Control and Prevention. National HIV Behavioral Surveillance (NHBS). Division of HIV/AIDS Prevention, National Center for HIV/AIDS, Viral Hepatitis, STD, and TB Prevention; 2019. Available from: https://www.cdc.gov/hiv/statistics/systems/nhbs/index.html, Archieved at http://www.webcitation.org/78QAIQRkS on May 16th, 2019. [Google Scholar]
- 52.Sordo L, Barrio G, Bravo MJ, Indave BI, Degenhardt L, Wiessing L, et al. Mortality risk during and after opioid substitution treatment: systematic review and meta-analysis of cohort studies. BMJ. 2017; 357:j1550 10.1136/bmj.j1550. [DOI] [PMC free article] [PubMed] [Google Scholar]
- 53.Briggs A, Claxton K, Sculpher M. Decision modelling for health economic evaluation. Oxford: Oxford University Press; 2007. [Google Scholar]
- 54.Campbell JD, McQueen RB, Libby AM, Spackman DE, Carlson JJ, Briggs A. Cost-Effectiveness Uncertainty Analysis Methods: A Comparison of One-Way Sensitivity, Analysis of Covariance, and Expected Value of Partial Perfect Information. Med Decis Making. 2015; 35(5):596–607. 10.1177/0272989x14556510. [DOI] [PubMed] [Google Scholar]
- 55.Sweeney S, Ward Z. Evaluating the cost-effectiveness of existing needle and syringe programmes in preventing hepatitis C transmission in people who inject drugs. Addiction. 2019; 114(3):560–70. 10.1111/add.14519. [DOI] [PubMed] [Google Scholar]
- 56.Stephens DB, Young AM, Havens JR. Healthcare contact and treatment uptake following hepatitis C virus screening and counseling among rural Appalachian people who use drugs. Int J Drug Policy. 2017; 47:86–94. [DOI] [PMC free article] [PubMed] [Google Scholar]
- 57.Gonzalez SA, Fierer DS, Talal AH. Medical and Behavioral Approaches to Engage People Who Inject Drugs Into Care for Hepatitis C Virus Infection. Addict Disord Their Treat. 2017; 16(2 Suppl 1):S1–S23. 10.1097/ADT.0000000000000104. [DOI] [PMC free article] [PubMed] [Google Scholar]
- 58.Peveling-Oberhag J, Arcaini L, Bankov K, Zeuzem S, Herrmann E. The anti-lymphoma activity of antiviral therapy in HCV-associated B-cell non-Hodgkin lymphomas: a meta-analysis. J Viral Hepat. 2016; 23(7):536–44. 10.1111/jvh.12518. [DOI] [PubMed] [Google Scholar]
- 59.Hsu YC, Ho HJ, Huang YT, Wang HH, Wu MS, Lin JT, et al. Association between antiviral treatment and extrahepatic outcomes in patients with hepatitis C virus infection. Gut. 2015; 64(3):495–503. 10.1136/gutjnl-2014-308163. [DOI] [PubMed] [Google Scholar]
- 60.Mukandavire C, Low A, Mburu G, Trickey A, May MT, Davies CF, et al. Impact of opioid substitution therapy on the HIV prevention benefit of antiretroviral therapy for people who inject drugs. Aids. 2017; 31(8):1181–90. 10.1097/qad.0000000000001458. [DOI] [PubMed] [Google Scholar]
- 61.MacArthur GJ, Minozzi S, Martin N, Vickerman P, Deren S, Bruneau J, et al. Opiate substitution treatment and HIV transmission in people who inject drugs: systematic review and meta-analysis. Br Med J. 2012; 345:16 10.1136/bmj.e5945. [DOI] [PMC free article] [PubMed] [Google Scholar]
- 62.Malta M, Strathdee SA, Magnanini MMF, Bastos FI. Adherence to antiretroviral therapy for human immunodeficiency virus/acquired immune deficiency syndrome among drug users: a systematic review. Addiction. 2008; 103(8):1242–57. 10.1111/j.1360-0443.2008.02269.x. [DOI] [PubMed] [Google Scholar]
- 63.Mathers BM, Degenhardt L, Bucello C, Lemon J, Wiessing L, Hickman M. Mortality among people who inject drugs: a systematic review and meta-analysis. Bull World Health Organ. 2013; 91(2):102–23. [DOI] [PMC free article] [PubMed] [Google Scholar]
- 64.Lawrinson P, Ali R, Buavirat A, Chiamwongpaet S, Dvoryak S, Habrat B, et al. Key findings from the WHO collaborative study on substitution therapy for opioid dependence and HIV/AIDS. Addiction. 2008; 103(9):1484–92. 10.1111/j.1360-0443.2008.02249.x. [DOI] [PubMed] [Google Scholar]
- 65.Richardson L, Wood E, Montaner J, Kerr T. Addiction treatment-related employment barriers: the impact of methadone maintenance. J Subst Abuse Treat. 2012; 43(3):276–84. 10.1016/j.jsat.2011.12.008. [DOI] [PMC free article] [PubMed] [Google Scholar]
- 66.Neumann PJ, Sanders GD, Russels LB, Siegel JE, Ganiats TG. Cost-effectiveness in health and medicine. Second ed. New York, NY: Oxford University Press; 2016. [Google Scholar]
- 67.Midgard H, Hajarizadeh B, Cunningham EB, Conway B, Backmund M, Bruggmann P, et al. Changes in risk behaviours during and following treatment for hepatitis C virus infection among people who inject drugs: The ACTIVATE study. Int J Drug Policy. 2017; 47:230–8. 10.1016/j.drugpo.2017.05.040. [DOI] [PubMed] [Google Scholar]
- 68.Martinello M, Grebely J, Petoumenos K, Gane E, Hellard M, Shaw D, et al. HCV reinfection incidence among individuals treated for recent infection. J Viral Hepat. 2017; 24(5):359–70. 10.1111/jvh.12666. [DOI] [PMC free article] [PubMed] [Google Scholar]
- 69.Weir A, McLeod A, Innes H, Valerio H, Aspinall EJ, Goldberg DJ, et al. Hepatitis C reinfection following treatment induced viral clearance among people who have injected drugs. Drug Alcohol Depend. 2016; 165:53–60. 10.1016/j.drugalcdep.2016.05.012. [DOI] [PubMed] [Google Scholar]
- 70.Facente SN, Grebe E, Burk K, Morris MD, Murphy EL, Mirzazadeh A, et al. Estimated hepatitis C prevalence and key population sizes in San Francisco: A foundation for elimination. PLoS One. 2018; 13(4):e0195575 10.1371/journal.pone.0195575. [DOI] [PMC free article] [PubMed] [Google Scholar]
- 71.Martin NK, Vickerman P, Miners A, Foster GR, Hutchinson SJ, Goldberg DJ, et al. Cost-effectiveness of hepatitis C virus antiviral treatment for injection drug user populations. Hepatology. 2012; 55(1):49–57. 10.1002/hep.24656. [DOI] [PubMed] [Google Scholar]
- 72.van Santen DK, de Vos AS, Matser A, Willemse SB, Lindenburg K, Kretzschmar MEE, et al. Cost-effectiveness of hepatitis C treatment for people who inject drugs and the impact of the type of epidemic; extrapolating from Amsterdam, the Netherlands. PLoS One. 2016; 11(10):18 10.1371/journal.pone.0163488. [DOI] [PMC free article] [PubMed] [Google Scholar]
- 73.Martin NK, Vickerman P, Dore GJ, Grebely J, Miners A, Cairns J, et al. Prioritization of HCV treatment in the direct-acting antiviral era: An economic evaluation. J Hepatol. 2016; 65(1):17–25. 10.1016/j.jhep.2016.02.007. [DOI] [PMC free article] [PubMed] [Google Scholar]
- 74.Scott N, McBryde ES, Thompson A, Doyle JS, Hellard ME. Treatment scale-up to achieve global HCV incidence and mortality elimination targets: a cost-effectiveness model. Gut. 2017; 66(8):1507–15. 10.1136/gutjnl-2016-311504. [DOI] [PubMed] [Google Scholar]
- 75.Najafzadeh M, Andersson K, Shrank WH, Krumme AA, Matlin OS, Brennan T, et al. Cost-effectiveness of novel regimens for the treatment of hepatitis C virus. Ann Intern Med. 2015; 162(6):407–U136. 10.7326/m14-1152. [DOI] [PubMed] [Google Scholar]
- 76.Grebely J, Robaeys G, Bruggmann P, Aghemo A, Backmund M, Bruneau J, et al. Recommendations for the management of hepatitis C virus infection among people who inject drugs. Int J Drug Policy. 2015; 26(10):1028–38. 10.1016/j.drugpo.2015.07.005. [DOI] [PMC free article] [PubMed] [Google Scholar]
- 77.Hickman M, Grebely J, Bruneau J, Coffin P, Degenhardt L, Hutchinson S, et al. New developments and opportunities for preventing hepatitis C virus (HCV) among people who use and inject drugs—announcing an Addiction series. Addiction. 2017; 112(7):1126–7. 10.1111/add.13847. [DOI] [PubMed] [Google Scholar]
- 78.Zeremski M, Zibbell JE, Martinez AD, Kritz S, Smith BD, Talal AH. Hepatitis C virus control among persons who inject drugs requires overcoming barriers to care. World J Gastroenterol. 2013; 19(44):7846–51. 10.3748/wjg.v19.i44.7846. [DOI] [PMC free article] [PubMed] [Google Scholar]
- 79.Barua S, Greenwald R, Grebely J, Dore GJ, Swan T, Taylor LE. Restrictions for Medicaid reimbursement of Sofosbuvir for the treatment of Hepatitis C virus infection in the United States. Ann Intern Med. 2015; 163(3):215–23. 10.7326/m15-0406. [DOI] [PubMed] [Google Scholar]
- 80.Canary LA, Klevens RM, Holmberg SD. Limited access to new hepatitis C virus treatment under state Medicaid pPrograms. Ann Intern Med. 2015; 163(3):226–8. 10.7326/m15-0320. [DOI] [PubMed] [Google Scholar]
- 81.Silverman E Washington State Told to Lift Restrictions on Hepatitis C Medicines. Stat News. 2016. Available from: https://www.statnews.com/pharmalot/2016/05/27/washington-state-hepatitis-drug-prices/, Archieved at http://www.webcitation.org/78QAwb9oI on May 16th, 2019.
- 82.Center for Medicaid and CHIP Services. Assuring Medicaid Beneficiaries access to Hepatitis C (HCV) drugs. Medicaid Drug Rebate Program Notice 2015. 2015. Available from: https://www.medicaid.gov/medicaid-chip-program-information/by-topics/prescription-drugs/downloads/rx-releases/state-releases/state-rel-172.pdf, Archieved at http://www.webcitation.org/78QBAWPrh on May 16th, 2019.
- 83.Commission on Combating Drug Addiction and the Opioid Crisis. Commission interim report. 2017. Available from: https://www.whitehouse.gov/sites/whitehouse.gov/files/ondcp/commission-interim-report.pdf, Archieved at http://www.webcitation.org/78QBNwTHY on May 16th, 2019.
- 84.Bluthenthal RN, Wenger L, Chu D, Lorvick J, Quinn B, Thing JP, et al. Factors associated with being asked to initiate someone into injection drug use. Drug Alcohol Depend. 2015; 149:252–8. 10.1016/j.drugalcdep.2015.02.011. [DOI] [PMC free article] [PubMed] [Google Scholar]
Associated Data
This section collects any data citations, data availability statements, or supplementary materials included in this article.