Abstract
Background
Pakistan has a high incidence of breast cancer in Asia, where annually 16,232 deaths are reported. There are many exogenous and endogenous risk factors that affect the tumor suppressor genes and oncogenes. The p53 gene is a tumor suppressor gene and it has a role to protect the whole genome from external and internal stresses, which causes damages to the genome.
Objective
The aim of the current study was to investigate the p53 gene expression by using the real-time PCR technique in different grades of breast cancer as compared to the normal tissue.
Methods
Fresh Modified Radical Mastectomy (MRM) samples (grade1-grade3) were collected from different hospitals of the Lahore. The project was approved by an ethical review committee of Jinnah Hospital, Lahore. And before sampling an informed consent was obtained from patients and clinicians. RNA from fresh biopsies was extracted by Qiagen extraction kit and cDNA was formed. Real time PCR performed by using SYBR green master mix (ABI) and the data was evaluated by using Livak method. Statistical analysis was done by using Microsoft Excel.
Results
There was an abnormal gene expression of p53 in all grades of the breast tumors. Non-significant (p>0.05) difference of down and up regulation of p53 in different grades of breast tumor was found. However, as a whole up-regulation was more than down-regulation with significant difference (p<0.0011).
Conclusion
The abnormal expression of p53 shows that there are some genetic and epigenetic factors which are the primal cause of an abnormal gene expression. It is recommended that perform next generation sequencing (NGS) of the gene to find out the mutations causing the abnormal behavior of p53 gene.
Keywords: Breast cancer, up-regulation, down-regulation, real-time PCR, Punjab, Pakistan, p53 gene
Introduction
Cancer is a disease that occurs due to changes in the DNA sequence of the cells genome and it is responsible for one in eight deaths globally1. Breast cancer is one of the major types of malignant neoplasm and its incidence is quite high in Asia. The type of tissue cancer which mainly involves inner layers of milk glands or lobules and ducts is called as breast cancer2. It is a heterogeneous disease comprising a number of distinct subtypes with varied clinical outcome and behavior3. Broadly, it is divided into three major types non-invasive, invasive and others that are responsible for 1–4% of breast cancer include Paget's disease of the nipple4. It is classified into three major grades included: Grade I which is well differentiated, Grade II is differentiated intermediary and Grade III which is poorly differentiated. According to the number of affected lymph nodes it is classified into Grade I with no lymph nodes affection, Grade II in which one to three lymph nodes are affected and when ≥4 lymph nodes it is the Grade III5. Every year, one million women reported to diagnose with breast cancer6. Around the globe, it is the second leading cause of mortality among women aged 45–55 years2 and more than 1,000,000 breast cancer cases in females are reported annually7. Its incidence varies as it is being highest in North America and Western Europe, while it is lowest in Asia and Africa8. Early detection by using screening mammography and multimodality treatment has abridged the mortality due to this disease in western countries but in developing countries, it is still continuing to have a high prevalence9. In Pakistan, the ratio of developing breast cancer is rising at an alarming rate and it is 38.5% of other types of cancer4.
During 1995–1997, the incidence of breast cancer has reported 33.1% in the population of Karachi south district6. Breast carcinogenesis involves several genetic and environmental factors. However, as compared to the racial and genetic factors the environmental factors are more readily controlled10. The other risk factors are: diet, especially which is rich in fat, smoking, family history of breast cancer, depression and stress6. The appearance of lumps, compactness of dimple, redness, and soreness are the most common symptoms which are associated with the onset of breast cancer4. Genetic predisposition caused by a mutation in autosomal dominant genes is responsible for 5–10% of all breast malignancies. The genetic variation which is involved in the development of breast tumors is of two broad types; one is loss of function mutation in tumor suppressor gene which leads towards the uncontrolled cell growth and division, disturbance of the checkpoints of cell cycle and DNA mechanism of repair failure, while the second is in the proto-oncogene gain of function mutation. Before the age of 70 years, there is a 70% risk of breast cancer development in women's with inherited loss of function mutation10. There are several genes in which the mutations can affect the body differently and thus lead to the development of various types of breast cancer. The genes which are mainly involved in breast cancer includes BRCA1 and BRCA2 which cause 90% of breast cancer while other are HER2, PIK3, and deregulation of expression of three genes MDM2, RB and TPK53 can play a significant role in therapeutic vibes of breast cancer4. A multifunctional tetrameric transcription factor which is known as the tumor suppressor gene TP53 is the maintaining of genome stability is the major functions of wild-type p5 which plays a crucial role in the senescence, control of cell cycle progression, DNA repair and apoptosis11. The first tumor suppressor gene is the p53 that is described in 1979 and initially, it is believed to be an oncogene12. Human p53 is 20kb gene located on 17p13.1 it is a nuclear phosphoprotein of molecular weight 53 kDa, which consists upon 10 introns and 11 exons with more than 200 single nucleotide polymorphisms (SNPs) been identified in both non-coding and coding regions and the common polymorphisms in this gene showed association with increased risk which is reported by many published studies11.
The use of real-time PCR in clinical testing plays a crucial role as it can provide the information related to small alterations such as point mutation, gene expression, and gene loss or amplification and it also plays a useful job in the analysis of cancer markers13. It is a high-throughput technology, which is used for sensitive detection and accurate quantitation of the gene expression levels14. The mutant p53 results in genetically unstable cells as it is no longer able to control cell proliferation and resulting in inefficient DNA repair which may lead to the neoplasia due to genomic damage persistence15. In invasive breast cancer, molecular genetic profile of alterations in p53 is well characterized in contrast to ductal carcinoma in situ. As compared to molecular biology screening techniques immunohistochemical analysis of p53 expression is mostly done in ductal carcinoma in situ. Molecular biology screening techniques are used in a very few studies and of these the only three studies conducted for p53 sequence alterations in the ductal carcinoma in situ cohorts by using constant density gel electrophoresis (CDGE) or single-strand conformational polymorphism (SSCP) which then confirmed by using DNA sequence analysis of all potential SSCP/CDGE altered mobility patterns16. In the carcinogenesis process of breast, the important role of p53 alterations is reported in several studies. It is documented that mutations in p53 is around zero in low-grade ductal carcinoma in situ (DCIS) to 30–40% in high grade15. To the best of our knowledge, there is a lack of data on p53 gene expression in breast cancer by using real-time PCR, thus the purpose of the present study was to investigate the p53 gene expression in different grades of breast cancer as compared to the normal tissue by using the real-time PCR technique.
Materials and methods
Sample collection
Thirty (30) fresh Modified Radical Mastectomy samples were collected from different hospitals of Lahore, Punjab. Each sample was collected in two tubes, one tube having RNAlater or Ethanol and the other tube having 10% formalin. All samples were stored at -20°C before RNA extraction. This project was funded by the Higher education commission (HEC), Pakistan and ethical approval was taken from the Jinnah Hospital, Lahore and ethical consent was taken from patients.
Histopathological analysis of breast tumor tissues
The tissues present in 10% formalin were sent to histopathological labs of Fatima Memorial Hospital, Lahore for haematoxylin and eosin staining.
Gene expression of p53 gene by Real Time PCR
RNA was extracted by Qiagen extraction kit and concentration was measured by qubit® 3.0 fluorimeter (in vitrogen) was used along with qubit® RNA assay kit (Lot # 1007806).
Complementary DNA (cDNA) synthesis
RNA concentrations of all samples were equalized (100ng/µL). Complementary DNA (cDNA) was synthesized from each RNA sample by using the enzynomics DNA Synthesis kit (MB125).
The reagents and techniques are described in Table 1 and the cycling conditions are shown in Figure 1.
Table 1.
Reagents and techniques for the complementary DNA synthesis
| 1st Step | 2nd Step | ||
| Reagents | Volumes | Reagents | Volumes |
| RNA | 2µL (100ng/µL) | 10X RT Buffer | 2µL |
| Oligo-Dt | 1µL | Reverse | 1µL |
| Transcriptase | |||
| Random Hexamers | 1µL | dNTPs | 2µL |
| RNase Inhibitor | 0.5µL | ||
| 70°C. for 10 Minutes | DEPC water | 10.5µL | |
| Total | 20µL |
Figure 1.
Complementary DNA (cDNA) incubation temperature and timings on rotorgene Q
Primer designing
Primers were designed by primer 3 software covering the 100–150bp for gene expression studies of p53 gene (Table 2).
Table 2.
p53 and β actin (housekeeping gene) gene primers for Real Time PCR
| Name | Forward Primer | Reverse Primer | Number Of bases |
| Beta- Actin1- Human |
ACTCCTATGTGGGCAACGAG | AGGTGTGGTGCCAGATCTTC | 40 |
|
p53-1- Human |
CCCCTCCATCCTTTCTTCTC | ATGAGCCAGATCAGGGACTG | 40 |
Real-Time PCR amplification
For real time PCR SYBR green master mixture was used (Thermo scientific USA).
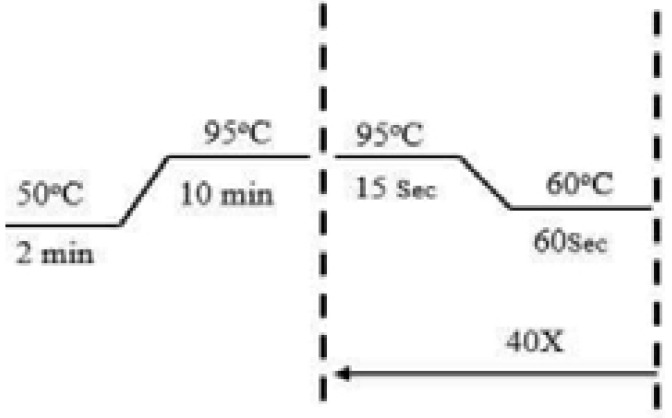
The beta actin gene was used as a reference gene while p53 gene was the target gene. The reaction was performed in triplicates. The rotorgene real time PCR machine was used. The reagents and recipe is given below in Table 3 and Figure 2.
Table 3.
Reagents and recipe for the PCR Reaction
| Reagents | Volume per 25µl reaction |
| SYBR Green | 12.5µl |
| Forward Primer | 1µl |
| Reverse Primer | 1µl |
| Water | 8.5µl |
| Template (cDNA) | 2µl |
Figure 2.
PCR cycling condition for Real-Time PCR of p53 gene
Gene expression folds change calculation
For expression data, the target gene p53 Ct was normalized with the β-actin Ct. The mean of Ct values of p53 gene and mean of Ct values of beta-actin gene were compared. The calculation was based on ΔΔCt or Livak method (Livak and Schmittgen, 2001). The formulas of livak method were added in the excel sheet and fold change values of all tumor samples were calculated as compared to reference gene and also as compared to normal adjacent breast sample.
Statistical analysis
Microsoft Excel was used for statistical analysis. T-test was used for the statistical analysis by the using excel chart and 95% Confidence Interval and 5% error was in built in the formula.
Results
Socio-demographic data of the samples
We collected the demographic data of patients, like age, sex, cast, area, income, marital status, cousin marriages or not, we did not find any co-relation with these parameters and grading system or grading and abnormal p53 gene expression.
Histopathological analysis
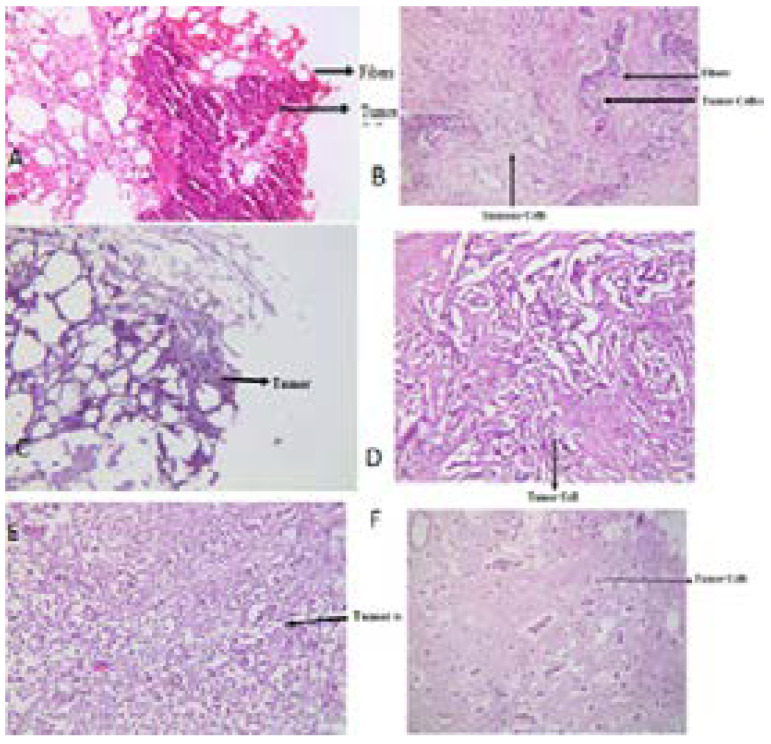
According to the histopathological reports obtained from Fatima Memorial Hospital, 7 samples were of grade I, 10 of grade II and 13 of grade III. In our study there was not any grade 4 samples (Figure 3).
Figure 3.
Representative pictures of some breast cancer sample
A- Sample No 19 grade III tumor under 10X
B- Sample No 20 grade III tumor under 10X
C- Sample No 22 grade III tumor under 10X
D- Sample No 23 grade III tumor under 10X
E- Sample No 13 grade II tumor under 10X
F- Sample No 17 grade II tumor under 10X
The grading was made by TNM grading system i.e. based on tumor, node involvement and metastatic spread, and representative reports on these tumor samples are shown in Figure 3.
The Nottingham histologic score is simply a scoring system to assess the grade of breast cancers. It is a total score based on 3 different sub-scores. The 3 sub scores were assigned based on 3 components of how the breast cancer cells look under a microscope. Each of the 3 features was assigned sub-score of 1, 2, or 3. 1 represent best, 2 represent moderate and 3 shows worst. Once the 3 sub-scores were added, a Nottingham score was obtained. The minimum score possible is 3 (1+1+1) and the maximum possible is 9 (3+3+3). The 3 components of Nottingham grading system are tubule formation, nuclear polymorphism and mitosis rate. If the tubule formation is more than 75%, it scores 1, 10–75% scores 2 and less than 10% scores 3. The nuclear grade is score on the basis of similarity of the nucleus morphology of the cancer cells to normal cells. Most similar nucleus of the cancer cells to normal cell nucleus is score 1 and the most different one is score 3. The mitosis rate of the cells is also scored on the basis that how much rapidly the cells grow. Slow cell division is score 1 and rapid cell division is score 3. The mitosis rate of the tumor cell is count under 10 high power field (hpf) microscope.
Gene expression in grade I tumors
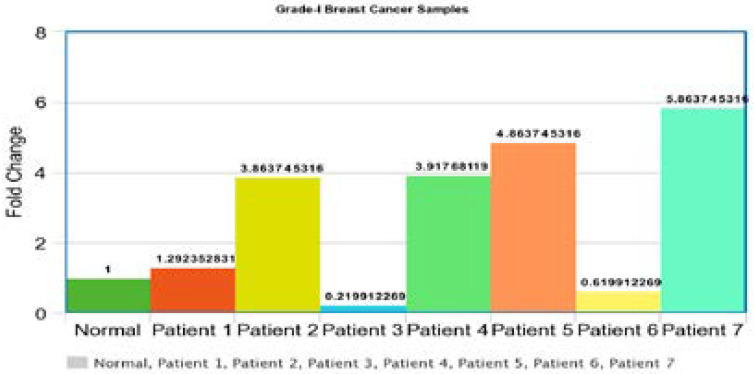
Gene Expression of p53 gene in grade-1 tumors was performed. The Ct values of each breast tumor were normalized with beta actin gene Ct values. The results were compared with normal breast sample and the 1 fold change was obtained for normal samples and the fold change above 1 showed the up-regulation and the fold change value below 1 was considered down-regulation. Out of 7 patients 5 showed up-regulation and 2 showed down regulations. All samples showed abnormal gene expression as compared to normal samples (Figure 4).
Figure 4.
Gene expression of p53 gene in grade-1 tumors
Gene expression in grade II tumors
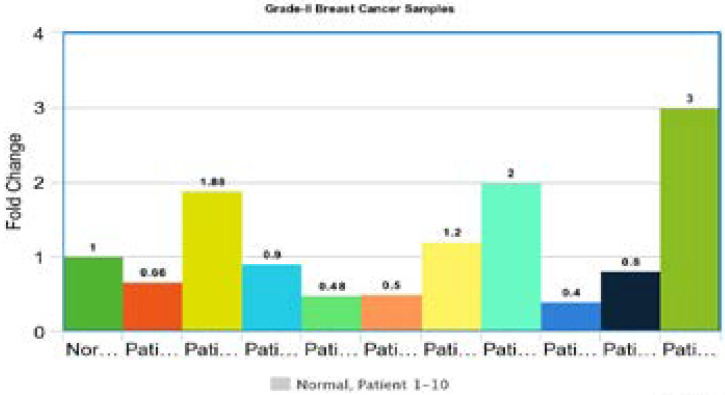
Gene Expression of p53 gene in grade-2 tumors was performed. The Ct values of each breast tumor were normalized with beta-actin gene's Ct values. The results were compared with normal breast samples and the 1 fold change was obtained for normal samples and the fold change above 1 showed the up-regulation and the Ct value below 1 was considered down-regulation. Out of 10 patients 4 showed up-regulation and 6 showed down regulations. All samples showed abnormal gene expression as compared to normal samples (Figure 5).
Figure 5.
Gene expression of p53 in grade II tumors
Gene expression of p53 gene in grade III tumors
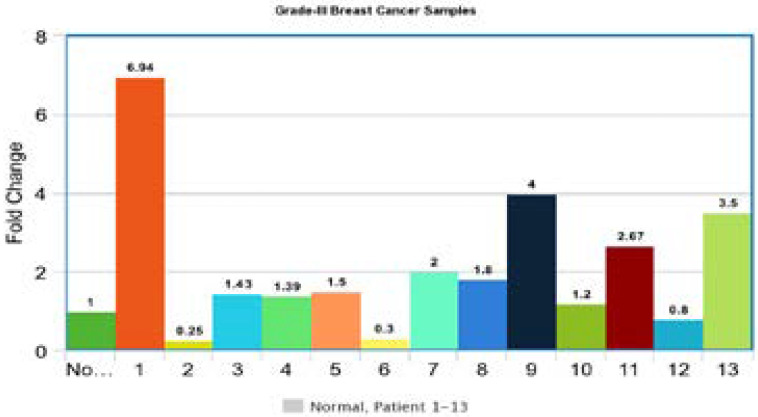
Gene Expression of p53 gene in grade III tumors was performed. The Ct values of each breast tumor were normalized with beta-actin gene Ct values. The results were compared with normal breast sample and the 1 fold change was obtained for normal samples and the fold change above 1 showed the up-regulation and the Ct value below 1 was considered down-regulation. Out of 13 patients 10 showed up-regulation and 3 showed down regulations. All samples showed abnormal gene expression as compared to normal samples (Figure 6).
Figure 6.
Gene expression of p53 gene in grade III tumors
Overall out of 30 samples 19 samples showed up regulation and 11 samples showed down regulation. Both types of results showed that p53 gene had some abnormal function in breast cancer and it has some. There was non-significant difference in fold change values of grade I, grade II and grade III, i.e. more than 0.05 (>0.05), while if we see the total number of patients showing up regulation and down regulation then there was significant difference and up regulation was more than down regulation (<0.0011), this is clear in Table 5.
Table 5.
Fold change differences among grade I, II and III breast tumors
| UP regulation | Down regulation | Grade 1 | Grade 2 | Grade 3 |
| 1.3 | 0.22 | 1.3 | 0.7 | 7 |
| 3.9 | 0.62 | 3.9 | 1.9 | 0.5 |
| 4 | 0.7 | 0.22 | 0.1 | 1.43 |
| 4.9 | 0.1 | 4 | 0.49 | 1.4 |
| 5.9 | 0.49 | 4.9 | 5 | 1.5 |
| 1.9 | 0.5 | 0.62 | 1.2 | 0.3 |
| 1.2 | 0.4 | 5.9 | 2 | 2 |
| 2 | 0.8 | 0.4 | 1.8 | |
| 3 | 0.5 | 0.8 | 4 | |
| 7 | 0.3 | 3 | 1.2 | |
| 1.43 | 0.8 | 2.7 | ||
| 1.4 | 0.8 | |||
| 1.5 | 3.5 | |||
| 2 | >0.05 All grades differences |
|||
| 1.8 | ||||
| 4 | ||||
| 1.2 | ||||
| 2.7 | ||||
| 3.5 | ||||
| t-test | 0.001084601 | |||
Discussion
The current study is performed to investigate the expression profile of the p53 gene by using real-time PCR in different grades of breast cancer tissues, as previously no such study is documented. The present study concludes the abnormal gene expression of p53 in all grades of the breast tumors. Lukas reported that the molecular biology screening techniques are less in use for the determination of p53 expression as compared to the immunohistochemical analysis which is commonly done in ductal carcinoma in situ17. The present research findings showed that p53 is up-regulated and down-regulated in different grades of breast cancer and current results are in accordance with the several published studies which investigated the vital role of p53 gene in the carcinogenesis process of the breast tumors. It was reported by a study that around zero mutation was found in p53 in low-grade ductal carcinoma in situ (DCIS) and 30–40% mutation in high grade15. Shokouh study results showed p53 association in breast carcinoma subtypes with tumor grade and lymph node involvement.
The p53 mutation rates were found to be higher in high grade breast cancer and in younger age groups. While patients of; infiltrative ductal were 18.35%, carcinoma in situ was in 26.5% of the patients and infiltrative lobular patients were 23.3%18. Baumbusch et al, have done a study in 88 patients of breast cancer on mRNA expression of full-length p53 and its isoform Δp53 by using quantitative real-time PCR in both p53 mutant and wild type and to the clinical and biological data, its mRNA expression was related. The results provides the significant association with molecular subtypes and grade of in the upper or lower quartile of tumors with mRNA expression levels while the levels were significantly elevated of both isoforms mRNA levels in tumors with frame or missense mutation as compared to splice mutation in which significant levels reduced of mRNA to those with p53 expressing wild type19. Similarly, another study on breast cancer stages II and III was investigated in relation with gene expression profiling. The results of this research showed that compared to the normal breast tissue, the gene expression profiling is deregulated in the clinical stages of II and III20. Another study was conducted on breast cancer patients on over expression of p53 and its association was related to clinical pathological features of the breast cancers.
The results showed a significant correlation with the higher nuclear grade, larger tumors and disease-positive lymph nodes 21. A study on the expression of p53 has demonstrated that an increased expression was significantly associated with increased tumor grade of invasive breast cancer (p<0.006), lymphocytic infiltration (p<0.004) and lymphovascular invasion (p<0.003) while the p53 in low grade of ductal carcinoma in situ of all cases was negative, while in 2/3 and all cases of intermediate grade and high grade it was positive5. Archer et al determined the expression of p53 in advanced breast cancers and results have shown that the out of 92 patient's p53 were positive in 53 (57.6%) patients having high stage tumors. In a current study most of the patients have grade II and III tumors. Similarly, study by Archer et al showed that grade wise distribution; 42.4% were of grade II and 54.3% were of grade III, which is correlated with high-grade tumors positive for p53 as p = 0.0822 as compared to our study which includes all patient population uniformly. Another study suggested that p53 plays a crucial role as a tumor suppressor and also supports the results of the current investigation23. Similarly a study conducted by Sekar also suggests the over expression of p53 is associated with high grades of breast cancer 24. Saif et al conducted a study on Hspb1 and Tp53 Mutation and Expression Analysis in Cat Mammary Tumors While exons 3, 4 and 7 of Tp53 have a only single variation at c.105A>A/G, c.465T>T/C and c.859G>T respectively. The locus c.1050G>G/A in exon 9 is a homozygous (G) in 2 tumors and heterozygous (G/A) in other 3 samples. Sixty percent of cancers showed up-regulated trend of Tp53 gene. This study concludes that tumor specific mutations and ectopic expression of Tp53 genes may be useful in the diagnosis of the mammary lesions 25.
The current study was used to investigate the p53 expression in humans by using real-time PCR in Pakistani population but for future the sample size should be increased for better understanding.
Conclusion
It is concluded from the present study that p53 gene may be correlated as a diagnostic marker of breast cancer as the loss of its normal function can leads toward the breast cancer progression and its over expression associated with breast cancer however large sample size is required for better understanding. The abnormal expression of p53 shows that there are some genetic and epigenetic factors which are the primal cause of an abnormal gene expression. It is recommended that perform next generation sequencing (NGS) of the gene to find out the mutations causing the abnormal behavior of p53 gene.
Table 4.
Histological Characteristics of Patients
| Sample No | Grad | Necrosis | Desm | Inflam | ||
| Tub | Pleo | Mito | ||||
| 19 | 3 | 3 | 1 | Not seen | Mild | No |
| 20 | 3 | 2 | 2 | Seen | Moderate | Mild |
| 22 | 3 | 3 | 2 | Not seen | Mild | Mild |
| 23 | 3 | 2 | 2 | Not seen | Mild | No |
| 13 | 3 | 2 | 1 | Not seen | Mild | Mild |
| 17 | 2 | 2 | 1 | Not seen | Mild | Moderate |
Acknowledgements
The authors acknowledge to administration of Jinnah Hospital, Lahore, Services Hospital Lahore, and Mayo Hospital Lahore for helping in collection of breast cancer tissues and Higher Education Commission for the grant No: 21-664SRGP/R&D/HEC/2015.
Conflicts of interest
There is no conflict of interest among the authors.
References
- 1.Stratton MR, Campbell PJ, Futreal PA. The cancer genome. Nature. 2018;458:719–724. doi: 10.1038/nature07943. [DOI] [PMC free article] [PubMed] [Google Scholar]
- 2.Ataollahi MR, Sharifi J, Paknahad MR, Paknahad A. Breast cancer and associated factors: a review. J Med Life. 2015;8:6–11. [PMC free article] [PubMed] [Google Scholar]
- 3.Akbar M, Akbar K, Naveed D. Frequency and correlation of molecular subtypes of breast cancer with clinicopathological features. J Ayub Med Coll Abbottabad. 2014;26(3):290–293. [PubMed] [Google Scholar]
- 4.Amjad A, Khan IK, Kausar Z, Saeed F, Azhar L, Anwar P. Risk factors in breast cancer progression and current advances in therapeutic approaches to knockdown breast cancer. Clin Med Biochem. 2018;4:1. [Google Scholar]
- 5.Muhammad EMS, Ahmad A N, Guirguis MN, Ali AM. Immunohistochemical p53 expression in breast carcinoma with correlation to clinico-pathological parameters. Med. J. Cairo Univ. 2012;80(2):179–189. [Google Scholar]
- 6.Menhas R, Umer S. Breast cancer among Pakistani women. Iran J Public Health. 2015;44(4):586–587. [PMC free article] [PubMed] [Google Scholar]
- 7.Bansal C, Pujani M, Sharma KL, Srivastava AN, Singh US. Grading systems in the cytological diagnosis of breast cancer: a review. J Cancer Res Ther. 2014;10(4):839–845. doi: 10.4103/0973-1482.140979. [DOI] [PubMed] [Google Scholar]
- 8.Usman A, Ali A, Lakhanna NK, Zafar H. Frequency of benign and malignant breast lesions: a histopathological analysis. Isra Medical Journal. 2016;8(3):138–140. [Google Scholar]
- 9.Mohapatra M, Satyanarayana S. Evaluation of clinico: Pathologic findings of breast carcinoma in a general hospital in Southern India. Indian J Cancer. 2013;50(4):297–301. doi: 10.4103/0019-509X.123594. [DOI] [PubMed] [Google Scholar]
- 10.Pervaiz R. Genetic mutations associated with breast cancer in Pakistan. Malaysian Journal of Medical and Biological Research. 2015;2(3):308–313. [Google Scholar]
- 11.Sharma S, Sambyal V, Guleria K, Manjari M, Sudan M, Uppal MS. Tp53 polymorphisms in sporadic north indian breast cancer patients. Asian Pac J Cancer Prev. 2014;15(16):6871–6879. doi: 10.7314/apjcp.2014.15.16.6871. [DOI] [PubMed] [Google Scholar]
- 12.Gasco M, Shami S, Crook T. The p53 pathway in breast cancer. Breast Cancer Res. 2002;4:70–76. doi: 10.1186/bcr426. [DOI] [PMC free article] [PubMed] [Google Scholar]
- 13.Mitas M, Mikhitarian K, Walters C, Baron PL, Elliott BM, Brothers TE. Quantitative real-time RTPCR detection of breast cancer micrometastasis using a multigene marker panel. Int J Cancer. 2001;93(2):162–171. doi: 10.1002/ijc.1312. [DOI] [PubMed] [Google Scholar]
- 14.Bernard PS, Wittwer CT. Real-time PCR technology for cancer diagnostics. Clin Chem. 2002;48(8):1178–1185. [PubMed] [Google Scholar]
- 15.Al-Joudi FS, Iskandar ZA, Rusli J. The expression of p53 in invasive ductal carcinoma of the breast: a study in the North-East States of Malaysia. Med J Malaysia. 2008;63(2):96–99. [PubMed] [Google Scholar]
- 16.Livak KJ, Schmittgen TD. Analysis of relative gene expression data using real-time quantitative PCR and the 2− ΔΔCT method. Methods. 2001;25(4):402–408. doi: 10.1006/meth.2001.1262. [DOI] [PubMed] [Google Scholar]
- 17.Lukas J, Niu N, Press MF. P53 mutations and expression in breast carcinoma in situ. Am J Pathol. 2002;156(1):183–191. doi: 10.1016/S0002-9440(10)64718-9. [DOI] [PMC free article] [PubMed] [Google Scholar]
- 18.Shokouh TZ, Ezatollah A, Barand P. Interrelationships between Ki67, HER2/neu, p53, ER, and PR status and their associations with tumor grade and lymph node involvement in breast carcinoma subtypes: retrospective-observational analytical study. Medicine (Baltimore) 2015;94(32):e1359. doi: 10.1097/MD.0000000000001359. [DOI] [PMC free article] [PubMed] [Google Scholar]
- 19.Baumbusch LO, Myhre S, Langerod A, Bergamaschi A, et al. Expression of full-length p53 and its isoform Δp53 in breast carcinomas in relation to mutation status and clinical parameters. Mol Cancer. 2006;5:47. doi: 10.1186/1476-4598-5-47. [DOI] [PMC free article] [PubMed] [Google Scholar]
- 20.Folgueira MA, Brentani H, Katayama ML, et al. Gene expression profiling of clinical stages II and III breast cancer. Braz J Med Biol Res. 2006;39(8):1101–1113. doi: 10.1590/s0100-879x2006000800013. [DOI] [PubMed] [Google Scholar]
- 21.Kikuchi S, Nishimura R, Osako T, et al. Definition of p53 overexpression and its association with the clinicopathological features in luminal/HER2-negative breast cancer. Anticancer Research. 2013;33(9):3891–3897. [PubMed] [Google Scholar]
- 22.Archer S G, Eliopoulos A, Spandidos D, Barnes D, Ellis I O, Blamey R W, et al. Expression of ras p21, p53 and c-erbB-2 in advanced breast cancer and response to first line hormonal therapy. British Journal of Cancer. 1995;72:1259. doi: 10.1038/bjc.1995.497. [DOI] [PMC free article] [PubMed] [Google Scholar]
- 23.Constantinou C, Papadopoulos S, Karyda E, Alexopoulos A, Agnanti N, Batistatou A. Expression and Clinical Significance of Claudin-7, PDL-1, PTEN, c-Kit, c-Met, c-Myc, ALK, CK5/6, CK17, p53, EGFR, Ki67, p63 in Triple-negative Breast Cancer-A Single Centre Prospective Observational Study. In vivo. 2018;32(2):303–311. doi: 10.21873/invivo.11238. [DOI] [PMC free article] [PubMed] [Google Scholar]
- 24.Sekar P, Bharti JN, Nigam JS, Sharma A, Soni PB. Evaluation of p53, HoxD10, and E-cadherin status in breast cancer and correlation with histological grade and other prognostic factors. Journal of Oncology. 2014:1–4. doi: 10.1155/2014/702527. [DOI] [PMC free article] [PubMed] [Google Scholar]
- 25.Saif R, Awan AR, Lyons L, Gandolfi B, Tayyab M, Babar ME, Mehmood AK, Ullah Z, Wasim M. Hspb1 and Tp53 mutation and expression analysis in cat mammary tumors. Iran J Biotechnol. 2016;14(3):202. doi: 10.15171/ijb.1480. [DOI] [PMC free article] [PubMed] [Google Scholar]


