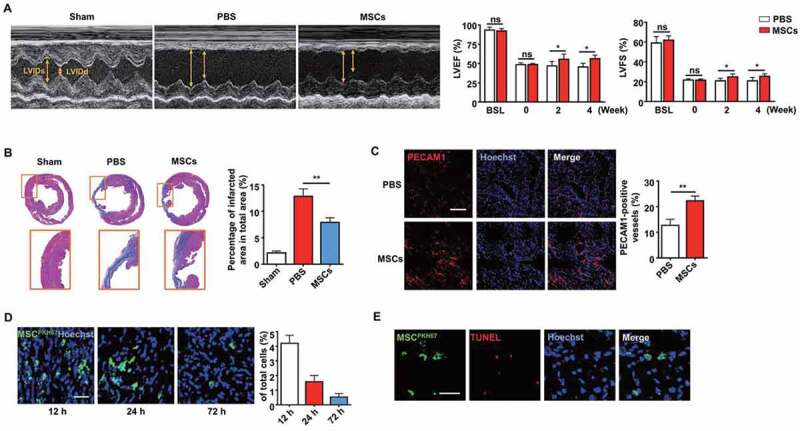
Figure 1.

Injection of MSCs improved cardiac function after MI. (A) M-mode echocardiogram from sham, PBS-treated, and MSC-treated rats 4 weeks after MI. LVEF and LVFS of the hearts 0 week, 2 weeks and 4 weeks after MI. BSL, baseline prior to MI. (B) Masson’s trichrome staining images from the mid-papillary region of the infarcted hearts 4 weeks after MI. Fibrosis of the infarcts was quantified by ImageJ software. (C) Confocal microscopy images of capillary profiles in the infarction border zone 4 weeks after treatment. The % represents the area of PECAM1-positive cells over total area. Scale bar: 100 µm. (D) Confocal microscopy images showing decreased MSCs in the local injection area at 12 h, 24 h and 72 h after the injection. The fluorescence intensity was quantified. Scale bar: 50 µm. (E) Images of the border zone after MSC injection for TUNEL staining. MSCs were pre-labeled with PKH67 (green) before intracardiac injection. Apoptotic nuclei were indicated by red fluorescence after the transplantation. Scale bar: 50 μm. n = 7 rats per group (A, B, C). The results were representative of the data generated in at least 3 independent experiments. The data were presented as mean ± SEM. ns, not significant; *P < 0.05; **P < 0.01 by Student’s t-test (A, C) or one-way ANOVA (B)
