

ABSTRACT
Adipose tissue (AT) fibrosis in obesity compromises adipocyte functions and responses to intervention-induced weight loss. It is driven by AT progenitors with dual fibro/adipogenic potential, but pro-fibrogenic pathways activated in obesity remain to be deciphered. To investigate the role of macroautophagy/autophagy in AT fibrogenesis, we used Pdgfra-CreErt2 transgenic mice to create conditional deletion of Atg7 alleles in AT progenitor cells (atg7 cKO) and examined sex-dependent, depot-specific AT remodeling in high-fat diet (HFD)-fed mice. Mice with atg7 cKO had markedly decreased extracellular matrix (ECM) gene expression in visceral, subcutaneous, and epicardial adipose depots compared to Atg7lox/lox littermates. ECM gene program regulation by autophagy inhibition occurred independently of changes in the mass of fat tissues or adipocyte numbers of specific depots, and cultured preadipocytes treated with pharmacological or siRNA-mediated autophagy disruptors could mimic these effects. We found that autophagy inhibition promotes global cell-autonomous remodeling of the paracrine TGF-BMP family landscape, whereas ECM gene modulation was independent of the autophagic regulation of GTF2IRD1. The progenitor-specific mouse model of ATG7 inhibition confirms the requirement of autophagy for white/beige adipocyte turnover, and combined to in vitro experiments, reveal progenitor autophagy dependence for AT fibrogenic response to HFD, through the paracrine remodeling of TGF-BMP factors balance.
Abbreviations: CQ: chloroquine; ECM: extracellular matrix; EpiAT: epididymal adipose tissue; GTF2IRD1: general transcription factor II I repeat domain-containing 1; HFD: high-fat diet; KO: knockout; OvAT: ovarian adipose tissue; PDGFR: platelet derived growth factor receptor; ScAT: subcutaneous adipose tissue; TGF-BMP: transforming growth factor-bone morphogenic protein
KEYWORDS: ATG7, chloroquine, collagen, extracellular matrix, fibrosis, obesity, subcutaneous adipose tissue
Introduction
In obesity, chronic energy excess results in fat mass accumulation via enlargement of existing adipocytes and the recruitment of progenitors to generate new fat cells [1]. The adipose tissue microenvironment is concomitantly impacted, as the network of blood vessels in the vicinity of which progenitors reside also expands [2], and resident immune cells become polarized toward a pro-inflammatory phenotype [3]. Chronically, adipose tissue (AT) low-grade inflammation is frequently observed and highly connected to the deterioration of metabolic health along with tissue fibrosis, which is defined by the accumulation of excessive extracellular matrix (ECM) and stiffness [4]. AT fibrosis ultimately compromises adipose tissue metabolic flexibility as well as whole-body homeostasis, and negatively predicts response to weight loss interventions [5,6].
Central to the development of adipose tissue fibrosis is a progenitor cell population positive for PDGFRA (platelet derived growth factor receptor, alpha polypeptide) expression, which is a reservoir for fibroblast activation [7–9]. PDGFRA cells can also differentiate into new adipocytes with a white (fat storing) or a beige (with inducible thermogenic activity) phenotype [10,11]. Thus, due to their dual potential toward adipocyte or fibroblast differentiation, they are referred to as fibro/adipogenic progenitors. Beyond the formation of anatomically defined fat pads, PDGFRA+ progenitors also govern fat cell deposition in other organs such as the heart, in particular, the cardiac atria, by supporting adipocyte formation and epicardial lipid accumulation [12].
How obesity-related AT fibrosis develops is still poorly understood, despite its adverse consequence on AT flexibility (i.e., energy-dependent switches in repeated states of expansion and shrinkage), which limits weight loss outcomes to bariatric surgery treatment. Recent work from our team identified a progenitor subclass marked by CD9 surface expression in mice and humans, which is associated with the production of fibrosis in visceral AT [9]. Inflammation and particularly TLR4 activation, a hallmark of the obese AT microenvironment perturbation, was also shown to contribute to obesity-induced fibrosis in mice [13]. Finally, because alternatively-activated macrophages (M2-like) participate in extracellular collagen degradation through a mannose receptor phagocytic pathway [14], altered balance in M2/M1 macrophage polarization in obesity is likely to favor extracellular matrix accumulation in the long term, due to lack of clearance of extracellular material.
Plasticity in fates of fibro/adipose cells was recently reported in the hair follicle niche, where fat cells could regenerate from myofibroblasts after wound healing [15]. Thus, AT fibrogenic response might result from a progenitor switch driven by factors in the tissue microenvironment. To investigate the functional pathways governing this switch, we manipulated the autophagy pathway, which is key in cell fate determination. Pioneer electron microscopy studies of 3T3-L1 cells identified autophagy as a crucial morphological episode in cytoplasm/organelle transformation during adipocyte conversion [16], and later studies on fat cell formation have described the reciprocal relationship between autophagy and ciliogenesis [17], disrupted in rare forms of obesity presenting with ciliopathies. Accordingly, genetic mice models with adipocyte-specific autophagy deficiency produce lean animals with impaired fat cell development [18].
We here created a mouse model of conditional autophagy inhibition in adipose progenitors by inactivating Atg7 in cells expressing inducible Cre recombinase under the control of a Pdgfra gene promoter and explored AT of these animals under obesogenic conditions. We found that autophagy inhibition in progenitors strongly attenuated AT fibrogenic response to a high-fat diet (HFD). In several fat depots, including the pericardial cell layer of the atria, fibrogenic and ECM program was highly impaired in mice with autophagy deficiency. Mechanistically, we show that autophagy inhibition triggers a cell-autonomous fibrogenic impairment linked to profound remodeling of the TGF-BMP signaling gene program.
Results
Depot- and sex-dependent efficiency of a Pdgfra promoter to target AT progenitors autophagy
PDGFRA expression is a well-established feature of AT progenitors (Figure 1A). Still, there is controversy on the efficiency of the Pdgfra-Cre model to target adipose tissue precursors in studies using male mice [10,19]. Considering female as well as male mice, we have used a floxed fluorescent reporter to assess its effectiveness in FACS-purified progenitor populations from HFD-fed animals (Figure 1B). We observed that Cre-mediated gene deletion occurred in female subcutaneous AT (ScAT) with the highest frequency (76%) but was not detectable in periovarian AT (OvAT). In males, we found that approximately 40% of progenitors recombined in ScAT or visceral epidydimal AT (EpiAT). To inhibit autophagy, we selected Atg7 as a target gene, because i) Cre recombinase activity at the Atg7 locus was used in several studies using different tissue-specific promoters [18,20–22] and ii) in previous analysis of FACS sorted PDGFRA+ progenitors isolated from fibrosis-prone AT of C3H/HeOuJ mice strain fed with a HFD that had acquired a myofibroblastic phenotype [9], Atg7 was the most strongly induced among a set of autophagy-related genes (Figure 1C). We cross-bred Pdgfra-CreErt2 transgenic animals with mice homozygous for a floxed exon 14 at the Atg7 locus, all on a pure C57/Bl6 genetic background, to produce Atg7lox/lox and Atg7lox/lox-Pdgfra-CreErt2 littermates that were treated with tamoxifen post-weaning for 5 d to induce Atg7 inhibition in recombinase expressing cells, before shifting to HFD. As expected, qPCR analysis of Atg7 mRNA indicated unaffected expression in AT macrophages, but the specific reduction in FACS-sorted AT PDGFRA+ progenitors of Cre+ versus Cre− animals (Figure 1D). In agreement with the monitoring of Cre mediated recombination in Figure 1B, we found that approximately 50% of Atg7 mRNA was ablated in subcutaneous or male visceral AT, and confirmed that only 20% of progenitor Atg7 expression could be targeted in the visceral fat of female mice. In agreement with efficient recombination in subcutaneous fat of female mice, reduction of ATG7 protein content is detected in ScAT of Atg7lox/lox-Pdgfra-Cre female mice without a need of tissue fractionation (Figure 1E), accompanied by decreased LC3-II lipidated form, a marker of autophagosome density downstream of ATG7 (Figure 1E,F), indicating disrupted autophagy. Thus, in our hands (i.e., mice maintained under obesogenic HFD), Pdgfra promoter-driven gene recombination can target progenitors, although in a depot- and sex-specific manner. As recombination was poorly efficient in periovarian depots of female mice, subsequent experiments excluded this fat pad in AT phenotyping.
Figure 1.
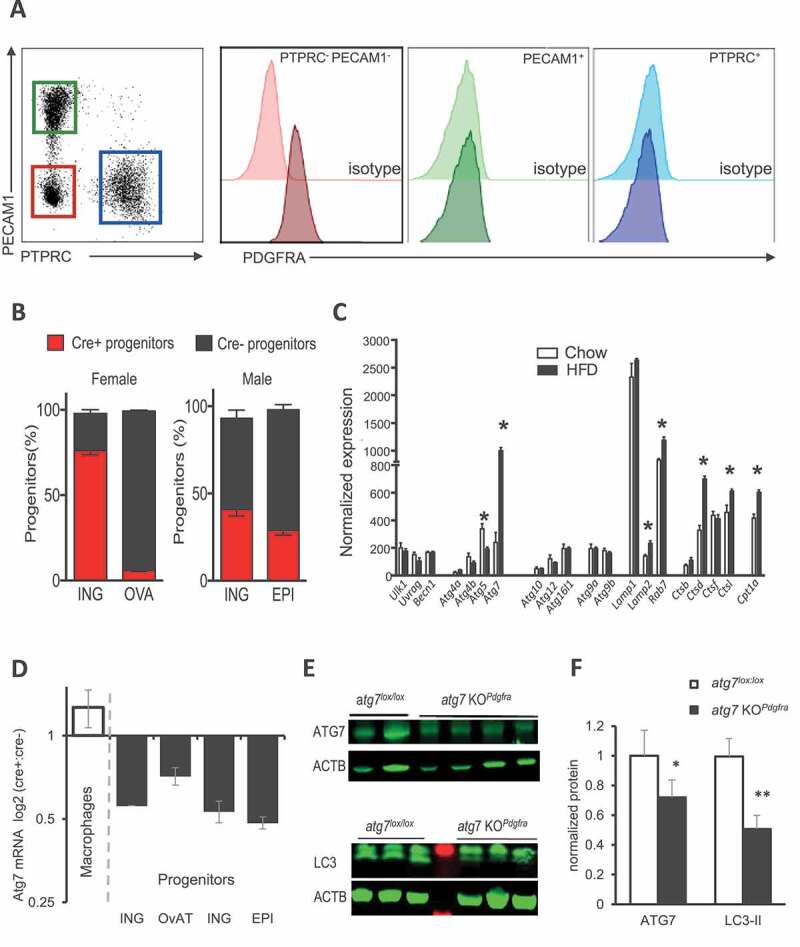
Sex- and depot-specific efficiency of Pdgfra promoter for AT progenitor targeting. (A) PDGFRA expression on cells from AT stroma-vascular fraction (SVF). Following collagenase digestion of AT, flow cytometry analysis was performed as described in [9], and PDGFRA expression was examined on 3 cell subsets: the endothelial cells (PECAM1/CD31+), the leucocytes (PTPRC/CD45+) and cells from SVF that do not express PECAM1 and PTPRC (PECAM1− PTPRC−). Here, we confirmed that PDGFRA, a marker of adipose progenitors, was not expressed in leukocytes or endothelial cells. (B) Using flow cytometry, the ratio of PDGFRA+ progenitors expressing Cre after tamoxifen gavage was evaluated in inguinal and perigonadal AT from females and males, based on fluorescent reporter protein expression. Mean values± s.e.m. are calculated from 4 cell preparations in each group. (C) Analysis of microarray data of FACS-purified progenitors (PDGFRA+) from adipose tissue of fibrosis-prone C3H mice fed with an HFD or a control chow diet for 8 weeks. A subset of autophagy-related genes is shown. (D) qPCR analysis of Atg7 mRNA expression in AT FACS purified PDGFRA+ progenitors and macrophages. 1–2 AT were pooled for cell fractionation and subsequent RNA extraction. Data are expressed as the ratio of Rna18s normalized Atg7 mRNA. (E–F) ATG7 and LC3 protein expression in subcutaneous adipose tissue of littermates, fed HFD for 10 weeks. ACTB was used as a loading control. Representative western blots of female ScAT (each lane is an individual mouse) and densitometric quantification of signals after normalization to ACTB are shown
Atg7 deficiency in adipose tissue progenitors attenuates HFD-induced fibrogenic programming
After 10 weeks on HFD, mice adipose tissue morphology was examined by immunostaining of paraffin-embedded AT slices for PLIN (perilipin)/DAPI to determine fat cell areas or Picrosirius red staining to visualize extracellular matrix deposition (Figure 2A). Significantly less Picrosirius red labeling was detected in the ScAT of atg7 KOPdgfra compared to control female mice (Figure 2B), indicating that progenitor autophagy could modulate fat tissue ECM deposition. We then examined ECM gene expression in different AT locations, namely the ScAT tissue of females and males, and the EpiAT of males. In atg7 KOPdgfra, we consistently observed a significant reduction of the mRNAs encoding three fibrillary collagen alpha chains compared to controls (Figure 2C–E). The expression of several genes encoding other ECM components such as Fn1 (fibronectin 1), Spp1 (secreted phosphoprotein 1 or osteopontin), or ECM modifying factors such as Timp1 (Tissue inhibitor of metalloproteinase 1) and Loxl1/2 (lysyl oxidase-like 1/2) were also decreased in atg7 KOPdgfra mice, with different intensities depending on the AT site (Figure 2C–E). However, we found similar Hif1a and Mmp2 mRNA in the ScAT of the two groups of mice (data not shown), although AT fibrosis has been involved in dysregulation of Hif1a or neutral matrix. We have also examined ECM gene expression in the ScAT of healthy mice fed with chow and confirmed that ECM genes were expressed at lower levels in control mice fed with chow than in Atg7lox/lox mice fed with HFD (Figure S1A) indicating a strong dependence of ECM gene regulation on diet/obesity. Moreover, in ScAT of chow-fed mice, ECM genes were expressed in the range of that found in atg7 KOPdgfra mice fed with HFD, suggesting that progenitor autophagy competency is required for ECM gene upregulation by HFD.
Figure 2.
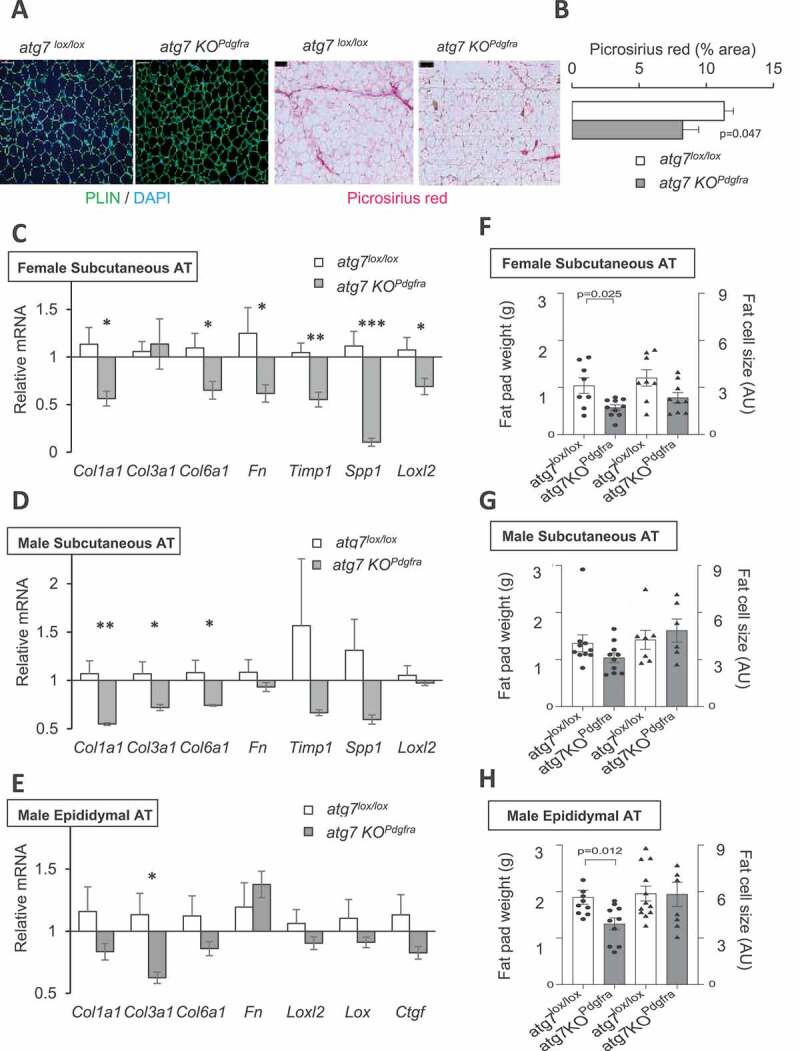
Progenitor Atg7 deficiency impacts the adipose tissue ECM program. (A) Paraffin-embedded slides were immunolabelled with PLIN/DAPI or stained with picrosirius red to image extracellular collagens. Scale bar: 100 µm. (B) After thresholding using ImageJ, the picrosirius red label was quantified from five different fields per sample. Mean values were calculated from 6–9 mice per group, after adjusting for differences in the fat cell area. (C-E) ECM-related gene expression in female mice ScAT (C) male mice ScAT (D) or male EpiAT (E). mRNA levels were normalized to 18S RNA. Values are mean ± sem from 9 mice per group. Symbols *, **, or *** indicate significant differences between groups of sex-matched littermates (by Mann-Whitney test) with p < 0.05, p < 0.01, or p < 0.001 respectively. (F-H) Fat pad weight and adipose cell size in AT depots. Bars indicate mean values ± sem of 6–9 individual animals per group. Fat pad weight is plotted on the left axis, and the right axis is fat cell size, calculated from quantification of PLIN/DAPI images. P values by Man-Whitney tests are indicated when significant (<0.05)
Noticeably, AT ECM gene program attenuation in atg7 KOPdgfra was observed in the hypotrophic ScAT of females (Figure 2C) that contained smaller adipocytes (Figure 2F), but also in the ScAT of males (Figure 2D) that developed normally (Figure 2G), although with a reduced number of fat cells (Fig. S1B). In the poorly developed EpiAT of males that had normal-sized adipocytes (Figure 2H), we also found a reduction of Col3a1 gene expression (Figure 2E). Moreover, at the end of the HFD, atg7 KOPdgfra (both males and females) had lower body weights than controls (Figure S2B), but only females had significantly reduced fat mass (Figure S2B). Triglyceride levels in serum and in the liver were not different in the two groups of mice (Figure S2C), indicating that ectopic lipid accumulation does not compensate for the lower adiposity in autophagy-deficient females. These results indicate that the reduction of ECM gene expression not solely depends on site-specific modulation of AT mass, the fat cell size, or adipocyte numbers. We also examined potential changes in local AT microenvironment that could modulate fibrogenic response, particularly AT inflammation. CD68, ADGRE1/Emr1, CD163, CD14, and CCL2/Mcp1 inflammation markers were not different in the subcutaneous fat of atg7 KOPdgfra male or female versus respective Atg7lox/lox controls (Figure S2A), indicating a minimal role of the inflammatory microenvironment. Thus, progenitor autophagy deficiency affects adipose tissue ECM gene program, independent on local fat tissue development and inflammation.
To further document the contribution of progenitor autophagy, we next investigated ECM deposition driven by PDGFRA+ AT progenitors that reside outside adipose tissue, for instance, by PDGFRA+ cells located in the sub-epicardial layer of the mouse atria (Figure 3A) which provide a source for heart remodeling [12]. We established a fibrosis score using cardiac tissue staining with Masson’s trichrome blue, defined as the proportion of atrial surface delineated with blue color (Figure 3B and Table S1). A lower fibrosis score in the hearts of HFD-fed atg7 KOPdgfra compared to Atg7lox/lox control mice (Figure 3C) indicated lower ECM deposition, as well as decreased epicardial AT accumulation (Figure 3D). Gene expression of ECM markers was also lower in dissected atria of atg7 KOPdgfra compared to Atg7lox/lox controls (Figure 3E). Together, these data indicate a role of autophagy in progenitor-driven matrix deposition following HFD, which is not limited to fat depots but also observed in cardiac progenitors.
Figure 3.
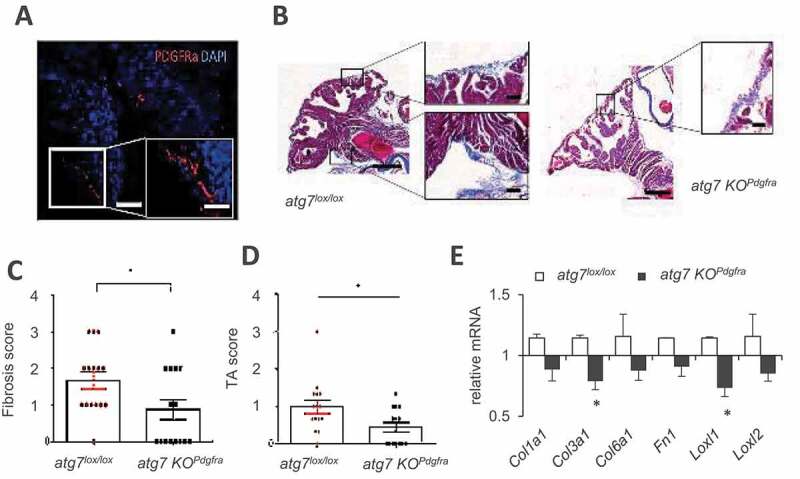
Progenitor Atg7 deficiency impacts ECM in heart atria. (A) Immunostaining indicating the presence of PDGFRA-positive cells in the epicardial layer of heart atria. (B) Blue Masson’s trichrome staining of 7 µm sections of atria from male mice fed HFD for 16 weeks. Scale bar: 50 µm, 100 µm. Morphological features of images served to calculate a fibrosis index (C) and epicardial AT score (D) in atg7lox/lox mice (n = 18, red dots) and atg7 KOPdgfra mice (n = 15, black dots). (E) ECM gene expression analysis in dissected mouse atria (7 mice per genotype). Relative gene expression is normalized to 18S, and significant differences are indicated as *
Autophagy inhibition affects the cell-autonomous ECM gene program linked to TGF-BMP pathway remodeling, independently of GTF2IRD1 and Mir29
To demonstrate the causative effects of autophagy deficiency on ECM gene downregulation, we used a culture system of primary progenitors isolated from the stroma-vascular fraction of mouse subcutaneous fat, directly exposed to autophagy inhibitors or siRNA-mediated Atg7 knockdown. In this cell model, the lysosomal inhibitor chloroquine (CQ) drastically decreased the expression of several collagen chain genes and remodeling enzymes as Loxl1/2, Fn1, and Acta2 (Figure 4A). Atg7 knockdown had similar effects (Figure 4B), although less marked likely due to Atg7 mRNA residual expression (15%). To gain insight into mechanisms, we reasoned that autophagy inhibition could exert anti-fibrotic effects by suppressing proteolytic clearance of an endogenous regulator of ECM gene program. Among negative factors whose accumulation could inhibit ECM gene expression, GTF2IRD1 was recently reported as an important transcriptional regulator in AT fibrosis [23], and therefore a good candidate mediator of anti-fibrotic effects of autophagy inhibition.
Figure 4.
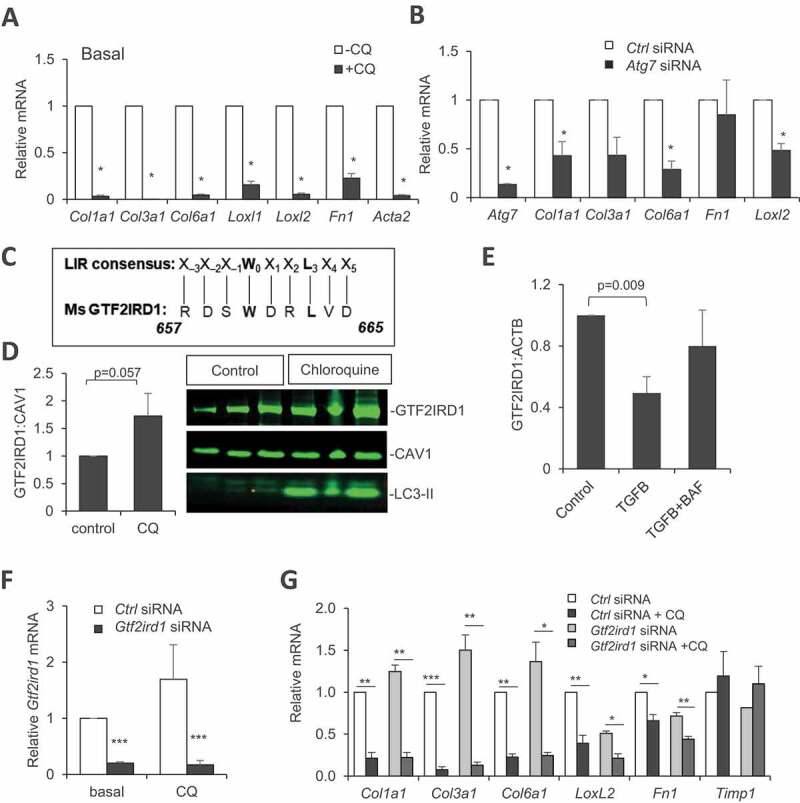
Cell-autonomous inhibition of collagen gene expression by autophagy inhibitors or siRNA-mediated Atg7 knockdown, dependence on GTF2IRD1. (A-B) Collagen gene expression in cultured preadipocytes treated for 16 h with 25 µM chloroquine (A) or in Atg7 siRNA-transfected cultured preadipocytes (B). (C) Alignment of mouse GTF2IRD1 protein sequence with the consensus motif for LC3 interaction. (D-E) GTF2IRD1 protein expression and quantification in cultured cells after chloroquine (D) or bafilomycin A1 (E) treatment. (F) Inhibition of Gtf2ird1 mRNA expression (normalized to 18S) by siRNA in cultured preadipocytes from ScAT. (G) Collagen gene expression in cells transfected with Gtf2ird1 siRNA or control siRNA in the presence or absence of chloroquine (added 1 d post-transfection for 16 h). All values are means of at least three independent experiments. Stars indicate significant differences (p < 0.05) by Student’s t test
Moreover, we found an amino-acid motif in the GTF2IRD1 protein sequence matching the consensus site of an LC3 interacting region (LIR) required for the taken up of cargos by autophagic vesicles, which suggests possible autophagy-dependent regulation of this factor (Figure 4C). GTF2IRD1 protein readily accumulated in cells treated with chloroquine, as did the autophagosome marker LC3-II (Figure 4D). Addition in the culture medium of pro-fibrotic TGFB1 reduced GTF2IRD1 content, and lysosome inhibition abolished this effect (Figure 4E). This result agrees with the control of GTF2IRD1 protein content by autophagy. However, siRNA-mediated downregulation of GTF2IRD1 (Figure 4F) was unable to obliterate chloroquine-induced inhibition of ECM genes (Figure 4G), indicating that GTF2IRD1 is dispensable, and therefore not the mediator of autophagy-dependent fibrotic gene inhibition. We next tested the possible involvement of Mir29, another well-known inhibitor of ECM gene expression and tissue fibrosis [24]. We found no change in Mir29 contents upon CQ treatment, despite efficient downregulation of Col1a1 and Col6a1 mRNA in CQ-treated cells, ruling out the implication of Mir29 (Figure S3A).
A broader screen for genes involved in the TGF-BMP signaling pathway confirmed that most of them were detected and well expressed in our cell system. Forty two out of 86 genes were significantly (FDR<0.05) dysregulated in CQ-treated cells (Figure S3B), among which are downregulated Col1a1 and Col1a2 mRNA as previously observed. Also, CQ-treated progenitors downregulated several genes encoding ECM components like Dcn (decorin) and Thbs1 (thrombospondin 1) (Figure S3C). Of note, cultured preadipocytes treated with CQ resulted in the dysregulation of a number of signaling components (Figure 5A), including genes encoding secreted members of the TGF/BMP family such as Fst (follistatin), Lefty1 (left right determination factor 1), Gdf5 (growth and differentiation factor 5), Gdf6, and Tgfb3 (transforming growth factor beta 3) that showed decreased expression compared to untreated cells. CQ treatment not only decreased paracrine members but also genes encoding several surface receptors including Acvr2a (activin A receptor type II), Bmpr2 (bone morphogenic receptor protein type II [serine/threonine kinase]), as well as genes encoding intracellular signaling components of the TGF-BMP pathway including transcriptional regulators: Smad2 and Smad5 (SMAD family member 2 and 5). When presented as a correlation network to identify nodes with strongest associations (filter at p > 0.997, absolute values), two groups of positively-associated genes were identified, centered on core elements of the signaling machinery or more accessory regulatory components, likely to drive observed changes (Figure 5B). To explore the in vivo relevance of this finding from CQ treated cells, we tested the expression of some of the most decreased genes in the ScAT of atg7 KOPdgfra female mice with reduced fibrosis (Figure 5C) or in cultured progenitors with Atg7 knockdown (Figure 5D). We found downregulated Fst, Lefty1, Acvr2, and Bmpr2 mRNAs in Atg7-deficient cells compared to respective control conditions. Furthermore, Lefty1 gene expression positively correlated with picrosirius staining in ScAT (Figure 5E), which is in favor of a contribution of this gene product to ECM deposition. Altogether, we provide an indication of profound remodeling of the pro- and anti-fibrotic gene expression landscape, and disruption of the balance of TGF-BMP family members in autophagy-deficient progenitors.
Figure 5.
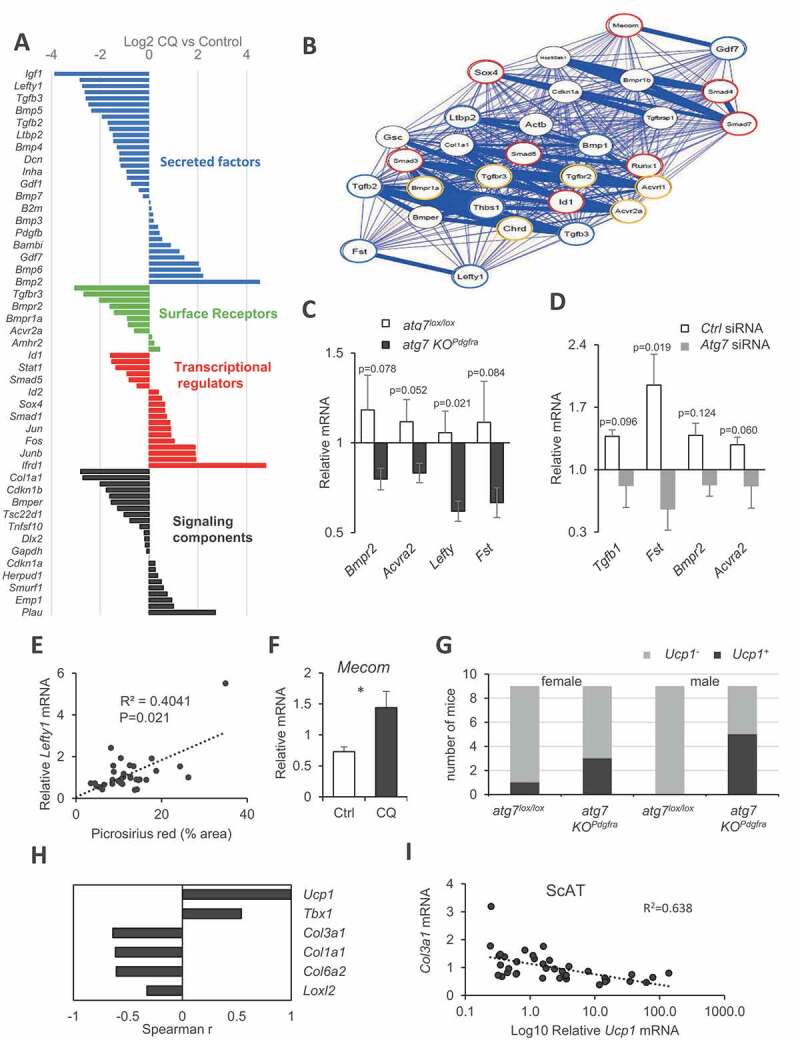
TGF-BMP family imbalance and AT browning after autophagy inhibition. (A) Change in TGF-BMP family gene expression upon chloroquine treatment (16 h) of cultured preadipocytes. Bars indicate fold-change of mean values from three independent culture batches evaluated by PCR array. Colors indicate gene subgroups arranged by functional categories. (B) Correlation network established using qgraph R Package. Nodes with correlation coefficients above a threshold (p > 0.997, absolute values) with positive (blue) or a negative (red) association are shown. (C) Gene expression in the ScAT of female atg7 KOPdgfra or atg7lox/lox control mice. Bars are mean values ± s.e.m. (normalized to Rn18s) of 8 individual mice in each group. P values are indicated. (D) mRNA expression (relative to Rn18s) in siRNA-mediated Atg7 invalidation in cultured ScAT preadipocytes. Mean values ± s.e.m. are calculated from 3 independent cell preparations. (E) Spearman correlation linking Lefty1 gene expression and ECM deposition by picrosirius red staining. (F) Change in Mecom/Prdm3 mRNA expression after 16 h chloroquine exposure of preadipocytes. Significant difference by t test is indicated as *. (G) Stratification of mice (36 in total) across AT Ucp1 mRNA expression and genotype. (H–I) Significant Spearman’s correlations with ScAT Ucp1 mRNA expression
Atg7 deficiency in progenitors favors subcutaneous fat beige-ing potential
Surprisingly, our gene expression survey in autophagy-inhibited cultured preadipocytes also revealed stimulation of the transcriptional regulator MECOM/PRDM3, a paralog of PRDM16, the master regulator of adipocyte beige-ing (Figure 5F). As MECOM can substitute PRDM16 for AT mitochondrial gene program regulation [25], this suggested a possible link between cell-autonomous downregulation of the ECM gene program by autophagy inhibition and adipocyte beige-ing. Furthermore, the possibility that adipose tissue beige-ing in atg7 KOPdgfra mice might contribute to their obesity-resistant phenotype when fed with HFD led us to investigate adipose tissue browning in our model. ScAT mRNA expression of Ucp1, the canonical beige/brown marker, mostly produced background amplification by RT-PCR, except in some samples which displayed a 10- to 100-fold expression range over the background, hereafter referred to as Ucp1+ (Figure S4A). The gene expression of 2 other beige markers, Tbx1 and Ppargc1a, was also significantly higher in Ucp1+ AT samples (Figure S4B). Among 36 mice, we found that Ucp1+ ScAT expression was more frequent in atg7 KOPdgfra mice than in controls (Figure 5G, P = 0.018, Fisher’s exact test), suggesting that progenitors Atg7 deficiency favors mice AT beige-ing. We did not notice any morphological indication of multilocular adipocytes in ScAT of these mice; however, UCP1 protein content tended to be higher (Figure S4C). Of note, long-term HFD feeding and 22°C room temperature housing are minimally favorable environmental conditions for beige activation. Nevertheless, ScAT Ucp1 mRNA expression negatively correlated with the expression of Col1a1, Col3a1, Col6a1, and Loxl2 (Figure 5H,I), indicating a link between autophagy-dependent ECM regulation and progenitor orientation. Thus, the atg7 KOPdgfra mice model complemented by in vitro studies established novel autophagy-dependent associations governed by progenitor phenotypes, inversely impacting beige conversion and ECM fibrotic remodeling.
Discussion
PDGFRA expression delineates a heterogeneous progenitor population with dual fibro/adipocyte potential, and constitutive PDGFRA activation can switch progenitor cell fate toward fibrogenesis [8]. Here, we provided evidence that autophagy ablation impacts progenitor ECM gene response to an obesogenic diet and demonstrated a cell-autonomous paracrine imbalance in the TGF-BMP pathway.
We based our conclusion on the combination of experiments in a novel mice model with tamoxifen-inducible Atg7 gene targeting of PDGFRA+ cells, and cultured progenitor experiments with pharmacological or siRNA-mediated autophagy inhibition. We are aware of limitations on the mice model, related to the use of Pdgfra promoter, which is not strictly restricted to progenitors, leading to possible nonspecific effects from targeting other cell types throughout the body. However, we observed in the main cell types, no expression of PDGFRA found in AT microenvironments, like macrophages and endothelial cells. Also, by including both males and females, we highlight sex- and depot-specific differences in Pdgfra targeting efficiency among AT progenitors. This observation is currently unexplained but can only minimize whole body phenotypic changes. Finally, due to the use of a tamoxifen-inducible system, we cannot exclude that observed changes are drug-dependent, as tamoxifen is known to affect adipose tissue metabolism [26,27]. Particularly, tamoxifen can accumulate in the adipose tissue, where it can cause adipocyte death and reversible lipoatrophy [28]. Thus, tamoxifen priming could influence subsequent responses to high-fat diet by reducing progenitor survival to autophagy inhibition. However, in our model, we did not find decreased AT Pdgfra mRNA expression, which might be indicative of massive progenitor cell loss in autophagy-deficient mice (data not shown). Despite model-dependent limitations, we believe that autophagy deficiency in progenitors is indeed the driver of AT changes reported here because, in cultured autophagy-inhibited progenitors, we can reproduce these results in vitro.
Our observation for the requirement of autophagy-competent PDGFRA cells for HFD-induced AT fibrogenesis is reminiscent of a previous report in the liver, in which fibrosis was blunted by autophagy inhibition, although through a distinct mechanism [29]. In this liver study, it was found that blockade of stellate cells activation was related to inhibition of lipophagic degradation of preexisting intracellular retinol-esters stores, required for subsequent myofibroblast differentiation. So far, AT PDGFRA progenitors do not contain significant preexisting lipid stores, and we have no evidence that lipophagic degradation would be a prerequisite for inhibition of the ECM cell program. Rather, we demonstrated a cell-autonomous imbalance in the execution of gene program governing production and paracrine responsiveness of TGF-BMP factors, which is likely the cause of the decline of fibrogenic potential in autophagy-deficient progenitors. We point out a complex pathway comprising a large variety of paracrine/autocrine factors that interact with multiple receptor systems, which requires investigation in more detail. Particularly, further studies will be required to elucidate autophagy-related transcriptional regulation of diverse TGF-BMP family members and their functional consequences. Noticeably, a recent study identified age-dependent modulation of dermal adipose progenitors fibrotic response by TGF-BMP factors, linked to progressive loss of their antimicrobial activity with advancing age [30]. Whether such age-dependent changes rely on autophagy modulation in dermal progenitors as described here for subcutaneous fat has not been investigated. Still, the autophagic decline is a well-known feature in aging. Also, related to the TGF-BMP pathway, obesity can promote heart arrhythmias through fibrosis accumulation [31], and the atria of rats fed with an HFD upregulated TGFB, which favors fibrosis [32].
Single-cell analysis tools are now becoming available to decipher cell heterogeneity within the adipose tissue progenitor population. From these experiments, the coexistence of adipogenic progenitors with distinct non-adipogenic, regulatory cell subgroups that can modulate adipose conversion through secreted factors has been identified [33,34]. As PDGFRA expression is a common feature of all progenitors, and autophagy is ubiquitous, our functional targeting approach is unlikely to affect these populations specifically. However, we cannot exclude selective responses of cell subtypes to autophagy inhibition, ultimately affecting the local TGF-BMP landscape. Interestingly, a recently published study identified TGFB1 as a modulator of progenitor sub-populations dynamics [35].
Beyond a primary role of progenitor autophagy status in fibrogenesis, our present data showing anti-adiposity effects of autophagy inhibition bring new insight into the control of beige/white adipogenesis (see [36] for a recent review). The visceral fat phenotype of male atg7 KOPdgfra mice described here, namely the reduced fat-pad weight along with unaffected fat cell size (see Figure 2H), infers hypoplastic fat development. This result is in agreement with studies where autophagy was inhibited in cultured cells, leading to a drastic reduction of fat cell differentiation [18,37]. We designed our study to target adipose progenitors, whereas previous reports on autophagy inhibition have used a Fabp4/aP2 promoter [18,37], which is only active in committed adipocytes. The common adipose tissue brown-like phenotype observed in the two systems indicates that autophagy-dependent regulations likely operate at two distinct steps in the process of beige adipocyte formation (i.e., conversion from existing white fat cells, and de novo differentiation form progenitors). In the Fabp4/aP2 driven models, the emergence of morphologic features of brown-like adipocytes would suggest favored conversion from mature white adipocytes, which is in agreement with the conclusions by [38], that limiting mitophagy, a specific form of autophagy could promote maintenance of differentiated brown-like fat cells over time. In the present Pdgfra-driven model, as far as progenitors are the primary target, we suggest that autophagy can control the differentiation of beige adipocytes from dedicated precursors. Thus, similar to cold exposure, autophagy inhibition could orient progenitors toward preferential beige over white differentiation, even when applied in an obese setting. Whether this results from a shifted fate from white to the beige of a common progenitor in early adipogenesis remains an opened question. However, we cannot completely exclude that modification of the secretory TGF-BMP landscape of autophagy-deficient progenitors could induce local conversion from existing white to mature beige adipocytes. Globally, our study points to an anti-adiposity effect of progenitor autophagy inhibition and suggests that mice can remain lean because white adipogenesis is impaired, and brown-like fat cell formation is promoted.
Another interesting outcome of the present study is to highlight reciprocal links between AT beige-ing and fibrogenesis. Although a progenitor switch between fibrogenic versus adipogenic development was previously documented [9], our data point to autophagy pathways as active modulators in this switch and suggest that reciprocal relationships between the adipogenesis and fibrosis involve the “beige arm” of progenitor commitment. In agreement, a recent study showed that the application of beige-ing stimuli to lean mice fed with a control diet decreased fibrotic phenotype of adipose precursors [39], a feature that declined with advancing age. Our data indicate that progenitor autophagy inhibition similarly favors beige-ing and also minimizes adipose tissue fibrogenic potential, even in mice fed with an obesogenic diet. The TGF pathway is a key factor in fibrogenesis, and some TGF family members modulate the development of beige adipocytes [40,41]. However, it is still unclear how TGF family members/receptor pathways govern this inverse relationship. There is clinical relevance in this question because acting on both AT fibrosis (an ultimate sign of dysfunction linked to insulin resistance) and AT browning (a favorable metabolic phenotype with positive effects on glucose utilization) would be expected to influence metabolic health when combined positively. The favorable phenotype of the atg7 KOPdgfra mouse model with partial obesity resistance to HFD, no signs of liver alteration, preservation of AT beige-ing potential, and reduced fibrogenesis in subcutaneous fat and even in the pericardial region, suggests that autophagy inhibition might provide a basis for anti-fibrotic strategies in obesity.
Materials and methods
Mice breeding
All mice were housed in the animal facility of Pitié-Salpetrière, in conformity with EU regulations, and studied according to a protocol that received ethics approval from the French ministry for research (n° 01746.02). Floxed Atg7 founders were obtained as frozen embryos from Riken, (RBCC 02759 stock) and crossed to obtained Atg7lox/lox on a C57/Bl6J background. Pdgfra-CreErt2 transgenic animals were from Jackson Laboratory USA, Stock n° 018280. After DNA extraction, genotypes at the Atg7 and Cre loci were assessed as described by providers. Atg7lox/lox and Atg7lox/lox-Pdgfra-CreErt2 littermates were studied. All animals were housed in rooms with a 12 h-light cycle, genotyped before weaning, and littermates were matched according to sex and genotypes. At 4–6 weeks old (2–4 weeks post-weaning) all animals received tamoxifen (Sigma-Aldrich, T5648) by 5 daily gavage (25 mg/ml in olive oil, 0.25 mg/g daily dose) and were subsequently fed a high-fat diet (60% cal from fat; Research diets, D12492i) for 10 weeks with free access to water. At the end of HFD-feeding, mice were analyzed for body composition by Nuclear Magnetic Resonance (Brucker Mini-spec plus) and then sacrificed by cervical dislocation between 9:00 and 11:00. Adipose tissues and liver were collected, snapped frozen, or fixed in 4% formaldehyde for later analysis.
Adipose tissue histology
Tissue sections were obtained from paraffin-embedded tissue and immunolabeled [42]. ImageJ software (NIH) served to determine fat cell size by dividing the total area of a given field by the number of adipocytes in the delimited area. At least 4 different random fields were quantified for each sample. Picrosirius red staining (Sigma-Aldrich, 365548) was performed as described previously [5].
Adipose tissue cell separation
Collagenase (1 mg/ml; Sigma, 11088793001) was used to isolate adipose tissue cells as floating adipocytes or stroma-vascular fractions. After centrifugation, stromal cells were sorted by FACS, as described in Marcelin et al. [9]. Purified cell fractions were frozen in RIPA (Sigma, R0278) or RLT buffer (Qiagen, 79216) for western blotting or RNA extraction, respectively.
Epicardial fat studies
Hearts were fixed in 4% paraformaldehyde and processed as described previously [12] to monitor the epicardial layer and fat. In 7 µm sections of mouse atria, an adipose tissue score was calculated based on the number of monolocular adipocytes infiltrating the epicardial layer in the atrial region (Table S1). A fibrosis score was also determined according to the fraction of the epicardial layer with positive Masson’s trichrome staining (Abcam, ab150686) (Table S1). Frozen sections of atria were used for immunolabelling with anti-PDGFRA (Abcam, ab203491) after DAPI (Abnova, U0331) counterstaining. Images were captured with Nikon NIS-elements software plateform and analyzed with ImageJ.
Western blotting
Adipose tissue extracts or isolated cell fractions were processed as described previously [43], with antibodies obtained from Cell Signaling Technology (ATG7, 2631; ACTB, 4970; LC3, 4108), or Novus (GTF2IRD1, NBP1-91973). The linear range of signals was obtained by quantification of fluorescent secondary antibody (Li-cor, 925–32213) with the Odyssey scanner (Li-cor).
RT-qPCR analysis
mRNA was extracted from whole adipose tissue or cell fractions using a RNAeasy kit (Qiagen, 74104). cDNA was reversed transcribed, and real-time qPCR was performed using primer pairs validated for efficient amplification with serial cDNA dilutions. Gene expression was normalized to housekeeping genes (Rna18s or Rplp0 mRNA), and relative values were calculated with the (delta [delta Ct]) method. The expression of genes belonging to the TGF-BMP signaling pathway was assessed by PCR Array (RT2 Profiler, Qiagen) following manufacturer instructions.
Cell culture
Stroma vascular cells were isolated from inguinal subcutaneous adipose tissue of 8–10 weeks old mice and cultured in DMEM high glucose (ThermoFisher Scientific, 13476146) supplemented with antibiotics (ThermoFisher Scientific, 11568876) and 10% fetal calf serum (Biowest, S1800-500) (FCS). After 1–4 passages, cells were plated in 6-well plates until 70% confluence and treated for 16 h in 1% FCS medium containing 25 µM chloroquine (Sigma, C6628) or 100 nM bafilomycin A1 (Sigma, B1793). The effect of lysosomal inhibitors on autophagosome accumulation was assessed by western blot using LC3-II as an autophagosome marker. Transfection with siRNA was performed with lipofectamine RNAiMAX (Invitrogen, 13778075), according to the manufacturer, with a pool of 3 100-nM RNAi complexes from Origene, SR42185 (Gtf2ird1), SR427399 (Atg7), or SR30004 (scrambled controls). After 48 h-72 h, RNA was extracted with RNeasy® Mini Kit (Qiagen, 74104), and protein lysates were prepared in RIPA buffer.
In some experiments, stroma-vascular cell fraction obtained from human lipoaspirates was cultured in standard conditions and used to measure the expression of Mir29a and Mir29b. RNA was extracted using a miRNeasy mini kit (Qiagen, 217004), reversed transcribed with TaqMan™ Small RNA assay using specific primers (Applied Biosystem, RT: 002112 and RT: 000413) and (RT: 001093) for normalization. Quantification was by qPCR with corresponding primers (Applied Biosystem, TM: 002112 and TM: 000413).
Statistical analysis
Statistical significance was determined by a two-tailed unpaired Wilcoxson-Mann-Whitney test on experimental groups comprising 8–12 age and sex-matched littermate mice. p values <0.05 were considered significant.
Supplementary Material
Acknowledgments
We thank Pr Jean Christophe Bichet (Assistance Publique Hôpitaux de Paris, Pitié-Salpêtrière Hospital, Plastic surgery, and Mammary Cancer Department) for providing lipoaspirates for human stromal cell fraction isolation. Timothy Swartz is acknowledged for language editing.
Funding Statement
Funding from the French National Agency of Research (ANR) is acknowledged and includes support from RHU collaborative grant CARMMA [15-RHUS-0003], from the Institute of Cardiometabolism and Nutrition (reference ANR-10-IAHU-05, to AL), ANR-14-CE12-0017-01 LIPOCAMD and ANR CAPTOR (ANR-17-CE14-0009). GM and KC also received funds from AFERO, EFSD-Novo Nordisk, and SFD to support for salaries and consumables.
Disclosure statement
No potential conflict of interest was reported by the authors.
Supplementary material
Supplemental data for this article can be accessed here.
References
- [1].Rodeheffer MS, Birsoy K, Friedman JM.. Identification of white adipocyte progenitor cells in vivo. Cell. 2008;135(2):240–249. [DOI] [PubMed] [Google Scholar]
- [2].Sung HK, Doh K-O, Son J, et al. Adipose vascular endothelial growth factor regulates metabolic homeostasis through angiogenesis. Cell Metab. 2013;17(1):61–72. [DOI] [PubMed] [Google Scholar]
- [3].Weisberg SP, McCann D, Desai M, et al. Obesity is associated with macrophage accumulation in adipose tissue. J Clin Invest. 2003;112(12):1796–1808. [DOI] [PMC free article] [PubMed] [Google Scholar]
- [4].Sun K, Tordjman J, Clément K, et al. Fibrosis and adipose tissue dysfunction. Cell Metab. 2013;18(4):470–477. [DOI] [PMC free article] [PubMed] [Google Scholar]
- [5].Divoux A, Tordjman J, Lacasa D, et al. Fibrosis in human adipose tissue : composition, distribution, and link with lipid metabolism and fat. Diabetes. 2010;59:2817–2825. [DOI] [PMC free article] [PubMed] [Google Scholar]
- [6].Lassen PB, Charlotte F, Liu Y, et al. The fat score, a fibrosis score of adipose tissue: predicting weight-loss outcome after gastric bypass. J Clin Endocrinol Metab. 2017;102(7):2443–2453. [DOI] [PubMed] [Google Scholar]
- [7].Iwayama T, Steele C, Yao L, et al. PDGFRalpha signaling drives adipose tissue fibrosis by targeting progenitor cell plasticity. Genes Dev. 2015;29(11):1106–1119. [DOI] [PMC free article] [PubMed] [Google Scholar]
- [8].Sun C, Berry WL, Olson LE.. PDGFRα controls the balance of stromal and adipogenic cells during adipose tissue organogenesis. Development. 2017;144(1):83–94. [DOI] [PMC free article] [PubMed] [Google Scholar]
- [9].Marcelin G, Ferreira A, Liu Y, et al. A PDGFRα-mediated switch toward CD9highAdipocyte progenitors controls obesity-induced adipose tissue fibrosis. Cell Metab. 2017;25(3):673–685. [DOI] [PubMed] [Google Scholar]
- [10].Lee YH, Petkova AP, Mottillo EP, et al. In vivo identification of bipotential adipocyte progenitors recruited by β3-adrenoceptor activation and high-fat feeding. Cell Metab. 2012;15(4):480–491. [DOI] [PMC free article] [PubMed] [Google Scholar]
- [11].Berry R, Rodeheffer MS. Characterization of the adipocyte cellular lineage in vivo. Nat Cell Biol. 2013;15(3):302–308. [DOI] [PMC free article] [PubMed] [Google Scholar]
- [12].Suffee N, Moore-Morris T, Farahmand P, et al. Atrial natriuretic peptide regulates adipose tissue accumulation in adult atria. Proc Natl Acad Sci USA. 2017;114(5):771–780. [DOI] [PMC free article] [PubMed] [Google Scholar]
- [13].Vila IK, Badin P-M, Marques M-A, et al. Immune cell toll-like receptor 4 mediates the development of obesity- and endotoxemia-associated adipose tissue fibrosis. Cell Rep. 2014;7(4):1116–1129. [DOI] [PubMed] [Google Scholar]
- [14].Madsen DH, Leonard D, Masedunskas A, et al. M2-like macrophages are responsible for collagen degradation through a mannose receptor-mediated pathway. J Cell Biol. 2013;202(6):951–966. [DOI] [PMC free article] [PubMed] [Google Scholar]
- [15].Plikus MV, Guerrero-Juarez CF, Ito M, et al. Regeneration of fat cells from myofibroblasts during wound healing. Science (80-.). 2017;355(6326):748–752. [DOI] [PMC free article] [PubMed] [Google Scholar]
- [16].Novikoff AB, Novikoff PM, Rosen OM, et al. Organelle relationships in cultured 3T3-L1 preadipocytes. J Cell Biol. 1980;87(1):180–196. [DOI] [PMC free article] [PubMed] [Google Scholar]
- [17].Pampliega O, Orhon I, Patel B, et al. Functional interaction between autophagy and ciliogenesis. Nature. 2013;502(7470):194–200. [DOI] [PMC free article] [PubMed] [Google Scholar]
- [18].Singh R, Xiang Y, Wang Y, et al. Autophagy regulates adipose mass and differentiation in mice. J Clin Invest. 2009;119(11):3329–3339. [DOI] [PMC free article] [PubMed] [Google Scholar]
- [19].Church CD, Berry R, Church CD, et al. Characterization of Cre recombinase models for the study of adipose tissue. Adipocyte. 2014;3(3):206–211. [DOI] [PMC free article] [PubMed] [Google Scholar]
- [20].Singh R, Kaushik S, Wang Y, et al. Autophagy regulates lipid metabolism. Nature. 2009;458(7242):1131–1135. [DOI] [PMC free article] [PubMed] [Google Scholar]
- [21].Coupé B, Ishii Y, Dietrich MO, et al. Loss of autophagy in pro-opiomelanocortin neurons perturbs axon growth and causes metabolic dysregulation. Cell Metabolism. 2012;15(2):247–255. [DOI] [PMC free article] [PubMed] [Google Scholar]
- [22].Kim KH, Jeong YT, Oh H, et al. Autophagy deficiency leads to protection from obesity and insulin resistance by inducing Fgf21 as a mitokine. Nat Med. 2013;19(1):83–92. [DOI] [PubMed] [Google Scholar]
- [23].Hasegawa Y, Ikeda K, Chen Y, et al. Repression of adipose tissue fibrosis through a PRDM16-GTF2IRD1 complex improves systemic glucose homeostasis. Cell Metab. 2018;27(1):180–194.e6. [DOI] [PMC free article] [PubMed] [Google Scholar]
- [24].Wang B, Komers R, Carew R, et al. Suppression of microRNA-29 expression by TGF- 1 promotes collagen expression and renal fibrosis. J Am Soc Nephrol. 2012;23(2):252–265. [DOI] [PMC free article] [PubMed] [Google Scholar]
- [25].Harms MJ, Ishibashi J, Wang W, et al. Prdm16 is required for the maintenance of brown adipocyte identity and function in adult mice. Cell Metab. 2014;19(4):593–604. [DOI] [PMC free article] [PubMed] [Google Scholar]
- [26].Liu L, Zou P, Zheng L, et al. Tamoxifen reduces fat mass by boosting reactive oxygen species. Cell Death Dis. 2015;6(1):e1586–8. [DOI] [PMC free article] [PubMed] [Google Scholar]
- [27].de Avila JM, Du M, Wang B, et al. Even a low dose of tamoxifen profoundly induces adipose tissue browning in female mice. Int J Obes. 2019;44(1):226–234. [DOI] [PMC free article] [PubMed] [Google Scholar]
- [28].Ye R, Wang QA, Tao C, et al. Impact of tamoxifen on adipocyte lineage tracing: inducer of adipogenesis and prolonged nuclear translocation of Cre recombinase. Mol Metab. 2015;4(11):771–778. [DOI] [PMC free article] [PubMed] [Google Scholar]
- [29].Hernández–Gea V, Ghiassi–Nejad Z, Rozenfeld R, et al. Autophagy releases lipid that promotes fibrogenesis by activated hepatic stellate cells in mice and in human tissues. Gastroenterology. 2012;142(4):938–946. [DOI] [PMC free article] [PubMed] [Google Scholar]
- [30].Zhang L, Chen SX, Guerrero-Juarez CF, Li F, Tong Y, Liang Y, Liggins M,Chen X, Chen H, Li M, et al. Age-related loss of innate immune antimicrobial function of dermal fat is mediated by transforming growth factor beta. Immunity. 2019;50(1):121–136. [DOI] [PMC free article] [PubMed] [Google Scholar]
- [31].Pabon MA, Manocha K, Cheung JW, et al. Linking arrhythmias and adipocytes : insights, mechanisms, and future directions. Front Physiol. 2018;9:1752. [DOI] [PMC free article] [PubMed] [Google Scholar]
- [32].Meng T, Cheng G, Wei Y, et al. Exposure to a chronic high-fat diet promotes atrial structure and gap junction remodeling in rats. Int J Mol Med. 2017;40:217–225. [DOI] [PubMed] [Google Scholar]
- [33].Schwalie PC, Dong H, Zachara M, et al. A stromal cell population that inhibit adipogenesis in mammalian fat depots. Nature. 2018;559(7712):103–108. [DOI] [PubMed] [Google Scholar]
- [34].Hepler C, Vishvanath L, Gupta RK. Sorting out adipocyte precursors and their role in physiology and disease. Genes Dev. 2017;31(2):127–140. [DOI] [PMC free article] [PubMed] [Google Scholar]
- [35].Merrick D, Sakers A, Irgebay Z, et al. Identification of a mesenchymal progenitor cell hierarchy in adipose tissue. Science (80-.). 2019;364(6438):eaav2501. [DOI] [PMC free article] [PubMed] [Google Scholar]
- [36].Shao M, Wang QA, Song A, et al. Cellular origins of beige fat cells revisited. Diabetes. 2019;68(10):1874–1885. [DOI] [PMC free article] [PubMed] [Google Scholar]
- [37].Baerga R, Zhang Y, Chen PH, et al. Targeted deletion of autophagy-related 5 (atg5) impairs adipogenesis in a cellular model and in mice. Autophagy. 2009;5(8):1118–1130. [DOI] [PMC free article] [PubMed] [Google Scholar]
- [38].Altshuler-Keylin S, Shinoda K, Hasegawa Y, et al. Beige adipocyte maintenance is regulated by autophagy-induced mitochondrial clearance. Cell Metab. 2016;24(3):402–419. [DOI] [PMC free article] [PubMed] [Google Scholar]
- [39].Wang W, Ishibashi J, Trefely S, et al. A PRDM16-driven metabolic signal from adipocytes regulates precursor cell fate. Cell Metab. 2019;30(1):174–189.e5. [DOI] [PMC free article] [PubMed] [Google Scholar]
- [40].Wankhade UD, Lee J-H, Dagur PK, et al. TGF-β receptor 1 regulates progenitors that promote browning of white fat. Mol Metab. 2018;16:160–171. [DOI] [PMC free article] [PubMed] [Google Scholar]
- [41].Craft CS, Pietka TA, Schappe T, et al. The extracellular matrix protein MAGP1 supports thermogenesis and protects against obesity and diabetes through regulation of TGF-β. Diabetes. 2014;63(6):1920–1932. [DOI] [PMC free article] [PubMed] [Google Scholar]
- [42].Briand N, Lay SL, Sessa WC, et al. Distinct roles of endothelial and adipocyte caveolin-1 in macrophage infiltration and adipose tissue metabolic activity. Diabetes. 2011;60(2):448–453. [DOI] [PMC free article] [PubMed] [Google Scholar]
- [43].Soussi H, Reggio S, Alili R, et al. DAPK2 downregulation associates with attenuated adipocyte autophagic clearance in human obesity. Diabetes. 2015;64(10):3462–3463. [DOI] [PubMed] [Google Scholar]
Associated Data
This section collects any data citations, data availability statements, or supplementary materials included in this article.