Abstract
The histone demethylase KDM1A specifically demethylates lysine residues and its deregulation has been implicated in the initiation and progression of various cancers. However, KDM1A’s molecular role and its pathological consequences, and prognostic significance in oral cancer remain less understood. In the present study, we sought to investigate the expression of KDM1A and its downstream role in oral cancer pathogenesis. By comparing mRNA expression profiles, we identified an elevated KDM1A expression in oral tumors when compared to normal oral tissues. In silico pathway prediction identified the association between KDM1A and E2F1 signaling in oral cancer. Pathway scanning, functional annotation analysis and In vitro assays showed the KDM1A’s involvement in oral cancer cell proliferation and the cell cycle. Moreover, real time PCR and luciferase assays confirmed KDM1A’s role in regulation of E2F1 signaling activity in oral cancer. Elevated KDM1A expression is associated with poor clinical outcome in oral cancer. Our data indicate that deregulated KDM1A expression is positively associated with proliferative phenotype of oral cancer and confers poor clinical outcome. These cumulative data suggest that KDM1A might be a potential diagnostic and therapeutic target for oral cancer.
Keywords: Oral cancer, Histone demethylase, KDM1A, E2F1 signaling, Cell proliferation
Introduction
Oral cancer is the sixth most common cancer in developing countries with an annual incidence of over 300,000 cases [1].It ranks in the top three of all cancers in India with occurrence of approximately 70,000 new cases annually [2,3]. Most of the patients with oral cancers are diagnosed at late stages with a five year survival rate of around 50% [4]. Early detection of oral cancer can improve the survival rate and provides better therapeutic options [5,6]. However, the diagnosis of oral cancer in early stage is still challenging, due to the low sensitivity and specificity of currently available biomarkers and diagnostic techniques [7,8]. Therefore, it is of great importance for us to identify the biomarkers and investigate its molecular role in initiation and progression of oral cancer.
Deregulation of the genetic and epigenetic machinery contributes to the progression of several cancers, including oral cancer [9]. Unlike genetic mutations, epigenetic changes, including DNA methylation and histone modifications, are dynamic and reversible [10,11]. Dynamic modifications of histones control the gene expression without affecting the DNA and have a crucial role in the development and progression of various cancers [12,13]. Histone lysine methylation has recently emerged as a key determinant of transcriptional activation and repression [14–16]. Histone demethylases are group of proteins that are able to reverse the methyl modifications on histones [17,18]. Lysine specific demethylases (KDMs) are a class of enzymes, which specifically demethylates lysine residues [19,20]. The first reported demethylase is lysine-specific demethylase 1 (KDM1A/LSD1). KDM1A specifically demethylates histone H3 lysine 4 (H3K4) and histone H3 lysine 9 (H3K9) and functions as a transcriptional co-repressor or coactivator [21–23]. In addition to its direct activity on chromatin structure, KDM1A also regulates various gene expression patterns through demethylation of non-histone targets and exhibits context specific transcriptional functions in cancer [22]. Deregulation of KDM1A is a critical regulator in diverse cancer development including breast, bladder and prostate cancers [23–25]. Overexpression of KDM1A favors cell proliferation in medulloblastoma, colorectal, tongue cancer [26–28] and predicts poor prognosis in breast cancer, tongue cancer and esophageal cancer [24,26]. However, in oral cancer KDM1A expression pattern and its role in oral cancer progression is less understood. Therefore, it needs an extensive exploration for better diagnostic and therapeutic options.
In this study, we sought to investigate the expression pattern and functional role of KDM1A in oral cancer. Here, we identify the KDM1A overexpression in oral tumors. Overexpression of KDM1A modifies E2F1 signaling activity and thereby initiates increased cell proliferation in oral cancer cells. Furthermore, our result reveals KDM1A overexpression confers poor clinical outcome in oral cancer. Taken together, we describe a novel mechanism associating the proliferative phenotype of oral cancer cells and identify KDM1A as a promising diagnostic and therapeutic target for oral cancer.
Materials and methods
Microarray data analysis
Gene expression profiles utilized in the study were collected from Gene Expression Omnibus (GEO) [29,30] (Table S1). The gene expression profiles analyzed in the study were normalized and log2 transformed. Microarray platform specific probes were mapped to gene symbols with appropriate annotation files. The expression values of genes with more than one probe were averaged using dChip software and considered for the analysis. KDM1A gene expression values were extracted from normalized and log2 transformed oral tumor profiles. The significant difference in gene expression between normal and oral tumor was calculated using Student’s t-test (two tailed). P-value less than 0.05 was considered as significant. GraphPad Prism and R-Bioconductor tool were used to generate the box plots.
In silico pathway activation prediction
Gene signatures are a representative of specific signaling pathways or phenotypes used for in silico pathway activation prediction (iPAP) based analysis, which are extracted from molecular signature database (MSigDB) [31]. The gene expression profiles used for the gene set activation prediction were Z-normalized as mentioned earlier (Script file S1) [32]. The expression values of the individual gene sets were then additively combined to get an “activation score”. Detailed descriptions about the gene sets or signatures utilized in the study are provided in the supplementary data (Table S3). An activation or deactivation level of individual signaling pathways was calculated using iPAP analysis. KDM1A expression with signaling pathways correlation and significance was calculated using R-Bioconductor. Supervised clustering was done by dChip and the variable graph was plotted using MedCalc 12.7.0.0 statistical platform.
Co-expressed genes, gene ontology, transcription factor enrichment and connectivity map analysis
Pearson correlation method was used to identify the genes that are correlated with KDM1A in oral cancer. Genes are considered as co-expressed when its correlation value is more than 0.5. Transcription factor (TF) enrichment analysis of KDM1A co-expressed genes was done using DIRE transcription factor enrichment tool [33]. Promoter regions (1 kb upstream from transcription start site) were selected for TF enrichment analysis of KDM1A co-expressed genes. Gene ontology analysis of KDM1A co-expressed genes was done using Topp cluster tool [34]. Highly enriched clusters were extracted and network was constructed using cytoscape. KDM1A co-expressed and negatively expressed genes were taken as up and down tags for c-map analysis [35]. Pearson correlation method was used to identify positively and negatively correlated genes of KDM1A. Positively correlated genes were used as up tags and negatively correlated genes were used as down tags for c-map analysis.
Cell line culture
The human oral cancer cell lines PE/CA-PJ41, BICR10, H157, and H413 were obtained from American type culture collection (ATCC). All cell lines were cultured in ATCC recommended appropriate growth medium supplemented with 10% Fetal bovine serum (FBS), 100 units/mL penicillin, 100 units/mL streptomycin, and 2 mmol/L L-glutamine under standard cell culture conditions.
RNA isolation, cDNA synthesis and RT-PCR
Total RNA was extracted from cultured cells using RNeasy plus kit (Qiagen) and quantified using Nanodrop. 1 μg of total RNA was reverse transcribed by iScript cDNA synthesis kit (Bio Rad) as per the manufacturer’s instructions. SYBR green (Roche) based real-time PCR was performed using gene specific primers.
Gene silencing experiments
PJ41 and H413 cells (106) were seeded in six well culture plates. After 24 hrs, KDM1A shRNA and non-targeting control shRNA (2 μg/well) were transfected with Escort IV reagent (Sigma) as per the manufacturer’s instructions. After 24 hrs of transfection, cells were selected in 1 μg/mL puromycin for 60 hrs. RNA isolation, cDNA synthesis, and RT-PCR were performed to confirm the shRNA mediated silencing.
Cell Proliferation assays
PJ41 and H413 cells (104) were seeded in 96 well culture plates. After 24 hrs, KDM1A shRNA and non-targeting control shRNA were transfected with Escort IV reagent (Sigma) as per the manufacturer’s instructions. After the transfection, cells were cultured for 24 hrs, 36 hrs, 48 hrs, 60 hrs, and 72 hrs (in triplicate for each condition). Cell growth was determined by measuring the conversion of MTT tetrazolium salt (Sigma) to MTT formazan. In brief, MTT stock solution was added to each dish and incubated for three hours. Numbers of viable cells were measured by a spectrophotometer at an optical density of 600 nm.
Cell cycle analysis by flow-cytometry
For cell cycle analysis, PJ41 and H413 cell lines were transfected with non-targeting control shRNA and KDM1A shRNA separately using Escort IV reagent (Sigma). After 60 hrs cells were pelleted down and washed with 1XPBS twice. The cells were stained with Propidium Iodide (PI, BD Biosciences) in the presence of RNase and incubated in the dark for 30 minutes. The samples were diluted with 1X PBS and flow-cytometry was performed on BD FACSAria III. FlowJo software was used for data analysis.
Colony forming assay
PJ41 and H413 cells (106) were seeded in six well culture plates. After 24 hrs, KDM1A shRNA and non-targeting control shRNA (2 μg/well) were transfected with Escort IV reagent (Sigma) as per the manufacturer’s instructions. After 24 hrs of transfection, cells were trypsinized and 1 × 10⁴ cells were seeded in new six well plates. After 24 hrs of seeding, cells were selected in 1 μg/mL puromycin for seven days. At the time of staining cells were fixed using methanol and acetic acid (3:1 ratio) for five minutes. After fixation, cells were washed twice with 1x PBS. Washed cells were stained with 0.05% crystal violet stain. Photoshop software was used to quantify the pixels of the stained cells.
Luciferase reporter assay
KDM1A shRNA and control shRNA transfected PJ41 and H413 were seeded in 24-well cell culture dish (5 × 10⁴ cells/well). 24 hrs later, cells were transfected with E2F signaling luciferase (firefly) plasmid and with internal control reporter plasmid in a ratio of 20:1. After 48 hrs of reporter plasmid transfection, cells were lysed by passive lysis buffer. Luciferase activity was measured using dual glow luciferase reagent (Promega). Normalization of luciferase assay was performed by dividing the firefly reporter value by Renilla reporter values.
Survival analysis
Overall survival information of the oral cancer patients (Table S8) were considered for predicting the association between gene expression and patient survival. Using the calculated Cox coeffifcient values, patients were classified into low and high-risk groups [36]. Cox regression coffifficient value for each gene and its relation to clinical outcome was calculated. The survival curve was plotted with R-Bioconductor.
Results
KDM gene expression in oral cancer
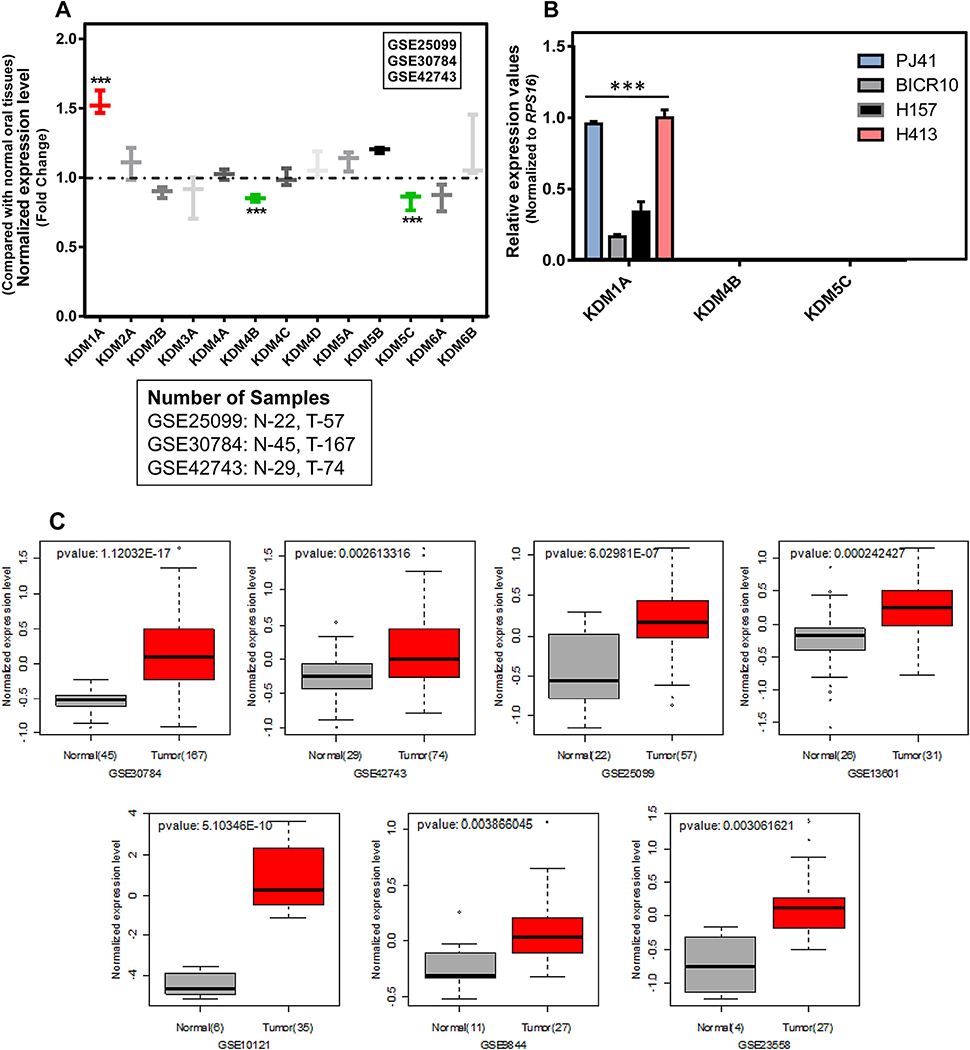
The expression pattern of all KDM genes was investigated in three independent oral tumor mRNA expression profiles. Among the KDMs, only KDM1A, KDM4B and KDM5C showed significance differences in the expression between normal and oral tumor tissues. Analysis of publicly available microarray data revealed a highly significant upregulation of KDM1A mRNA in oral tumors compared to normal oral tissues. KDM4B and KDM5C showed decreased expression in oral tumors compared to normal oral tissues with significant fold change (Fig. 1A; Table S2). In order to confirm the differential expression pattern of KDM1A, KDM4B, and KDM5C in oral cancer, RT-PCR was performed in the oral cancer cell lines PJ41, BICR10, H157, and H413. Results confirmed the elevated expression of KDM1A and decreased expression of KDM4B and KDM5C in all four oral cancer cell lines (Fig. 1B). To further extend the study, the KDM1A expression was analyzed in seven independent cohorts of oral tumor profiles containing 143 normal and 418 tumor samples. Results confirmed the elevated expression of KDM1A with significant fold change in all seven oral tumor profiles (Fig. 1C).
Fig. 1.
(A) KDM/JMJD gene expression pattern in normal and oral tumor tissue gene expression profiles. Graph shows that KDM1A expression is elevated in oral tumors compared to normal oral tissues in three independent cohorts of gene expression profiles. In contrast, under expression of KDM4B and KDM5C genes was observed in the same gene expression profiles. (B) KDM1A, KDM4B and KDM5C expression pattern in a panel of oral cancer cell lines. RT-PCR results show that only KDM1A expression was detected in oral cancer cell lines compared to KDM4B and KDM5C genes. (C) Expression pattern of KDM1A gene in independent cohorts of oral tumor gene expression profiles. Box plot shows the elevated KDM1A expression in oral tumors compared to normal oral tissues.
KDM1A association with E2F signaling
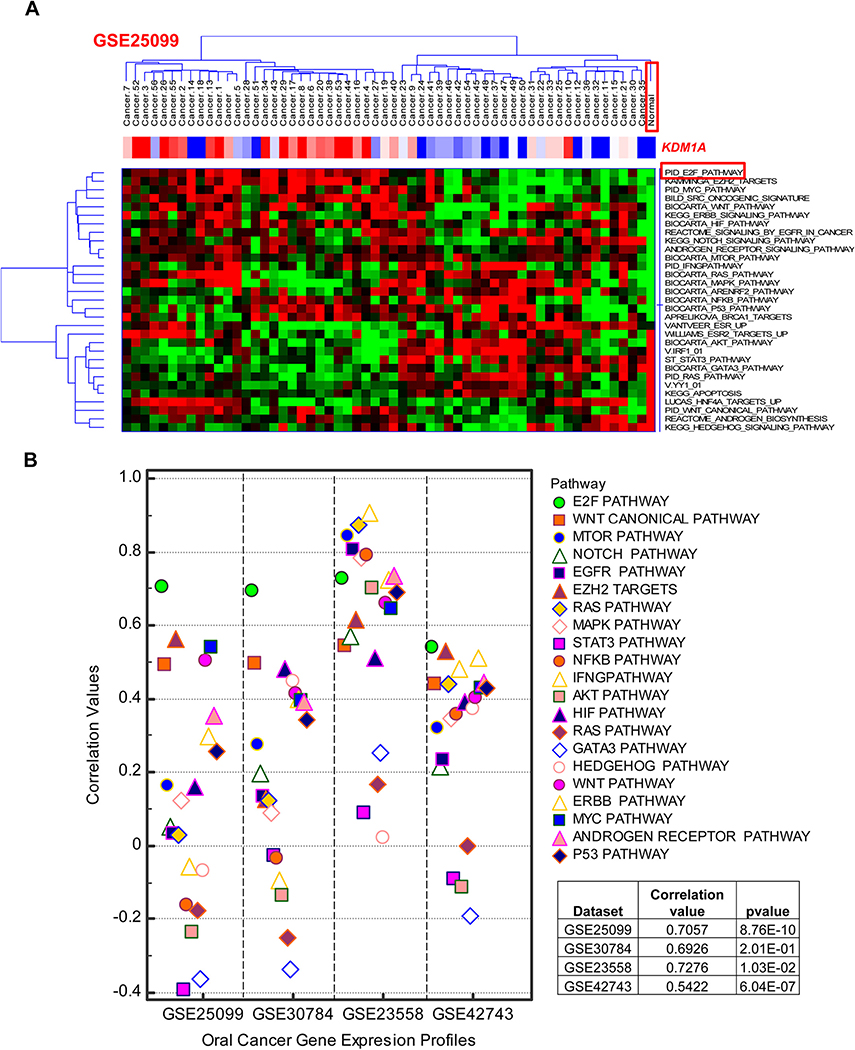
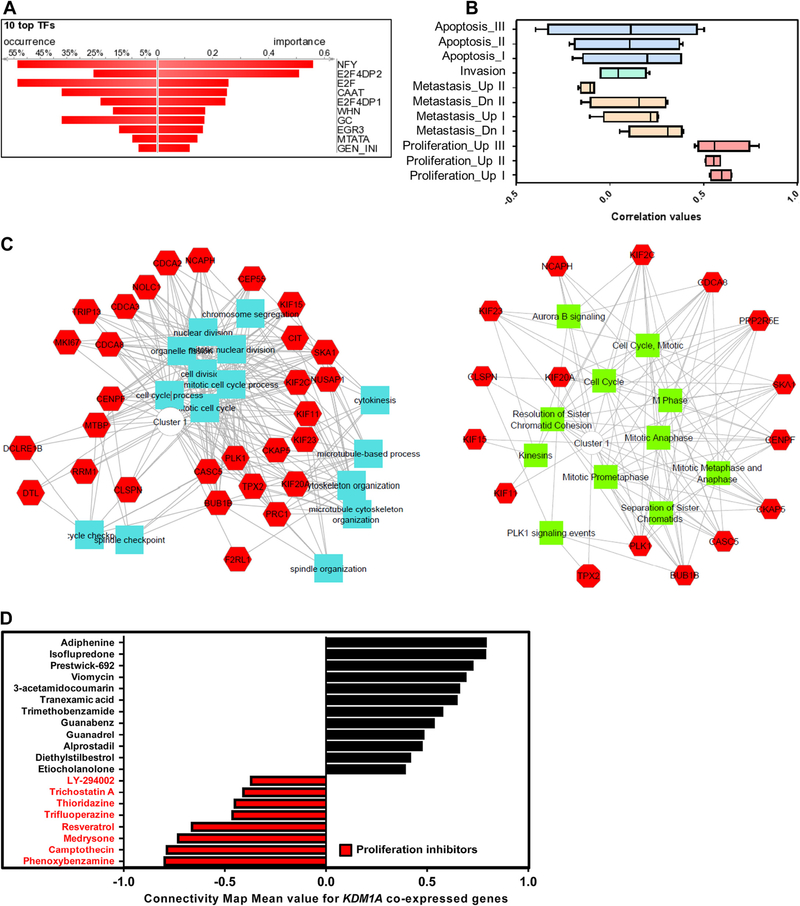
In order to identify the signaling events associated with KDM1A, gene signature based iPAP was employed in the mRNA expression profiles of four oral cancer cohorts comprised of 325 oral tumor samples. 32 oncogenic signatures/gene-sets representing various pathways and molecular cellular processes were collected from MsigDB and used for this analysis. Four oral tumor profiles, GSE30784, GSE42743, GSE25099, and GSE23588, were analyzed to score the activation of pathway signatures using a gene-set based iPAP approach. Hierarchical clustering was performed for signature based activation scores and correlated with KDM1A expression (Fig. 2A; Fig. S1). Correlation values were calculated individually for KDM1A with all 32 signatures (Table S4). Signature based iPAP method identified the significant positive association between KDM1A gene expression and E2F signaling in all four oral tumor cohorts (Fig. 2B). To further support this notion, we performed transcription factor enrichment analysis for KDM1A co-expressed genes (Table S6). Results showed the high enrichment of E2F specific transcription factor-binding site in gene promoters (Fig. 3A; Table S7). Cumulative results of pathway scanning analysis and TF enrichment analysis revealed that KDM1A is highly correlated with E2F signaling in oral tumor profiles.
Fig. 2.
(A) Association between signaling event levels and KDM1A gene expression in oral tumor gene expression profiles. Supervised clustering of in silico pathway activation prediction scores shows strong association between KDM1A gene expression and E2F signaling pathway (Red: Over expression or Activation; Green/Blue: Under expression or Deactivation). (B) Association between signaling event levels and KDM1A gene expression in oral tumor gene expression profiles. Scatter plot of in silico pathway activation prediction scores shows high correlation between KDM1A gene expression and E2F signaling pathway across four independent cohorts of oral tumor gene expression profiles.
Fig. 3.
(A) Transcription factor binding site enrichment on KDM1A co-expressed gene promoter. Graph shows that high enrichment of E2F binding site in KDM1A co-expressed gene promoter, which is indicative of possible activation of those genes by E2F signaling. (B) Association between KDM1A expression and proliferation. Box plot of iPAP predicted scores shows that KDM1A is highly correlated with oral cancer proliferation. (C) Gene Ontology analysis of KDM1A co-expressed genes. GO network shows that KDM1A co-expressed genes are enriched with cell cycle related biological processes. (D) Connectivity map analysis of KDM1A co-expressed genes. Red color highlighted drugs are proliferation inhibitors which show action against the KDM1A co-expressed genes. Graph reveals the involvement of KDM1A and its co-expressed neighbor genes in cancer cell proliferation.
KDM1A association with oral cancer phenotypes
In order to identify the association between KDM1A and tumorigenic characteristics like oral cancer cell proliferation, metastasis and invasion, we performed gene-set/signature based iPAP analysis in four oral cancer mRNA expression profiles comprised of 325 oral tumor samples. For each phenotype, multiple signatures were taken for analysis (Proliferation – three signatures, Metastasis – four signatures, and Invasion – one signature). Results revealed that there is a strong positive correlation between KDM1A expression and proliferative cancer phenotype. Metastasis and invasion phenotypes did not show any significant association. iPAP analysis revealed the KDM1A’s association with cell proliferation (Fig. 3B; Table S5). To further support KDM1A’s association with proliferation, we identified 49 KDM1A co-expressed genes in oral cancer gene expression profiles using the Pearson correlation co-efficient method. Gene ontology analysis of KDM1A co-expressed genes showed that there is an active participation of these genes in cell proliferation associated events (Fig. 3C). To extend the association, connectivity map analysis was done to KDM1A positively and negatively correlated genes in oral cancer. Connectivity map data revealed that KDM1A co-expressed genes are highly sensitive to proliferation inhibitors or compounds (Fig. 3D). Cumulative results revealed the correlation of KDM1A expression with oral cancer cell proliferation.
KDM1A promotes cell proliferation via modulating E2F signaling
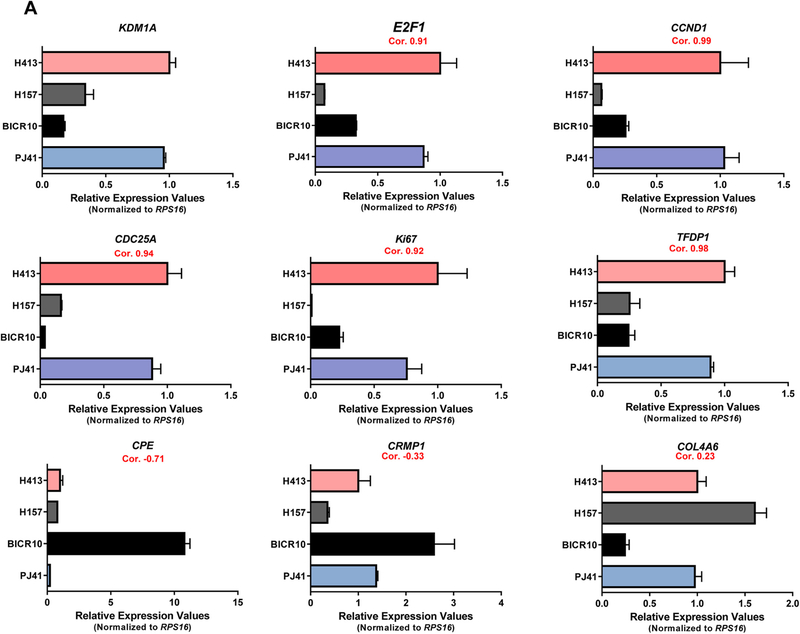
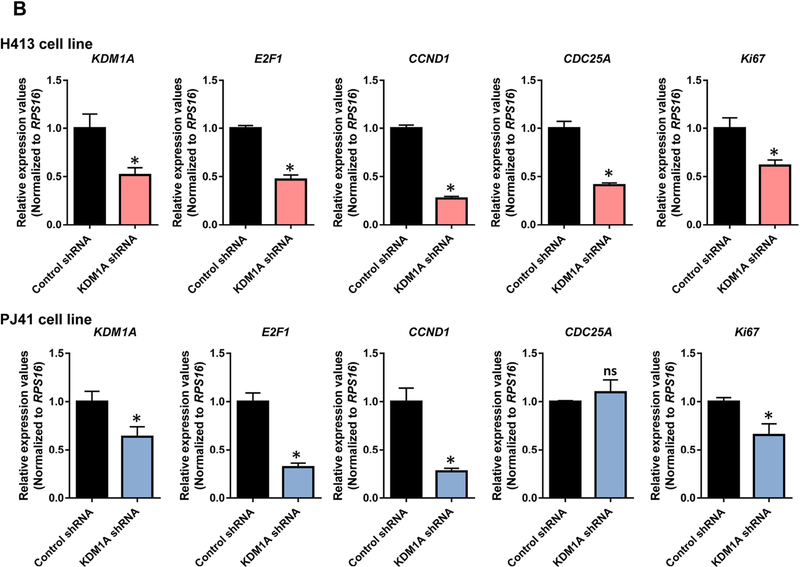
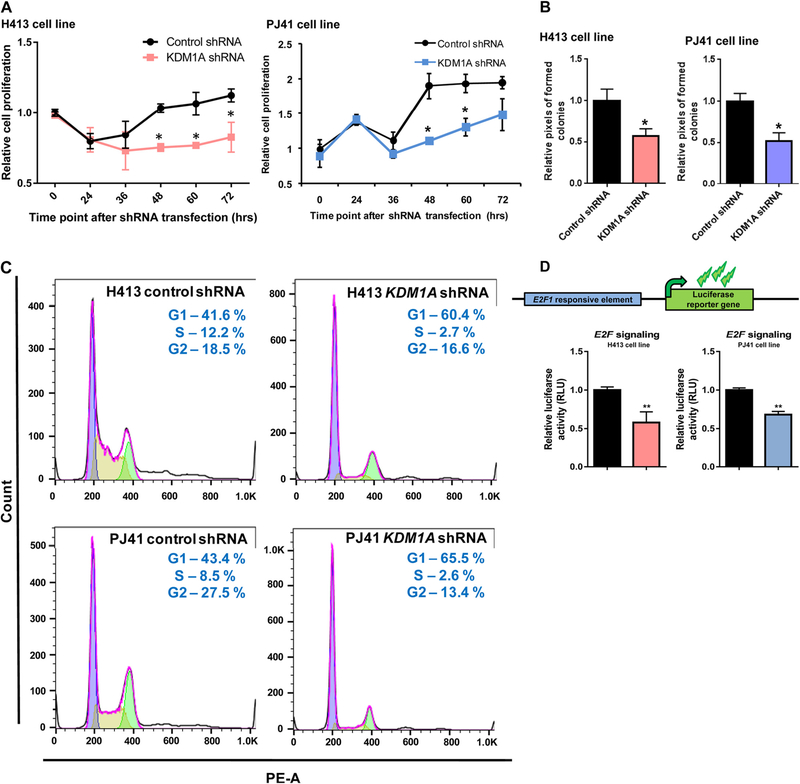
We next examined whether KDM1A expression has a notable impact on oral cancer cell proliferation, we have selected the proliferation specific marker genes of E2F1, CDC25A, CCND1, TFDP1, and Ki67 for our analysis. RT-PCR was done for KDM1A and these proliferation specific marker genes in PJ41, BICR10, H157, and H413 oral cancer cell lines. Elevated KDM1A expression was observed in PJ41 and H413 cell lines compared to BICR10 and H157 cell lines. As expected, proliferation marker genes also showed elevated expression in PJ41 and H413 cell lines in comparison to BICR10 and H157 cell lines. High correlation values were observed between the expression of KDM1A and the proliferation specific marker genes. We have also done RT-PCR for metastatic specific genes CRMP1, CPE, and one random gene, COL4A6. We did not observe any significant correlation with KDM1A gene expression in oral cancer cell lines (Fig. 4A). To further support these data, we have done KDM1A silencing using shRNA in PJ41 and H413 cell lines that shows high KDM1A expression. Expression of E2F1 and other proliferation marker genes showed decreased expression upon knockdown of KDM1A in oral cancer cell lines. Significant fold differences of these genes were observed between control and KDM1A knockdown PJ41 and H413 cell lines (Fig. 4B). To assess the role of KDM1A in oral cancer cell proliferation, KDM1A expression levels were manipulated in PJ41 and H413 cell lines using shRNA and performed the cell proliferation assay (MTT assay). MTT assay results showed that silencing the expression of KDM1A inhibited the proliferation of PJ41 and H413 cells (Fig. 5A). Colony forming assay upon KDM1A silencing in PJ41 and H413 cells showed the decreased number of colonies in KDM1A knockdown cells compared to control cells. Relative number of colonies revealed the role of KDM1A in oral cancer cell proliferation (Fig. 5B; Fig. S2). Cell cycle analysis was done upon silencing of KDM1A using FACS. FACS analysis showed G1 arrest of KDM1A knockdown cells compared to control cells. Results revealed that expression of KDM1A promotes G1 to S phase transition in oral cancer cell lines (Fig. 5C). We have also performed the E2F1 luciferase assays to show KDM1A’s role on modulating E2F1 signaling activity. Upon silencing of KDM1A in PJ41 and H413 cells, E2F1 reporter plasmid was transfected. Dual luciferase assay revealed the decreased E2F1 signaling activity upon KDM1A knockdown in oral cancer cell lines (Fig. 5D). Cumulative data suggest that KDM1A promotes proliferation of oral cancer cells via modulating E2F1 signaling activity.
Fig. 4.
(A) Correlation among KDM1A gene expression and E2F/proliferation specific genes in oral cancer cell lines. Graph shows the elevated KDM1A expression in H413 and PJ41 compared to BICR10 and H157 oral cancer cell lines. In concordance with KDM1A gene E2F/proliferation specific genes also show elevated expression in H413 and PJ41 compared to BICR10 and H157 cell lines. (B) Effect of KDM1A silencing on E2F/proliferation specific genes. Graph shows the correlated expression of KDM1A and E2F/proliferation specific genes upon silencing of KDM1A using shRNA in H413 and PJ41 cell lines which shows that KDM1A is an upstream regulator of E2F signaling in oral cancer.
Fig. 5.
(A) Oral cancer cell lines PJ41 and H413 proliferation upon KDM1A silencing. Graph shows the decreased cell proliferation upon silencing of KDM1A gene using shRNA against KDM1A compared to control shRNA transfected cell lines. (B) Colony forming assays upon silencing of KDM1A show decreased colony number compared to control cells. (C) Cell cycle analysis of oral cancer cell lines H413 and PJ41 upon KDM1A silencing. Cell cycle stage specific graph shows the G1 arrest of oral cancer cell lines H413 and PJ41 that are transfected with KDM1A shRNA. Control shRNA transfected cells show the G1 to S phase transition of cells in cell cycle. (D) KDM1A knock down using shRNA shows decreased E2F luciferase reporter activity in PJ41 and H413 oral cancer cell lines.
KDM1A confers poor clinical outcome in oral cancer
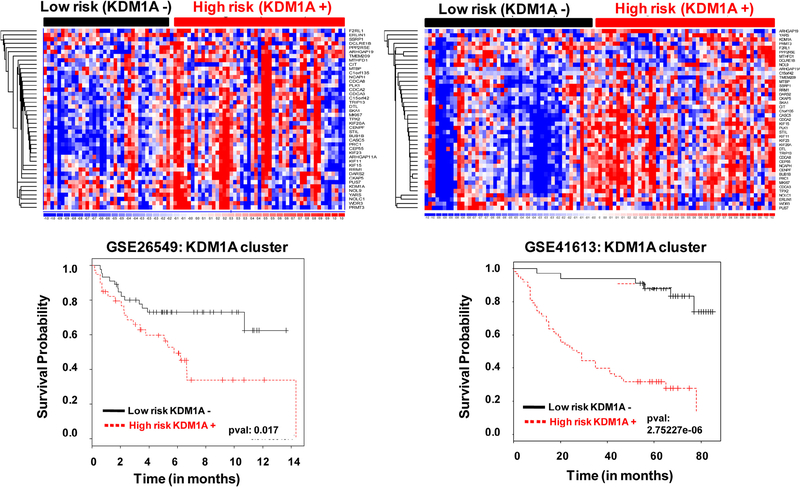
Survival analysis of KDM1A and its co-expressed genes showed its prognostic value in patients with oral cancer. The outcome of high risk and low risk groups of oral cancer patients was predicted by KDM1A and its co-expressed gene expression. High risk denotes poor clinical outcome and low risk denotes good clinical outcome. Analysis showed that high KDM1A and its co-expressed gene expression falls under high-risk category in oral cancer (Fig. 6). Overall data show that high KDM1A expression is associated with poor clinical outcome in oral cancer.
Fig. 6.
Cox regression coefficient based survival analysis of KDM1A co-expressed genes in oral tumor patients. High risk represents an elevated KDM1A co-expressed gene expression while low risk represents decreased KDM1A co-expressed expression in oral tumor. Elevated expression of KDM1A was associated with poor clinical outcome in oral tumors (Red: Over expression; Blue: Under expression).
Discussion
Deregulated epigenetic events contribute to various cancer progressions and it is considered as one of the key hallmarks of human cancer [18,37,38]. It is well known that epigenetic modifications involved in cancer progression are potentially reversible, thus providing the opportunity to find novel therapies that can relieve transcriptional repression of key genes and improve outcomes [39–41]. Lysine specific methylation of histone and other regulatory proteins also play a major role in the progression of various cancers [42–44]. Lysine specific methylation of key target proteins in cancer can be altered by lysine specific demethylases. The first identified lysine specific demethylase is KDM1A, which is known to demethylate mono, dimethylated lysine residues [21,22] and its expression is associated with the development of various cancers [24,25]. Based on the previous identifications from the literature, here we identified the expression pattern, molecular and prognostic roles of KDM1A in oral cancer. We identified the elevated expression of KDM1A in oral cancers that promote cell proliferation via modulating E2F1 signaling activity and confer poor clinical outcome.
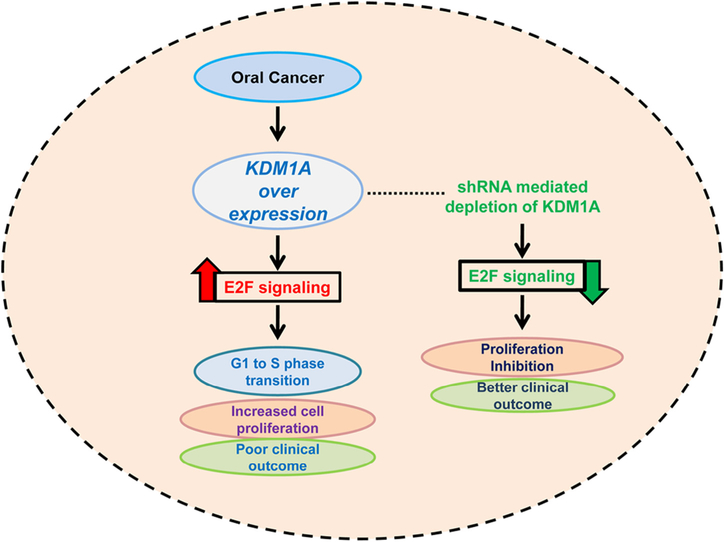
Increasing evidence in the past several years has revealed that deregulated expression of KDM1A has oncogenic properties in different cancers [23–25]. In this study, we identified the elevated expression of KDM1A in oral cancer compared to normal oral tissues in seven independent oral tumor expression profiles. Overexpression of KDM1A confirms its oncogenic role in oral cancers. However, we did not observe the elevated expression of other KDM genes in oral tumor profiles. Previous studies revealed the association between elevated KDM1A expression and clinical and pathological characters in various cancers [28,45]. However, in our study we did not find any significant relationship between KDM1A expression and oral cancer stages. Recent findings have revealed the role of KDM1A in cancer cell proliferation in diverse cancer types. In neural stem cells, KDM1A promotes cell proliferation by modulating the gene activity of TLX, a proliferation specific regulator [46]. In tongue and non-small cell lung cancer, elevated KDM1A expression was associated with proliferation of cancer cells [26,28]. However, the molecular mechanism behind cell proliferation in both tongue and non-small cell lung cancer is uncovered. In the present study, we have identified the elevated KDM1A’s association with oral cancer cell proliferation. Further, the expression levels of the proliferation specific marker genes were decreased upon KDM1A knockdown in oral cancer cell lines. In addition to the results, a MTT assay, colony forming assay, and FACS analysis revealed the role of KDM1A in oral cancer cell proliferation. These results confirmed the active role of KDM1A in cellular proliferation in oral cancer. In order to identify the mechanism behind the cell proliferation, we have done an iPAP analysis for the oral tumor expression profile. We identified the strong association between KDM1A expression and E2F1 signaling. Four independent gene expression profiles consisting of 325 samples revealed the association. Supporting this notion, previous findings have revealed the role of KDM1A in modulating E2F activity by disturbing its stability. Numerous studies have reported that E2F1 expression was of clinical significance in different cancers [47,48]. It seems that E2F1 plays a dual role in terms of promoting tumor growth and inducing apoptosis. Increased E2F1 expression is associated with a higher proliferation index and more aggressive profile in breast and thyroid neoplasm [49]. KDM1A modulates E2F1 stability in the cells by inhibiting DNA damage-induced cell death [50]. In vitro experiments of our study confirmed the mod-ulation of E2F1 signaling activity upon KDM1A perturbations in oral cancer cell lines. Though it has been proved in the mRNA level, further validation needs to be done in the protein levels. It has been a well-established concept that high cell proliferation in cancer is associated with poor clinical outcome in diverse cancer types [51–53]. KDM1A expression was also identified as an independent prognosticator of a few cancers. It has been reported that elevated expression of KDM1A is associated with poor prognosis in cancers [24,26,54,55]. Our data also identified the prognostic role of KDM1A in two independent cohorts of oral cancer. KDM1A predicted poor clinical outcomes in oral tumor patients compared to normal patients. Our data suggest that KDM1A is overexpressed in oral cancer and promotes its proliferation via modulating the E2F signaling and confers poor clinical outcome; KDM1A depletion abrogates cell proliferation in oral cancer and leads to better clinical outcome (Fig. 7). Cumulative results of our data suggest that KDM1A is an independent diagnostic and prognostic factor in oral cancer. KDM1A might become a useful target for therapeutic options. Assessment of KDM1A expression in oral cancer samples might provide significant information about patients’ clinical outcome and therapeutic development.
Fig. 7.
Schematic representation of KDM1A over expression and its role in oral cancer.
Supplementary Material
Acknowledgements
We thank IISER Bhopal for Intramural research funds. We thank Ministry of Human Resource Development for fellowships to Dr. Sathiya Pandi, Ms. Smriti Singh and Mr. Amit Gupta. We thank Council of Scientific & Industrial Research for fellowship to Ms. Sandhya Yadav.
Footnotes
Conflict of interest
The authors have no conflict of interests.
Appendix: Supplementary material
Supplementary data to this article can be found online at doi:10.1016/j.canlet.2015.07.022.
References
- [1].Shah JP, Gil Z, Current concepts in management of oral cancer–surgery, Oral Oncol. 45 (2009) 394–401. [DOI] [PMC free article] [PubMed] [Google Scholar]
- [2].Ferlay J, Soerjomataram I, Ervik M, Dikshit R, Eser S, Mathers C, et al. , GLOBOCAN 2012 v1.0, Cancer Incidence and Mortality Worldwide: IARC CancerBase No. 11 [Internet]. International Agency for Research on Cancer, Lyon, France: Available from: <http://globocan.iarc.fr>, 2013. (accessed on 20/07/2015).
- [3].Gupta B, Ariyawardana A, Johnson NW, Oral cancer in India continues in epidemic proportions: evidence base and policy initiatives, Int. Dent. J 63 (2013) 12–25. [DOI] [PMC free article] [PubMed] [Google Scholar]
- [4].Baykul T, Yilmaz HH, Aydin U, Aydin MA, Aksoy M, Yildirim D, Early diagnosis of oral cancer, J. Int. Med. Res. 38 (2010) 737–749. [DOI] [PubMed] [Google Scholar]
- [5].Sciubba JJ, Oral cancer. The importance of early diagnosis and treatment, Am. J. Clin. Dermatol. 2 (2001) 239–251. [DOI] [PubMed] [Google Scholar]
- [6].Messadi DV, Wilder-Smith P, Wolinsky L, Improving oral cancer survival: the role of dental providers, J. Calif. Dent. Assoc. 37 (2009) 789–798. [PMC free article] [PubMed] [Google Scholar]
- [7].Ford PJ, Farah CS, Early detection and diagnosis of oral cancer: strategies for improvement, J. Cancer Policy 1 (2013) e2–e7. [Google Scholar]
- [8].Shah FD, Begum R, Vajaria BN, Patel KR, Patel JB, Shukla SN, et al. , A review on salivary genomics and proteomics biomarkers in oral cancer, Indian J. Clin. Biochem. 26 (2011) 326–334. [DOI] [PMC free article] [PubMed] [Google Scholar]
- [9].Miremadi A, Oestergaard MZ, Pharoah PD, Caldas C, Cancer genetics of epigenetic genes, Hum. Mol. Genet. 16 (Spec1) (2007) R28–R49. [DOI] [PubMed] [Google Scholar]
- [10].Sharma S, Kelly TK, Jones PA, Epigenetics in cancer, Carcinogenesis 31 (2010) 27–36. [DOI] [PMC free article] [PubMed] [Google Scholar]
- [11].Theisen ER, Gajiwala S, Bearss J, Sorna V, Sharma S, Janat-Amsbury M, Reversible inhibition of lysine specific demethylase 1 is a novel anti-tumor strategy for poorly differentiated endometrial carcinoma, BMC Cancer 14 (2014) 752. [DOI] [PMC free article] [PubMed] [Google Scholar]
- [12].Cohen I, Poreba E, Kamieniarz K, Schneider R, Histone modifiers in cancer: friends or foes?, Genes Cancer 2 (2011) 631–647. [DOI] [PMC free article] [PubMed] [Google Scholar]
- [13].Kondo Y, Shen L, Issa JP, Critical role of histone methylation in tumor suppressor gene silencing in colorectal cancer, Mol. Cell. Biol. 23 (2003) 206–215. [DOI] [PMC free article] [PubMed] [Google Scholar]
- [14].Berger SL, Histone modifications in transcriptional regulation, Curr. Opin. Genet. Dev. 12 (2002) 142–148. [DOI] [PubMed] [Google Scholar]
- [15].Zhang Y, Reinberg D, Transcription regulation by histone methylation: interplay between different covalent modifications of the core histone tails, Genes Dev. 15 (2001) 2343–2360. [DOI] [PubMed] [Google Scholar]
- [16].Venkatesh S, Workman JL, Histone exchange, chromatin structure and the regulation of transcription, Nat. Rev. Mol. Cell Biol. 16 (2015) 178–189. [DOI] [PubMed] [Google Scholar]
- [17].Hoffmann I, Roatsch M, Schmitt ML, Carlino L, Pippel M, Sippl W, et al. , The role of histone demethylases in cancer therapy, Mol. Oncol 6 (2012) 683–703. [DOI] [PMC free article] [PubMed] [Google Scholar]
- [18].Kampranis SC, Tsichlis PN, Histone demethylases and cancer, Adv. Cancer Res. 102 (2009) 103–169. [DOI] [PMC free article] [PubMed] [Google Scholar]
- [19].Crea F, Sun L, Mai A, Chiang YT, Farrar WL, Danesi R, et al. , The emerging role of histone lysine demethylases in prostate cancer, Mol. Cancer 11 (2012) 52. [DOI] [PMC free article] [PubMed] [Google Scholar]
- [20].He Y, Korboukh I, Jin J, Huang J, Targeting protein lysine methylation and demethylation in cancers, Acta Biochim. Biophys. Sin. (Shanghai) 44 (2012) 70–79. [DOI] [PMC free article] [PubMed] [Google Scholar]
- [21].Shi Y, Lan F, Matson C, Mulligan P, Whetstine JR, Cole PA, et al. , Histone demethylation mediated by the nuclear amine oxidase homolog LSD1, Cell 119 (2004) 941–953. [DOI] [PubMed] [Google Scholar]
- [22].Amente S, Lania L, Majello B, The histone LSD1 demethylase in stemness and cancer transcription programs, Biochim. Biophys. Acta 2013 (1829) 981–986. [DOI] [PubMed] [Google Scholar]
- [23].Kashyap V, Ahmad S, Nilsson EM, Helczynski L, Kenna S, Persson JL, et al. , The lysine specific demethylase-1 (LSD1/KDM1A) regulates VEGF-A expression in prostate cancer, Mol. Oncol 7 (2013) 555–566. [DOI] [PMC free article] [PubMed] [Google Scholar]
- [24].Nagasawa S, Sedukhina AS, Nakagawa Y, Maeda I, Kubota M, Ohnuma S, et al. , LSD1 overexpression is associated with poor prognosis in basal-like breast cancer, and sensitivity to PARP inhibition, PLoS ONE 10 (2015) e0118002. [DOI] [PMC free article] [PubMed] [Google Scholar]
- [25].Lan W, Zhang D, Jiang J, The roles of LSD1-mediated epigenetic modifications in maintaining the pluripotency of bladder cancer stem cells, Med. Hypotheses 81 (2013) 823–825. [DOI] [PubMed] [Google Scholar]
- [26].Yuan C, Li Z, Qi B, Zhang W, Cheng J, Wang Y, High expression of the histone demethylase LSD1 associates with cancer cell proliferation and unfavorable prognosis in tongue cancer, J. Oral Pathol. Med 44 (2015) 159–165. [DOI] [PubMed] [Google Scholar]
- [27].Pajtler KW, Weingarten C, Thor T, Kunkele A, Heukamp LC, Buttner R, et al. , The KDM1A histone demethylase is a promising new target for the epigenetic therapy of medulloblastoma, Acta Neuropathol. Commun. 1 (2013) 19. [DOI] [PMC free article] [PubMed] [Google Scholar]
- [28].Ding J, Zhang ZM, Xia Y, Liao GQ, Pan Y, Liu S, et al. , LSD1-mediated epigenetic modification contributes to proliferation and metastasis of colon cancer, Br. J. Cancer 109 (2013) 994–1003. [DOI] [PMC free article] [PubMed] [Google Scholar]
- [29].Barrett T, Wilhite SE, Ledoux P, Evangelista C, Kim IF, Tomashevsky M, et al. , NCBI GEO: archive for functional genomics data sets–update, Nucleic Acids Res. 41 (2013) D991–D995. [DOI] [PMC free article] [PubMed] [Google Scholar]
- [30].Edgar R, Domrachev M, Lash AE, Gene Expression Omnibus: NCBI gene expression and hybridization array data repository, Nucleic Acids Res. 30 (2002) 207–210. [DOI] [PMC free article] [PubMed] [Google Scholar]
- [31].Subramanian A, Tamayo P, Mootha VK, Mukherjee S, Ebert BL, Gillette MA, et al. , Gene set enrichment analysis: a knowledge-based approach for interpreting genome-wide expression profiles, Proc. Natl. Acad. Sci. U.S.A. 102 (2005) 15545–15550. [DOI] [PMC free article] [PubMed] [Google Scholar]
- [32].Barretina J, Caponigro G, Stransky N, Venkatesan K, Margolin AA, Kim S, et al. , The Cancer Cell Line Encyclopedia enables predictive modelling of anticancer drug sensitivity, Nature 483 (2012) 603–607. [DOI] [PMC free article] [PubMed] [Google Scholar]
- [33].Gotea V, Ovcharenko I, DiRE: identifying distant regulatory elements of co-expressed genes, Nucleic Acids Res. 36 (2008) W133–W139. [DOI] [PMC free article] [PubMed] [Google Scholar]
- [34].Kaimal V, Bardes EE, Tabar SC, Jegga AG, Aronow BJ, ToppCluster: a multiple gene list feature analyzer for comparative enrichment clustering and network-based dissection of biological systems, Nucleic Acids Res. 38 (2010) W96–W102. [DOI] [PMC free article] [PubMed] [Google Scholar]
- [35].Lamb J, Crawford ED, Peck D, Modell JW, Blat IC, Wrobel MJ, et al. , The Connectivity Map: using gene-expression signatures to connect small molecules, genes, and disease, Science 313 (2006) 1929–1935. [DOI] [PubMed] [Google Scholar]
- [36].Chen HY, Yu SL, Chen CH, Chang GC, Chen CY, Yuan A, et al. , A five-gene signature and clinical outcome in non-small-cell lung cancer, N. Engl. J. Med. 356 (2007) 11–20. [DOI] [PubMed] [Google Scholar]
- [37].Lund AH, van Lohuizen M, Epigenetics and cancer, Genes Dev. 18 (2004) 2315–2335. [DOI] [PubMed] [Google Scholar]
- [38].Gronbaek K, Hother C, Jones PA, Epigenetic changes in cancer, APMIS 115 (2007) 1039–1059. [DOI] [PubMed] [Google Scholar]
- [39].Karpf AR, Jones DA, Reactivating the expression of methylation silenced genes in human cancer, Oncogene 21 (2002) 5496–5503. [DOI] [PubMed] [Google Scholar]
- [40].Shukla S, Meeran SM, Epigenetics of cancer stem cells: pathways and therapeutics, Biochim. Biophys. Acta 2014 (1840) 3494–3502. [DOI] [PubMed] [Google Scholar]
- [41].Kelly TK, De Carvalho DD, Jones PA, Epigenetic modifications as therapeutic targets, Nat. Biotechnol. 28 (2010) 1069–1078. [DOI] [PMC free article] [PubMed] [Google Scholar]
- [42].Varier RA, Timmers HT, Histone lysine methylation and demethylation pathways in cancer, Biochim. Biophys. Acta 1815 (2011) 75–89. [DOI] [PubMed] [Google Scholar]
- [43].Cho HS, Shimazu T, Toyokawa G, Daigo Y, Maehara Y, Hayami S, et al. , Enhanced HSP70 lysine methylation promotes proliferation of cancer cells through activation of Aurora kinase B, Nat. Commun 3 (2012) 1072. [DOI] [PMC free article] [PubMed] [Google Scholar]
- [44].Hamamoto R, Saloura V, Nakamura Y, Critical roles of non-histone protein lysine methylation in human tumorigenesis, Nat. Rev. Cancer 15 (2015) 110–124. [DOI] [PubMed] [Google Scholar]
- [45].Lv T, Yuan D, Miao X, Lv Y, Zhan P, Shen X, et al. , Over-expression of LSD1 promotes proliferation, migration and invasion in non-small cell lung cancer, PLoS ONE 7 (2012) e35065. [DOI] [PMC free article] [PubMed] [Google Scholar]
- [46].Sun G, Alzayady K, Stewart R, Ye P, Yang S, Li W, et al. , Histone demethylase LSD1 regulates neural stem cell proliferation, Mol. Cell. Biol. 30 (2010) 1997–2005. [DOI] [PMC free article] [PubMed] [Google Scholar]
- [47].Worku D, Jouhra F, Jiang GW, Patani N, Newbold RF, Mokbel K, Evidence of a tumour suppressive function of E2F1 gene in human breast cancer, Anticancer Res. 28 (2008) 2135–2139. [PubMed] [Google Scholar]
- [48].Lee JS, Leem SH, Lee SY, Kim SC, Park ES, Kim SB, et al. , Expression signature of E2F1 and its associated genes predict superficial to invasive progression of bladder tumors, J. Clin. Oncol. 28 (2010) 2660–2667. [DOI] [PubMed] [Google Scholar]
- [49].Hung JJ, Hsueh CT, Chen KH, Hsu WH, Wu YC, Clinical significance of E2F1 protein expression in non-small cell lung cancer, Exp. Hematol. Oncol 1 (2012) 18. [DOI] [PMC free article] [PubMed] [Google Scholar]
- [50].Kontaki H, Talianidis I, Lysine methylation regulates E2F1-induced cell death, Mol. Cell 39 (2010) 152–160. [DOI] [PubMed] [Google Scholar]
- [51].Andruska N, Zheng X, Yang X, Helferich WG, Shapiro DJ, Anticipatory estrogen activation of the unfolded protein response is linked to cell proliferation and poor survival in estrogen receptor alpha-positive breast cancer, Oncogene 34 (29) (2015) 3760–3769. [DOI] [PMC free article] [PubMed] [Google Scholar]
- [52].Wang XY, Penalva LO, Yuan H, Linnoila RI, Lu J, Okano H, et al. , Musashi1 regulates breast tumor cell proliferation and is a prognostic indicator of poor survival, Mol. Cancer 9 (2010) 221. [DOI] [PMC free article] [PubMed] [Google Scholar]
- [53].Wen N, Wang Y, Wen L, Zhao SH, Ai ZH, Wu B, et al. , Overexpression of FOXM1 predicts poor prognosis and promotes cancer cell proliferation, migration and invasion in epithelial ovarian cancer, J. Transl. Med 12 (2014) 134. [DOI] [PMC free article] [PubMed] [Google Scholar]
- [54].Derr RS, van Hoesel AQ, Benard A, Goossens-Beumer IJ, Sajet A, Dekker-Ensink NG, et al. , High nuclear expression levels of histone-modifying enzymes LSD1, HDAC2 and SIRT1 in tumor cells correlate with decreased survival and increased relapse in breast cancer patients, BMC Cancer 14 (2014) 604. [DOI] [PMC free article] [PubMed] [Google Scholar]
- [55].Chen C, Ge J, Lu Q, Ping G, Yang C, Fang X, Expression of Lysine-specific demethylase 1 in human epithelial ovarian cancer, J. Ovarian Res 8 (2015) 28. [DOI] [PMC free article] [PubMed] [Google Scholar]
Associated Data
This section collects any data citations, data availability statements, or supplementary materials included in this article.


