Abstract
INTRODUCTION:
Previous studies have demonstrated that autoantibodies against tumor-associated antigens (TAAs) in patients with cancer can be used as sensitive immunodiagnostic biomarkers for the detection of cancer. Most of these TAAs are involved in the tumorigenesis pathway. Cancer driver genes with intragenic mutations can promote tumorigenesis. This study aims to identify autoantibodies against TAAs encoded by cancer driver genes in sera as potential immunodiagnostic biomarkers for gastric adenocarcinoma (GAC).
METHODS:
Protein arrays based on cancer driver genes were customized for screening candidate TAAs in 100 GAC sera and 50 normal control (NC) sera. Autoantibodies against candidate TAAs were assessed by enzyme-linked immunosorbent assay in both training group (205 GAC sera and 205 NC sera) and independent validation group (126 GAC sera and 126 NC sera). Moreover, the immunodiagnostic models were respectively established and validated in the training group and validation group.
RESULTS:
A panel with 5 autoantibodies including anti-TP53, anti-COPB1, anti-GNAS, anti–serine/arginine-rich splicing factor 2, and anti-SMARCB1 was selected by the Fisher linear discriminant analysis model with an areas under receiver operating characteristic curve (AUC) of 0.928 (95% confidence interval [CI]: 0.888–0.967) in the training cohort and an AUC of 0.885 (95% CI: 0.852–0.918) in the validation cohort. Besides, the panel with 5 autoantibodies including anti-TP53, anti-COPB1, anti-GNAS, anti-PBRM1, and anti-ACVR1B which were selected by the binary logistic regression model showed an AUC of 0.885 (95% CI: 0.852–0.919) in the training cohort and 0.884 (95% CI: 0.842–0.925) in the validation cohort.
DISCUSSION:
Two panels which were selected in this study could boost the detection of anti-TAA autoantibodies in sera as biomarkers for the detection of GAC.
INTRODUCTION
Gastric cancer (GC) still remains one of the top 10 cancer types and the second most leading cause of cancer-related death worldwide (1). Gastric adenocarcinoma (GAC) including intestinal type and diffuse type is the most frequent primary GC (2). A prospective cohort study from 17 cancer registries in China showed that the 5-year survival rate of GC is only 34.4% among all GC cases (3) and the 5-year survival rate would increase to 59% if the GC was diagnosed at early stage (4). However, more than 80% of GC cases were diagnosed at advanced stage because of the lack of noninvasive screening tests before the appearance of the specific clinical symptoms (5).
Nowadays, some serological biomarkers, such as carcinoembryonic antigen and cancer antigen 72-4 used in clinical application, present a positive rate of less than 30% as a screening test for GAC (6). Therefore, it is urgent to explore novel noninvasive tests for the detection of GC. Increasing studies have been focusing on looking for effective screening biomarkers in the screening of high-risk individuals (7). Meanwhile, autoantibodies against tumor-associated antigens (TAAs), as the sensitive reports from the host immune system, implied promising biomarkers for the early detection of cancers because of their early-stage appearance, stable existence, and easily detection of cancers (8–12). Our previous studies showed the possibility of serum autoantibodies as the biomarkers in the detection of the early-stage GC with the sensitivity of 76.6% and specificity of 72.3% (13). However, the autoantibodies against TAAs which were evaluated previously were mostly selected from scatter reporters from others. Therefore, it is still necessary to explore new serum anti-TAA autoantibodies with high specificity and sensitivity for early detection of GAC.
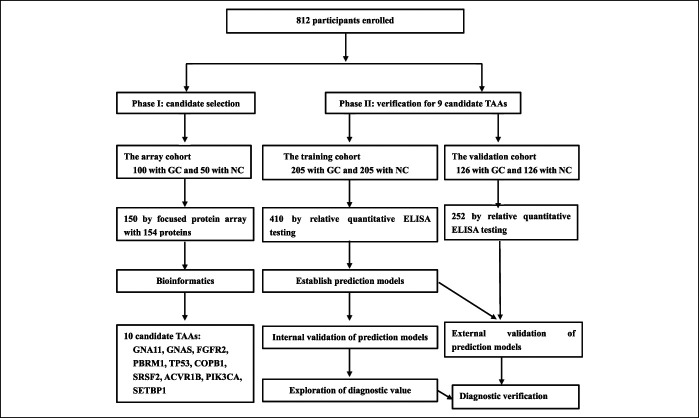
Cancer driver genes are those genes whose mutations endow the tumor cell a selective growth advantage and make contributions to tumorigenesis (14). A typical tumor usually contains 2–8 of these “driver” genes mutations which could modulate the signaling pathways (15,16). Proteome microarray technology has been a highly efficient and comprehensive tool for identifying new serum biomarkers for cancers. Based on the evidence above, we proposed a hypothesis that the autoantibodies against TAAs encoded by cancer driver genes could be the potential biomarkers for detecting GAC. In this study, we designed a 2-stage study to explore the potential biomarkers of anti-TAA autoantibodies for GAC detection. The discovery stage was considered as phase I for the discovery of candidate TAAs using the focused protein arrays, and the validation stage was designed as phase II for the validation of autoantibodies in 2 different cohorts including the training cohort and validation cohort using enzyme-linked immunosorbent assay (ELISA) (Figure 1). Then, the optimal prediction models were constructed and estimated in the training cohort and validation cohort. Finally, the potential biomarkers of anti-TAA autoantibodies for the detection of GAC were identified and evaluated.
Figure 1.
The overall study for identifying new GC biomarkers and prediction models. ELISA, enzyme-linked immunosorbent assay; GC, gastric cancer; NC, normal control; TAA, tumor-associated antigen.
METHODS
Serum samples
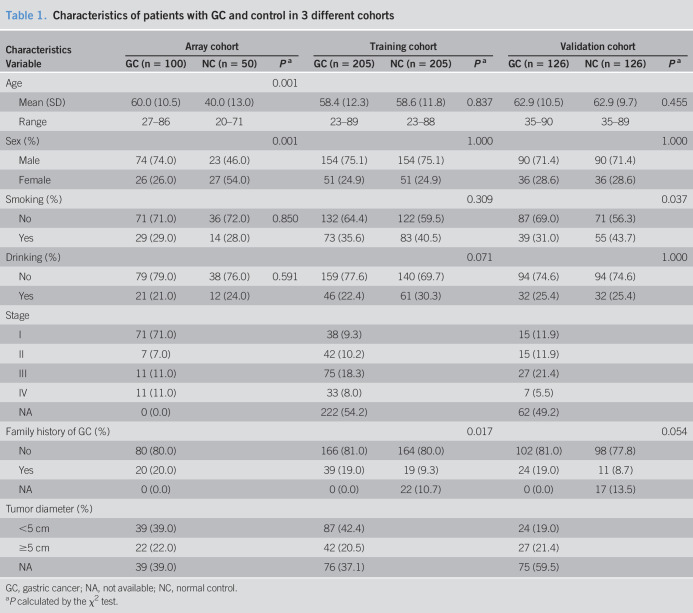
Three independent cohorts, including discovery cohort (100 GAC samples and 50 normal control [NC] samples), training cohort (205 GAC samples and 205 NC samples), and validation cohort (126 GAC samples and 126 NC samples), were used in this study (Table 1). In total, 431 GAC samples and 381 cancer-free healthy NCs were included in this study. All serum samples were from the sera bank of Tumor Epidemiology Laboratory of Zhengzhou University (Henan, China). The serum samples of the discovery cohort were collected from December 2016 to May 2017, and the serum samples of the training cohort were recruited from January 2015 to December 2016. Besides, we recruited another independent validation cohort between January 1, 2017, and December 30, 2017. The NC samples in training and validation cohorts were matched to GAC samples by age and sex. The inclusion criteria of samples were as follows: (a) The patients were diagnosed by pathologists with GAC. (b) The sera from patients with GAC were collected before anticancer treatment. (c) All healthy controls are cancer-free and have no evidence of gastric diseases and autoimmune disease. The informed consent forms were signed by all the subjects. This study was approved by the Medical Ethics Committee of Zhengzhou University (Zhengzhou, China).
Table 1.
Characteristics of patients with GC and control in 3 different cohorts
| Characteristics | Array cohort | Training cohort | Validation cohort | ||||||
| Variable | GC (n = 100) | NC (n = 50) | Pa | GC (n = 205) | NC (n = 205) | Pa | GC (n = 126) | NC (n = 126) | Pa |
| Age | 0.001 | ||||||||
| Mean (SD) | 60.0 (10.5) | 40.0 (13.0) | 58.4 (12.3) | 58.6 (11.8) | 0.837 | 62.9 (10.5) | 62.9 (9.7) | 0.455 | |
| Range | 27–86 | 20–71 | 23–89 | 23–88 | 35–90 | 35–89 | |||
| Sex (%) | 0.001 | 1.000 | 1.000 | ||||||
| Male | 74 (74.0) | 23 (46.0) | 154 (75.1) | 154 (75.1) | 90 (71.4) | 90 (71.4) | |||
| Female | 26 (26.0) | 27 (54.0) | 51 (24.9) | 51 (24.9) | 36 (28.6) | 36 (28.6) | |||
| Smoking (%) | 0.309 | 0.037 | |||||||
| No | 71 (71.0) | 36 (72.0) | 0.850 | 132 (64.4) | 122 (59.5) | 87 (69.0) | 71 (56.3) | ||
| Yes | 29 (29.0) | 14 (28.0) | 73 (35.6) | 83 (40.5) | 39 (31.0) | 55 (43.7) | |||
| Drinking (%) | 0.071 | 1.000 | |||||||
| No | 79 (79.0) | 38 (76.0) | 0.591 | 159 (77.6) | 140 (69.7) | 94 (74.6) | 94 (74.6) | ||
| Yes | 21 (21.0) | 12 (24.0) | 46 (22.4) | 61 (30.3) | 32 (25.4) | 32 (25.4) | |||
| Stage | |||||||||
| I | 71 (71.0) | 38 (9.3) | 15 (11.9) | ||||||
| II | 7 (7.0) | 42 (10.2) | 15 (11.9) | ||||||
| III | 11 (11.0) | 75 (18.3) | 27 (21.4) | ||||||
| IV | 11 (11.0) | 33 (8.0) | 7 (5.5) | ||||||
| NA | 0 (0.0) | 222 (54.2) | 62 (49.2) | ||||||
| Family history of GC (%) | 0.017 | 0.054 | |||||||
| No | 80 (80.0) | 166 (81.0) | 164 (80.0) | 102 (81.0) | 98 (77.8) | ||||
| Yes | 20 (20.0) | 39 (19.0) | 19 (9.3) | 24 (19.0) | 11 (8.7) | ||||
| NA | 0 (0.0) | 0 (0.0) | 22 (10.7) | 0 (0.0) | 17 (13.5) | ||||
| Tumor diameter (%) | |||||||||
| <5 cm | 39 (39.0) | 87 (42.4) | 24 (19.0) | ||||||
| ≥5 cm | 22 (22.0) | 42 (20.5) | 27 (21.4) | ||||||
| NA | 39 (39.0) | 76 (37.1) | 75 (59.5) | ||||||
GC, gastric cancer; NA, not available; NC, normal control.
P calculated by the χ2 test.
Design and quality control of the focused protein microarrays
One hundred fifty-four human recombinant proteins provided by CDI Laboratories (Mayaguez) were used to construct the focused protein arrays (BC-BIO, Foshan, China). Among them, 143 proteins were encoded by 115 cancer driver genes (58 tumor suppressor gene and 57 oncogene) (16) and 11 proteins encoded by 10 genes which were reported to be potential biomarkers by our previous studies (17,18). The quality control of the focused protein arrays was described in our previous study (19).
The detection of 154 proteins by protein microarrays
Array cohort (100 GAC and 50 NC) serum samples were profiled by BC-BIO using the above protein microarrays. Protein microarrays stored at −80°C were set out at room temperature for half an hour and then incubated in a blocking buffer (3% bovine serum albumin in phosphate buffer saline [PBS] buffer with 0.1% Tween 20) at 37°C for 3 hours. Serum samples were diluted 1:50 in PBS containing 0.1% Tween 20 detergent (PBS-T). A total of 200 µL of the diluted serum sample was overlaid on each subarray and then incubated at 4°C overnight. The array was washed with PBS-T, and the bound autoantibodies were detected by incubating with Alexa Fluor 532 goat anti-human IgG (Jackson ImmunoResearch, West Grove, PA), diluted 1:1,000 in PBS-T at room temperature for 1 hour. Arrays were washed with PBS-T and dried by centrifugation at room temperature. Arrays were scanned in a LuxScan 10K-A (CapitalBio Corporation, Beijing, China), and the captured fluorescence data were analyzed with GenePix Pro 6.0 software (Molecular Devices).
Detection of 10 anti-TAA autoantibodies by ELISA
ELISAs were performed to verify the selected candidate TAAs using commercial recombinant proteins (Cloud-Clone and CUSABIO) as described in previous study (20). Briefly, 96-well high-bind ELISA plates (Yunpeng Technology, china) were coated with proteins at final concentration from 0.125 to 0.500 μg/mL in coating buffer overnight at 4°C. The other detailed experimental procedures were described in our other studies (13).
To ensure the accuracy and reliability of the results, a positive control serum, a negative control serum, and 2 blank controls with antibody dilution buffer were set up in each plate. To ensure the comparability in different plates, the mean value of the 8 fixed human samples, which were set up on each plate, was used to do the normalization.
Design of overall study
A 2-phase strategy was designed to identify the serum biomarkers for GAC, and the flow chart was shown in Figure 1. The detailed process was described in the Supplementary Materials and Methods 1 (see Supplementary Digital Content 1, http://links.lww.com/CTG/A471).
Analysis of focused protein arrays
The median values of Fij (foreground) and Bij (background) intensity of each protein spot on the arrays were extracted from the software of Genepix Pro6.0. First, the mean and SD of the background values of all samples were calculated. The corresponding sample would be omitted from the study, if a background value was higher than the mean + 2 SD of all samples. Then, signal-to-noise ratio which was defined as the ratio of the foreground (Fij) to background (Bij) intensity with the duplicate on the array of each protein was used in the following statistics. The P values were calculated by nonparametric Mann-Whitney U tests between GAC and NC groups. The fold change of each protein was used to show the difference between 2 groups. Areas under receiver operating characteristic (ROC) curves (AUCs) and P values were used to compare the superior protein. AUC > 0.5 and P < 0.5 were the basic criteria for selecting candidate TAAs. The optimal cutoff value for each candidate biomarker was evaluated when the difference of positive rate between 2 groups was the biggest while specificity was higher than 90%. Based on the cutoff value, the positive rate of cancer and control group was calculated. Based on the criteria (AUC > 0.05, P < 0.05; the positive rate between 2 groups was not less than 10%, and the value of signal-to-noise ratio in the GAC group was significantly higher than that in the NC group), 35 candidate TAAs were selected. Then, the top 10 candidate TAAs of AUC values were further validated by ELISA.
Analysis of ELISA data
The optical density values were obtained by ELISA in cancer and control cohorts. If the data were normally distributed, the t test would be used to evaluate the difference of autoantibodies between 2 groups or the Mann-Whitney U test would be used. Then, the backward stepwise conditional logistic regression (LR) model and 2-class Fisher linear discriminant analysis (LDA) model (stepwise method) were constructed based on the selected candidate autoantibodies in the training cohort. The AUCs, sensitivity, and the corresponding specificity of ROC curves were used to estimate the diagnostic value of the single autoantibody. Besides, the positive predictive value (PPV), negative predict value (NPV), positive likelihood ratio (+LR) and negative likelihood ratio (−LR), accuracy, and kappa were also added to evaluate diagnostic value of the immunodiagnostic models based on serum autoantibodies by ELISA and different clinical stages. The sensitivity, +LR, and −LR were set when the Youden index reached the highest while specificity is more than 90%. To evaluate the performance of models, leave-one-out cross-validation (LOOCV) was used for the internal validation and the other independent cohort was used for the external validation.
All P values <0.05 (2-sided) were considered statistical difference. All statistical analyses were performed by IBM SPSS Statistical 21.0, GraphPad Prism 5, and R studio (version 3.3.3; R Foundation for Statistical Computing, Vienna, Austria).
RESULTS
The serum samples and study design
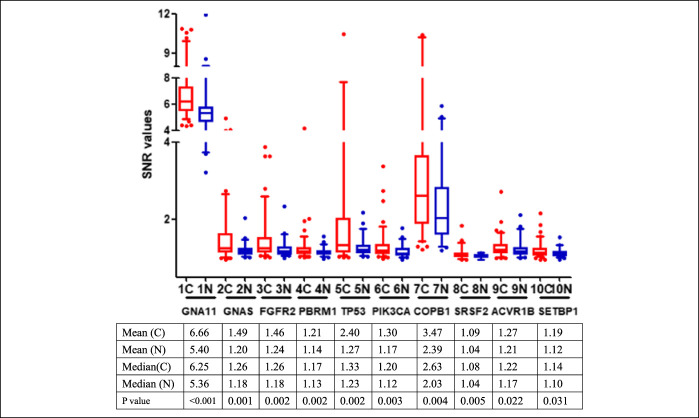
In phase I, the focused protein microarrays including 154 proteins were used to identify the serological biomarkers for GAC detection by the discovery cohort including 100 patients with GAC and 50 healthy controls (Table 1). No significant difference were found in the distribution of age and sex between 2 groups (P > 0.05). First, based on the standards (AUC > 0.5, P < 0.05 and the difference of positive rate was not less than 10%), 56 TAAs were selected as the candidate TAAs. Finally, among the 56 TAAs, the top 10 candidate TAAs (GNA11, GNAS, FGFR2, PBRM1, TP53, COPB1, SRSF2, ACVR1B, PIK3CA, and SETBP1) of AUC values were selected as the serological biomarkers by the focused protein arrays (Figure 2).
Figure 2.
The levels by the SNR of 10 TAAs in patients with gastric cancer and normal individuals. The line and whiskers within a box mark the median and 5–95 percentiles, respectively. C (N = 100); N (N = 50). P < 0.05 (Mann-Whitney U test) showed that the median SNR value was significantly higher in gastric cancer sera than in normal controls. C, cancer; N, normal; SNR, single-to-noise ratio; TAA, tumor-associated antigen.
In phase II, a total of 662 serum samples (410 in the training cohort and 252 in the validation cohort) were collected for validating the serological biomarkers in phase I by ELISA. In the training cohort, serum samples were collected from 205 patients with GAC (80 in stage I/II, 108 in stage III/IV, and 222 with no data available) and 205 NCs matched by age and sex. Age, sex, smoking, and drinking were not observed significantly difference between 2 groups (Table 1). To further validate the diagnostic ability of the anti-TAA autoantibodies, another independent validation cohort including 126 patients with GAC and 126 NCs normal matched by age and sex was recruited in this study. There was no significantly statistical difference in the distribution of drinking history between 2 groups (P > 0.05). However, the percentage of the smokers in the GAC group was significantly higher than that in the control group (P < 0.05).
The results of single autoantibody in GC by ELISA
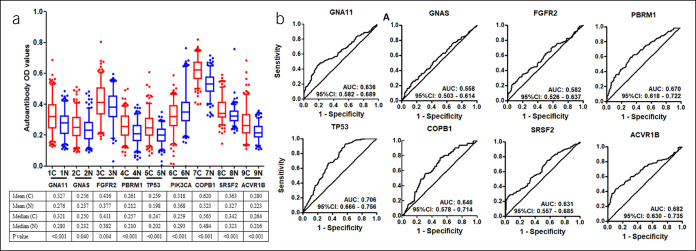
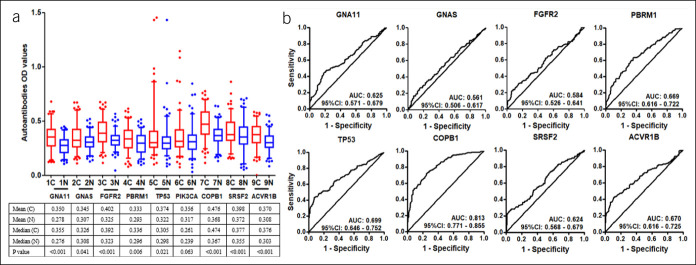
Finally, 10 anti-TAAs were selected as the biomarkers by the focused protein microarrays. Except SETBP1 recombinant protein which was not commercially available, the selected recombinant TAA proteins (GNA11, GNAS, FGFR2, PBRM1, TP53, PIK3CA, COPB1, SRSF2, and ACVR1B) were used as coating antigens to detect the corresponding autoantibodies in sera in the training cohort. The results showed that the level of all anti-TAA autoantibodies in GAC were significantly higher in the GAC group compared with the NC cohort except anti-PIK3CA (Figure 3). The AUC of the single anti-TAA autoantibody ranged from 0.558 to 0.706. The AUC of TP53 autoantibody was the highest (AUC: 0.706, 95% confidence interval [CI]: 0.666–0.756), and the GNAS autoantibody was lowest (AUC: 0.558, 95% CI: 0.503–0.614) in the training cohort. Then, we further verified the 9 anti-TAA autoantibodies in the validation group by ELISA, and similar results were found in the validation group (Figure 4).
Figure 3.
(a) Serum levels (optical density, OD) of 9 autoantibodies in patients with gastric cancer and normal individuals in the training cohort. The line and whiskers within a box marks the median and 5–95 percentiles, respectively. C (N = 205); N (N = 205). P < 0.05 (Mann-Whitney U test) showed that the median OD value was significantly higher in gastric cancer sera than that in normal controls. (b) Receiver operating characteristic curves of gastric cancer versus normal controls for 8 significant TAAs using ELISA OD. C, cancer; CI, confidence interval; ELISA, enzyme-linked immunosorbent assay; N, normal; TAA, tumor-associated antigen.
Figure 4.
(a) Serum levels (optical density, OD) of 9 autoantibodies in patients with gastric cancer and normal individuals in the validation cohort. The line and whiskers within a box marks the median and 5–95 percentiles, respectively. C (N = 126); N (N = 126). P < 0.05 (Mann-Whitney U test) showed that the median OD value was significantly higher in gastric cancer sera than in normal controls. (b) Receiver operating characteristic curves of gastric cancer versus normal controls for 8 significant TAAs using ELISA OD in the validation cohort. C, cancer; CI, confidence interval; ELISA, enzyme-linked immunosorbent assay; N, normal; TAA, tumor-associated antigen.
Building different immunodiagnostic models to distinguish GC from GC-free patients and the internal validation
To select the panels of autoantibodies based on the training cohort for distinguishing GAC and NC, the LR model and LDA model were constructed. The independent variables were the optical density values of 8 significant TAA autoantibodies (GNA11, GNAS, FGFR2, PBRM1, TP53, COPB1, SRSF2, and ACVR1B), and the dependent variable was whether the participant was GAC or not. The result showed that 5 anti-TAAs (GNAS, PBRM1, TP53, COPB1, and ACVR1B) were included in the LR model and the model was as follows: PRE (P = GC) = 1/{1 + EXP (−[−11.129 PBRM1 + 3.076 TP53 + 9.463 COPB1 + 9.147 ACVR1B + 6.678 GNA11 − 6.737])}. Furthermore, 5 TAA autoantibodies (TP53, SMARCB1, COPB1, SRSF2, and GNAS) were included in the LDA model (stepwise method) to distinguish GAC and NC. The Fisher discriminant model was as follows: Cf = 16.319 TP53 + 5.423 SMARCB1 − 4.542 COPB1 − 5.843 SRSF2 − 6.252 GNAS + 0.811 (canonical correlation = 0.718, P < 0.001), and the Bayes discriminant models were as follows: Cf (1) = 87.164 COPB1 + 16.934 SMARCB1 + 97.433 SRSF2 + 42.712 TP53 − 1.517 GNAS − 46.501 and Cf (0) = 97.486 COPB1 + 4.610 SMARCB1 + 110.712 SRSF2 + 5.625 TP53 + 12.690 GNAS − 47.237.
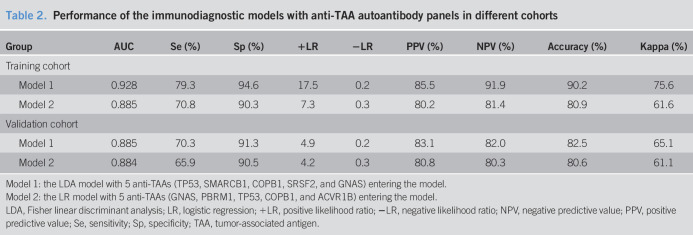
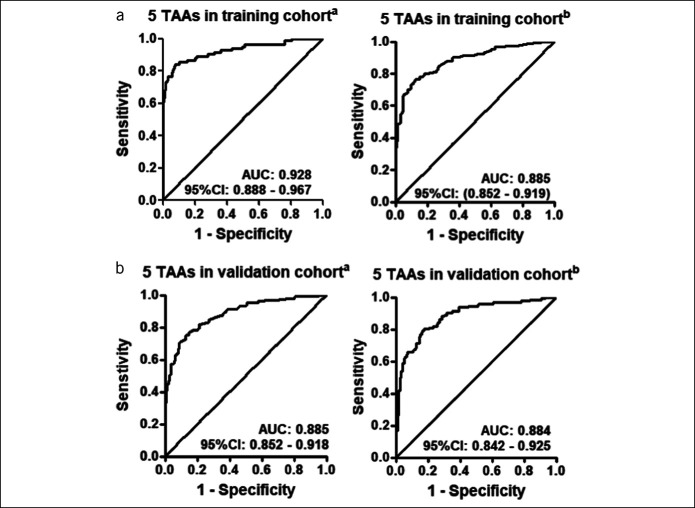
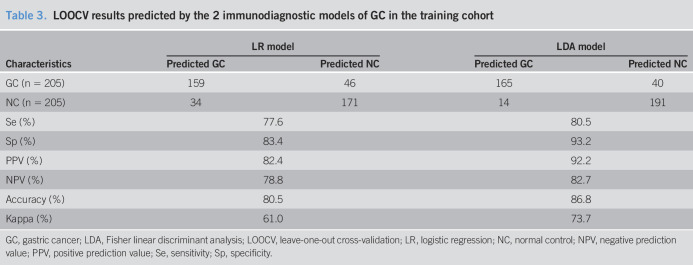
As shown in Table 2, a sensitivity of 79.3%, a specificity of 94.6%, +LR of 17.5, a PPV of 85.5%, an NPV of 91.9%, an accuracy of 90.2%, and a kappa value of 75.6% were all higher in the LDA model than those of the LR model in the training cohort. The LDA model showed an AUC of 0.928 (95% CI: 0.888–0.967), and the LR model showed an AUC of 0.885 (95% CI: 0.852–0.919) (Table 2 and Figure 5). In addition, to explore the performance of the 2 models, LOOCV were also used in 2 models. As shown in Table 3, the results showed the LDA model with a higher kappa value of 73.7% than that in the LR model of 61.0%. Also, the results validated the ability of the 2 immunodiagnostic models to distinguish patients with GAC from NC by the LOOCV.
Table 2.
Performance of the immunodiagnostic models with anti-TAA autoantibody panels in different cohorts
| Group | AUC | Se (%) | Sp (%) | +LR | −LR | PPV (%) | NPV (%) | Accuracy (%) | Kappa (%) |
| Training cohort | |||||||||
| Model 1 | 0.928 | 79.3 | 94.6 | 17.5 | 0.2 | 85.5 | 91.9 | 90.2 | 75.6 |
| Model 2 | 0.885 | 70.8 | 90.3 | 7.3 | 0.3 | 80.2 | 81.4 | 80.9 | 61.6 |
| Validation cohort | |||||||||
| Model 1 | 0.885 | 70.3 | 91.3 | 4.9 | 0.2 | 83.1 | 82.0 | 82.5 | 65.1 |
| Model 2 | 0.884 | 65.9 | 90.5 | 4.2 | 0.3 | 80.8 | 80.3 | 80.6 | 61.1 |
Model 1: the LDA model with 5 anti-TAAs (TP53, SMARCB1, COPB1, SRSF2, and GNAS) entering the model.
Model 2: the LR model with 5 anti-TAAs (GNAS, PBRM1, TP53, COPB1, and ACVR1B) entering the model.
LDA, Fisher linear discriminant analysis; LR, logistic regression; +LR, positive likelihood ratio; −LR, negative likelihood ratio; NPV, negative predictive value; PPV, positive predictive value; Se, sensitivity; Sp, specificity; TAA, tumor-associated antigen.
Figure 5.
Performance of the immunodiagnostic models with panels to detect gastric cancer. (a) Receiver operating characteristic curves for the training cohort by the LDA model and LR model. (b) Receiver operating characteristic curves for the validation cohort by the LDA model and LR model. aThe Fisher linear discriminant analysis (LDA) model with 5 anti-TAAs (TP53, SMARCB1, COPB1, SRSF2, and GNAS) entering the model. bThe backward stepwise conditional LR model with 5 anti-TAAs (GNAS, PBRM1, TP53, COPB1, and ACVR1B) entering the model. CI, confidence interval; LR, logistic regression; TAA, tumor-associated antigen.
Table 3.
LOOCV results predicted by the 2 immunodiagnostic models of GC in the training cohort
| Characteristics | LR model | LDA model | ||
| Predicted GC | Predicted NC | Predicted GC | Predicted NC | |
| GC (n = 205) | 159 | 46 | 165 | 40 |
| NC (n = 205) | 34 | 171 | 14 | 191 |
| Se (%) | 77.6 | 80.5 | ||
| Sp (%) | 83.4 | 93.2 | ||
| PPV (%) | 82.4 | 92.2 | ||
| NPV (%) | 78.8 | 82.7 | ||
| Accuracy (%) | 80.5 | 86.8 | ||
| Kappa (%) | 61.0 | 73.7 | ||
GC, gastric cancer; LDA, Fisher linear discriminant analysis; LOOCV, leave-one-out cross-validation; LR, logistic regression; NC, normal control; NPV, negative prediction value; PPV, positive prediction value; Se, sensitivity; Sp, specificity.
The external validation of the immunodiagnostic models
To estimate the classification performance of the LDA model and LR model for distinguishing GAC and NC, the models were further assessed in the independent validation cohort (126 GAC and 126 NC) as an external validation. The ability of the autoantibody panels selected by the 2 models to distinguish GAC from NC was both confirmed in the validation cohort. The discrimination ability of the LDA model showed an AUC of 0.88, a sensitivity of 70.3%, a specificity of 91.3%, a PPV of 83.1%, an NPV of 82.0%, and a kappa of 65.1% in the validation group, and the LR model showed an AUC of 0.884, a sensitivity of 65.9%, a specificity of 90.5%, a PPV of 80.8%, an NPV of 80.3%, and a kappa of 61.1% in the validation group (Table 2 and Figure 5).
The diagnostic values of the immunodiagnostic models in different clinical stage
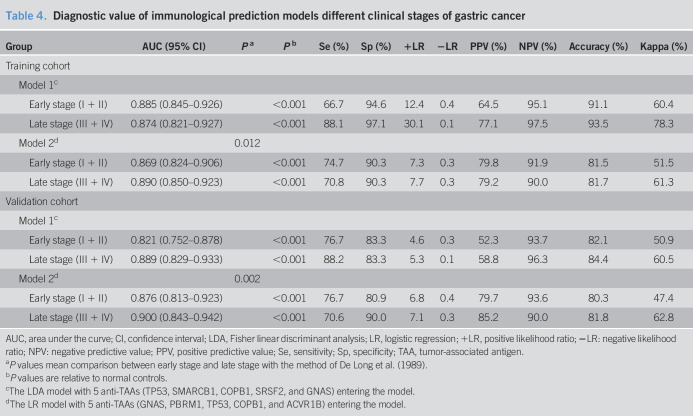
When patients with GAC were classified as early stage (I and II) and late stage (stage III and IV), the discriminant ability of the 2 immunodiagnostic models was significantly different in different clinical stages of GAC (Table 4). In the training cohort, the LDA model showed an AUC of 0.885 (95% CI: 0.845–0.926), a sensitivity of 66.7%, a specificity of 94.6%, a +LR of 12.4, a −LR of 0.4, a PPV of 64.5%, an NPV of 95.1%, an accuracy of 91.1%, and a kappa of 0.604 in the early stage (stage I + II). Meanwhile, the LR model presented an AUC of 0.869 (95% CI: 0.824–0.906), a higher sensitivity of 74.7%, a lower specificity of 90.3%, a lower +LR of 7.3, a lower −LR of 0.3, a PPV of 79.8%, an NPV of 91.9%, an accuracy of 81.5%, and a kappa of 51.5% compared with the LDA model. In the late stage (stage III + IV), the LDA model with 5 anti-TAAs presented an AUC of 0.874 (95% CI: 0.821–0.927), a sensitivity of 88.1%, a specificity of 97.1%, a +LR of 30.1, a −LR of 0.1, a PPV of 77.1%, an NPV of 97.5%, an agreement of 93.5%, and a kappa of 78.3%. Compared with the LDA model, the LR model showed a higher AUC of 0.890 (95% CI: 0.850–0.923), a lower sensitivity of 70.8%, a lower specificity of 90.3%, a lower +LR of 7.7, a higher −LR of 0.3, a higher PPV of 79.2%, a lower NPV of 90.0% and a lower accuracy of 81.7%, and a lower kappa of 61.3%. In the validation cohort, the similar results were observed. The LDA model and LR model, respectively, showed AUC of 0.821 and 0.876 in early-stage GAC and the AUC of 0.889 and 0.900 in late-stage GAC.
Table 4.
Diagnostic value of immunological prediction models different clinical stages of gastric cancer
| Group | AUC (95% CI) | Pa | Pb | Se (%) | Sp (%) | +LR | −LR | PPV (%) | NPV (%) | Accuracy (%) | Kappa (%) |
| Training cohort | |||||||||||
| Model 1c | |||||||||||
| Early stage (I + II) | 0.885 (0.845–0.926) | <0.001 | 66.7 | 94.6 | 12.4 | 0.4 | 64.5 | 95.1 | 91.1 | 60.4 | |
| Late stage (III + IV) | 0.874 (0.821–0.927) | <0.001 | 88.1 | 97.1 | 30.1 | 0.1 | 77.1 | 97.5 | 93.5 | 78.3 | |
| Model 2d | 0.012 | ||||||||||
| Early stage (I + II) | 0.869 (0.824–0.906) | <0.001 | 74.7 | 90.3 | 7.3 | 0.3 | 79.8 | 91.9 | 81.5 | 51.5 | |
| Late stage (III + IV) | 0.890 (0.850–0.923) | <0.001 | 70.8 | 90.3 | 7.7 | 0.3 | 79.2 | 90.0 | 81.7 | 61.3 | |
| Validation cohort | |||||||||||
| Model 1c | |||||||||||
| Early stage (I + II) | 0.821 (0.752–0.878) | <0.001 | 76.7 | 83.3 | 4.6 | 0.3 | 52.3 | 93.7 | 82.1 | 50.9 | |
| Late stage (III + IV) | 0.889 (0.829–0.933) | <0.001 | 88.2 | 83.3 | 5.3 | 0.1 | 58.8 | 96.3 | 84.4 | 60.5 | |
| Model 2d | 0.002 | ||||||||||
| Early stage (I + II) | 0.876 (0.813–0.923) | <0.001 | 76.7 | 80.9 | 6.8 | 0.4 | 79.7 | 93.6 | 80.3 | 47.4 | |
| Late stage (III + IV) | 0.900 (0.843–0.942) | <0.001 | 70.6 | 90.0 | 7.1 | 0.3 | 85.2 | 90.0 | 81.8 | 62.8 |
AUC, area under the curve; CI, confidence interval; LDA, Fisher linear discriminant analysis; LR, logistic regression; +LR, positive likelihood ratio; −LR: negative likelihood ratio; NPV: negative predictive value; PPV, positive predictive value; Se, sensitivity; Sp, specificity; TAA, tumor-associated antigen.
P values mean comparison between early stage and late stage with the method of De Long et al. (1989).
P values are relative to normal controls.
The LDA model with 5 anti-TAAs (TP53, SMARCB1, COPB1, SRSF2, and GNAS) entering the model.
The LR model with 5 anti-TAAs (GNAS, PBRM1, TP53, COPB1, and ACVR1B) entering the model.
Detecting anti-TAA autoantibody levels in serial sera before and after cancer resection
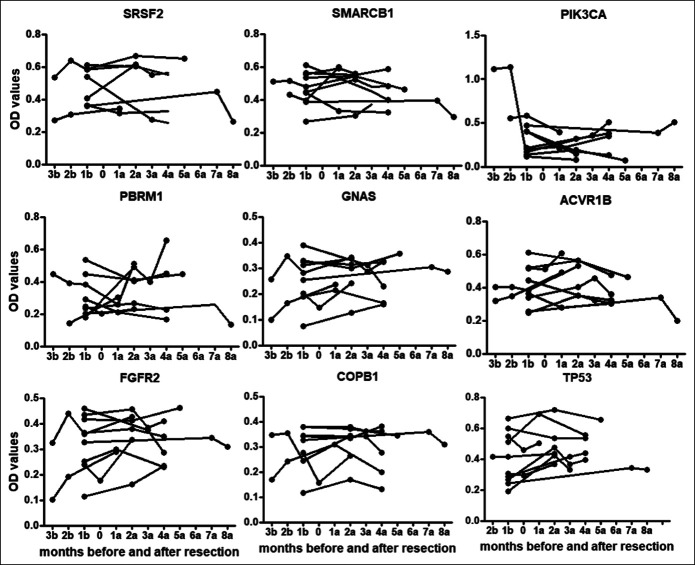
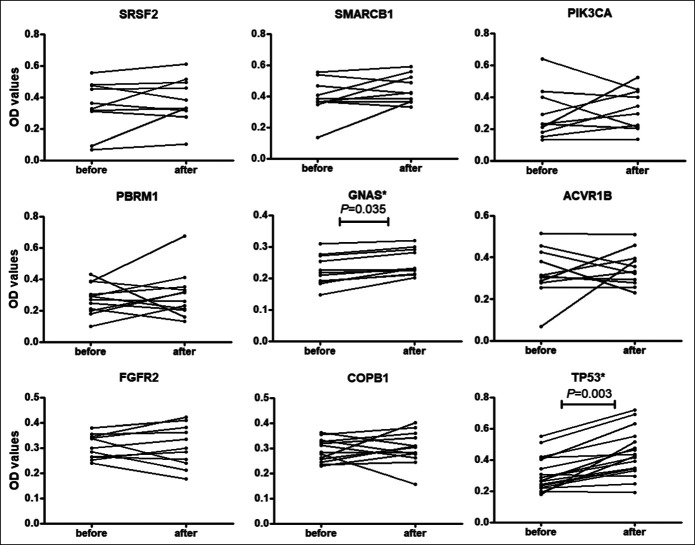
Twenty-three patients with GAC without metastasis were followed up for 10 months. In total, 64 serial serum samples were collected before and after surgery and/or chemotherapy in different time points to study the changing of these autoantibodies. Figure 6 showed the changes of 8 autoantibodies in 9 patients with GAC who had donated more than 2 sera. Figure 7 showed the levels of 2 autoantibodies, including TP53 and GNAS, were significantly higher after cancer resection in patients with GAC by the paired Wilcoxon test (P < 0.05). The autoantibodies against ACVR1B, COPB1, FGFR2, PBRM1, SMARCB1, and SRSF2 did not show significant increase after cancer resection in 1 month (P > 0.05).
Figure 6.
Levels of autoantibodies against 9 tumor-associated antigens in serial serum samples before and after cancer resection. 1a: 1 month after cancer resection. 1b: 1 month before cancer resection.
Figure 7.
Comparison of autoantibody serum levels to 9 tumor-associated antigens in serum samples before and after resection for patients with gastric carcinoma in 2 weeks. P value was calculated by the paired Wilcoxon test. *P<0.05
DISCUSSION
This study has several novel features. We have discovered and validated 2 anti-TAA autoantibody panels by 2 different experimental methods for the detection of GAC in 3 independent cohorts. This design displayed several strengths. First, the design of our study showed a new clue for identifying new serum anti-TAA autoantibodies which meant screening TAAs with focused protein microarrays based on cancer driver genes and validating autoantibodies against selected TAAs by ELISA. On one hand, this study made use of the highly effective method, human protein microarrays, for discovering the new biomarkers in a short time in the current study. On the other hand, ELISA, as one of the preferred methods, was used to validate the discovered biomarkers in the training and validation cohorts. Besides, previous studies usually screened small number of TAAs in small sample size or without external validation cohort or with only 1 model establishment (21,22). But, this study identified robust GAC biomarkers with a large sample size that included 3 different samples cohorts (431 patients with GAC at different clinical stages and 381 cancer-free NC) and attained 2 combination panels of autoantibodies which can significantly discriminate GAC from normal individuals whether in early stage or late stage for GAC.
In phase I, this design allowed us to rapidly discover 10 potential TAAs as GAC biomarkers from 154 proteins by the focused protein microarrays in a short time, namely GNA11, GNAS, FGFR2, PBRM1, TP53, PIK3CA, COPB1, SRSF2, ACVR1B, and SETBP1. The function and detailed description of the proteins encoded by cancer driver genes are summarized by Vogelstein et al. (16). Some studies showed that the TAAs were the products of the genetic mutation and the corresponding autoantibodies were the potential biomarkers for early cancer detection (23). For example, serum TP53 autoantibody was extensively evaluated as a potential diagnostic biomarker for early-stage GC (22), lung cancer (24), and many other cancers (25–27). GNA11, as 1 member of G proteins, was found to be modulators in various signaling pathways, indicating that GNA11 may be also used as a biomarker of cancers (28). Up to now, GNA11 autoantibody has not been reported as a diagnostic and prognostic biomarker. Our current study may be the first study to report that GNA11 autoantibody may be a biomarker for the detection of GAC. SRSF2 is necessary for the splicing of pre-mRNA and participates in the cellular apoptosis as one of the oncogenes (29,30). It was reported that GNAS was an oncogene and participated in several pathways, such as APC and PI3K (31). FGFR2 may involve in many signaling pathways, such as MAPK1/ERK2 and MAPK3/ERK1 (32). A multicultural South African cohort study on serological biomarkers showed that FGFR2 protein could be the antigen biomarker of cancer survival (33). In addition, FGFR2 single-chain variable antibody fragment may be a potential molecular treatment for gastrointestinal cancers (34). The alterations of PBRM1, a negative regulator of cell proliferation, were likely to be a biomarker of renal cell carcinoma (35,36). PIK3CA was one of the oncogenes regulating the AKT1 pathway and was reported to be associated with many types of tumorigenesis (37), but no difference of the anti-PIK3CA level between GAC and group was found. Moreover, this study may be the first report that autoantibodies to GNAS, PBRM1, COPB1, SRSF2, ACVR1B, and SETBP1 can be used as diagnostic biomarkers for GAC. Although the specific mechanism is not completely clear, it implies that these TAAs may be associated with carcinogenesis.
For the construction of the immunodiagnostic models in our study, 10 potential biomarkers were screened from 154 candidate proteins by the focused protein microarrays in the discovery cohort. The AUCs and positive rates were mainly used to select the optimally potential candidate biomarkers. Then, we validated the selected candidate predictors by ELISA with statistical analysis of ROC, LR, and LDA model method. These methods not only provide the method of exploring the single autoantibody based on the results of ELISA but also enable us to select the optimal panels of the autoantibodies and establish the immunological models for predicting the probability for diagnosing GAC. Besides, to control the selection bias, the autoantibodies were detected in different cohorts. Among the final selected 9 anti-TAA autoantibodies for ELISA, 8 anti-TAAs (GNA11, GNAS, FGFR2, PBRM1, TP53, COPB1, SRSF2, and ACVR1B) were significantly increased in GAC cohorts compared with NC cohorts in both training and validation cohorts. However, the sensitivity and specificity of single anti-TAA in patients with cancer were low to serve as the independent diagnostic biomarker in terms of the diagnostic ability. Integrating multiple autoantibodies into 1 model would substantially improve diagnostic ability compared with only 1 autoantibody (12,38). In this study, compared with 1 single autoantibody, the combined panel (GNAS, PBRM1, TP53, COPB1, and ACVR1B) selected by the LR model and the combined panel (TP53, SMARCB1, COPB1, SRSF2, and GNAS) selected by the LDA model showed a higher AUC, sensitivity, and specificity. This phenomenon was found in many other studies, such as the autoantibody biomarkers and miRNA biomarkers for the detection of cancers (13,39).
To further explore and compare the diagnostic performance of the 2 immunodiagnostic models in different clinical stages for GAC, the GAC patients of the training cohort and the validation cohort were divided into the early (stage I and II) and late (III and IV) stage. Both of the 2 immunodiagnostic models showed a good performance for the detection of GAC that the accuracy was higher than 80.0% and the kappa value was higher than 0.4 in both training and validation cohorts in early stage (stage I and II). In addition, the diagnostic value of the LDA model was higher than that in the LR model, indicating that different models should be established for exploring a better model rather than establishing only 1 model by comparing the diagnostic ability in different immunodiagnostic models.
The autoantibody panels for the diagnosis of GAC identified in this study showed a better performance than those in the previous studies (38,40). Besides, the biological function of the proteins encoded by cancer driver genes had been reported in a previous study (16). Specific anti-TAA autoantibodies are usually not only associated with the detection of cancers, but also have some sensitivity in the prognosis of tumor patients. One study showed that patients with GC had a worse prognosis if they were positive for more than 2 antibodies in the panel of TP53, heat shock protein 70, p90, HCC-22-5, KM-HN-1, and peroxiredoxin VI (38). Another study showed that high levels of antibodies against TRP1/TYRP1, TRP2/TYRP2, gp100, and Melan/MART1 may be useful metastatic biomarkers for melanoma (41). Therefore, the serial serum samples from 23 patients with GAC were detected to investigate the temporal changes of these autoantibodies in this study. Some patients showed an increase in antibody levels after resection, and this may imply that the individuals may have a poor prognosis (17). At the same time, our results showed that anti-TP53 and anti-GNAS antibody significantly increased in GC sera after cancer resection, which was similar to a previous study (42). The specific mechanism of the increasing antibody trend in sera after resection is not completely known. A few studies also showed the similar results (17,42).
However, there are some limitations that can not be ignored. First, the novel autoantibodies in this study have not been explored in other tumors; therefore, the specificity for these biomarkers remained to be further verified in other tumors, and more studies should be further explored. Besides, only a few early-stage cancers in this study were evaluated to confirm the usefulness of the panels because it was difficult for us to collect enough serum samples for stage I GC owing to no effective early diagnostic test for GC. Thus, more serum samples of stage I of GC are required to evaluate the diagnostic value of the panels in this study. Finally, more detailed histopathological features, such as the intestinal type or diffuse type, may be preferred for the further application of the autoantibodies identified in this study.
In summary, the findings in our study has demonstrated that 2 selected panels of serum anti-TAA autoantibodies based on the immunodiagnostic models may be effective biomarkers for the detection of GAC. Besides, this study has also provided a new design modality for identifying biomarkers based on protein microarrays with a large cohort of subjects. Thus, this study maybe the first time to offer 2 potential immunodiagnostic models for the detection of GAC.
CONFLICTS OF INTEREST
Guarantors of the article: Jianying Zhang, MD, PhD, and Peng Wang, MD, PhD.
Specific author contributions: Qian Yang, MD, and Jiejie Qin, MD, PhD, contributed equally to this work. J.Z. and P.W.: designing this study and supervision of research team. Q.Y., J.Q., G.S., D.J., and C.Q.: collecting the sera and conducted all experiments. H.Y. and X.W.: collecting patients' clinical information. L.D., J.Z., Q.Y., and J.Q.: analyzed the data. Q.Y. and J.Q.: drafting manuscript. All authors were involved in the revision of the manuscript. All authors have approved the final version of the manuscript.
Financial support: This study was supported by the Major Project of Science and Technology in Henan Province (161100311400), the National Science and Technology Major Project of China (2018ZX10302205), Zhengzhou Major Project for Collaborative Innovation (18XTZX12007). All authors declare that there is no conflict in this study.
Potential competing interests: None to report.
Study Highlights.
WHAT IS KNOWN
✓ The prognosis of gastric adenocarcinoma (GAC) is poor.
✓ The reliable noninvasive screening tests for early detection of gastric cancer remain to be needed.
WHAT IS NEW HERE
✓ Specific autoantibody panels were identified through focused protein microarrays of cancer driver genes and incorporated into panels.
✓ The performance of anti–tumor-associated antigen autoantibodies for the detection of GAC was evaluated in different cohorts.
TRANSLATIONAL IMPACT
✓ The 2 selected panels in this study may provide clues for the early detection of GAC.
Supplementary Material
Footnotes
SUPPLEMENTARY MATERIAL accompanies this paper at http://links.lww.com/CTG/A471
References
- 1.Bray F, Ferlay J, Soerjomataram I, et al. Global cancer statistics 2018: GLOBOCAN estimates of incidence and mortality worldwide for 36 cancers in 185 countries. CA Cancer J Clin 2018;68(6):394–424. [DOI] [PubMed] [Google Scholar]
- 2.Lauren P. The two histological main types of gastric carcinoma: Diffuse and so-called intestinal-type carcinoma. An attempt at a histo-clinical classification. Acta Pathol Microbiol Scand 1965;64:31–49. [DOI] [PubMed] [Google Scholar]
- 3.Zeng H, Chen W, Zheng R, et al. Changing cancer survival in China during 2003–15: A pooled analysis of 17 population-based cancer registries. Lancet Glob Health 2018;6(5):e555–e567. [DOI] [PubMed] [Google Scholar]
- 4.Strong VE, Wu AW, Selby LV, et al. Differences in gastric cancer survival between the U.S. and China. J Surg Oncol 2015;112(1):31–7. [DOI] [PMC free article] [PubMed] [Google Scholar]
- 5.Zong L, Abe M, Seto Y, et al. The challenge of screening for early gastric cancer in China. Lancet 2016;388(10060):2606. [DOI] [PubMed] [Google Scholar]
- 6.Shimada H, Noie T, Ohashi M, et al. Clinical significance of serum tumor markers for gastric cancer: A systematic review of literature by the Task Force of the Japanese Gastric Cancer Association. Gastric Cancer 2014;17(1):26–33. [DOI] [PubMed] [Google Scholar]
- 7.Perez-Mendoza A, Zarate-Guzman AM, Galvis GE, et al. Systematic alphanumeric-coded endoscopy versus chromoendoscopy for the detection of precancerous gastric lesions and early gastric cancer in subjects at average risk for gastric cancer. Rev Gastroenterol Mex 2018;83(2):117–24. [DOI] [PubMed] [Google Scholar]
- 8.Garaud S, Zayakin P, Buisseret L, et al. Antigen specificity and clinical significance of IgG and IgA autoantibodies produced in situ by tumor-infiltrating B cells in breast cancer. Front Immunol 2018;9:2660. [DOI] [PMC free article] [PubMed] [Google Scholar]
- 9.Hwang HM, Heo CK, Lee HJ, et al. Identification of anti-SF3B1 autoantibody as a diagnostic marker in patients with hepatocellular carcinoma. J Transl Med 2018;16(1):177. [DOI] [PMC free article] [PubMed] [Google Scholar]
- 10.Zhang JY, Tan EM. Autoantibodies to tumor-associated antigens as diagnostic biomarkers in hepatocellular carcinoma and other solid tumors. Expert Rev Mol Diagn 2010;10(3):321–8. [DOI] [PMC free article] [PubMed] [Google Scholar]
- 11.Tan EM, Zhang J. Autoantibodies to tumor-associated antigens: Reporters from the immune system. Immunol Rev 2008;222:328–40. [DOI] [PMC free article] [PubMed] [Google Scholar]
- 12.Wu J, Li X, Song W, et al. The roles and applications of autoantibodies in progression, diagnosis, treatment and prognosis of human malignant tumours. Autoimmun Rev 2017;16(12):1270–81. [DOI] [PubMed] [Google Scholar]
- 13.Wang S, Qin J, Ye H, et al. Using a panel of multiple tumor-associated antigens to enhance autoantibody detection for immunodiagnosis of gastric cancer. Oncoimmunology 2018;7(8):e1452582. [DOI] [PMC free article] [PubMed] [Google Scholar]
- 14.Cheng WC, Chung IF, Chen CY, et al. DriverDB: An exome sequencing database for cancer driver gene identification. Nucleic Acids Res 2014;42(Database issue):D1048–54. [DOI] [PMC free article] [PubMed] [Google Scholar]
- 15.Martinez-Jimenez F, Muinos F, Sentis I, et al. A compendium of mutational cancer driver genes. Nat Rev Cancer 2020;20(10):555–72. [DOI] [PubMed] [Google Scholar]
- 16.Vogelstein B, Papadopoulos N, Velculescu VE, et al. Cancer genome landscapes. Science 2013;339(6127):1546–58. [DOI] [PMC free article] [PubMed] [Google Scholar]
- 17.Qin J, Wang S, Shi J, et al. Using recursive partitioning approach to select tumor-associated antigens in immunodiagnosis of gastric adenocarcinoma. Cancer Sci 2019;110(6):1829–41. [DOI] [PMC free article] [PubMed] [Google Scholar]
- 18.Qiu C, Wang P, Wang B, et al. Establishment and validation of an immunodiagnostic model for prediction of breast cancer. Oncoimmunology 2020;9(1):1682382. [DOI] [PMC free article] [PubMed] [Google Scholar]
- 19.Wang K, Li M, Qin J, et al. Serological biomarkers for early detection of hepatocellular carcinoma: A focus on autoantibodies against tumor-associated antigens encoded by cancer driver genes. Cancers (Basel) 2020;12(5):1271. [DOI] [PMC free article] [PubMed] [Google Scholar]
- 20.Dai L, Tsay JC, Li J, et al. Autoantibodies against tumor-associated antigens in the early detection of lung cancer. Lung Cancer 2016;99:172–9. [DOI] [PubMed] [Google Scholar]
- 21.Werner S, Chen H, Butt J, et al. Evaluation of the diagnostic value of 64 simultaneously measured autoantibodies for early detection of gastric cancer. Sci Rep 2016;6:25467. [DOI] [PMC free article] [PubMed] [Google Scholar]
- 22.Kunizaki M, Fukuda A, Wakata K, et al. Clinical significance of serum p53 antibody in the early detection and poor prognosis of gastric cancer. Anticancer Res 2017;37(4):1979–84. [DOI] [PubMed] [Google Scholar]
- 23.Macdonald IK, Parsy-Kowalska CB, Chapman CJ. Autoantibodies: Opportunities for early cancer detection. Trends Cancer 2017;3(3):198–213. [DOI] [PubMed] [Google Scholar]
- 24.Liu WF. Acute effects of oral low doses of pyridostigmine on simple visual discrimination and unconditioned consummatory acts in rats. Pharmacol Biochem Behav 1992;41(1):251–4. [DOI] [PubMed] [Google Scholar]
- 25.Liu Y, Liao Y, Xiang L, et al. A panel of autoantibodies as potential early diagnostic serum biomarkers in patients with breast cancer. Int J Clin Oncol 2017;22(2):291–6. [DOI] [PubMed] [Google Scholar]
- 26.Kamisawa T, Wood LD, Itoi T, et al. Pancreatic cancer. Lancet 2016;388(10039):73–85. [DOI] [PubMed] [Google Scholar]
- 27.Yang WL, Gentry-Maharaj A, Simmons A, et al. Elevation of TP53 autoantibody before CA125 in preclinical invasive epithelial ovarian cancer. Clin Cancer Res 2017;23(19):5912–22. [DOI] [PMC free article] [PubMed] [Google Scholar]
- 28.Parish AJ, Nguyen V, Goodman AM, et al. GNAS, GNAQ, and GNA11 alterations in patients with diverse cancers. Cancer 2018;124(20):4080–9. [DOI] [PMC free article] [PubMed] [Google Scholar]
- 29.Comiskey DJ, Montes M, Khurshid S, et al. SRSF2 regulation of MDM2 reveals splicing as a therapeutic vulnerability of the p53 pathway. Mol Cancer Res 2019;18(2):194–203. [DOI] [PubMed] [Google Scholar]
- 30.van Poppelen NM, Drabarek W, Smit KN, et al. SRSF2 mutations in uveal melanoma: A preference for in-frame deletions? Cancers (Basel) 2019;11(8):1200. [DOI] [PMC free article] [PubMed] [Google Scholar]
- 31.Volckmar AL, Leichsenring J, Flechtenmacher C, et al. Tubular, lactating, and ductal adenomas are devoid of MED12 Exon2 mutations, and ductal adenomas show recurrent mutations in GNAS and the PI3K-AKT pathway. Genes Chromosomes Cancer 2017;56(1):11–7. [DOI] [PubMed] [Google Scholar]
- 32.Huang T, Liu D, Wang Y, et al. FGFR2 promotes gastric cancer progression by inhibiting the expression of thrombospondin4 via PI3K-Akt-Mtor pathway. Cell Physiol Biochem 2018;50(4):1332–45. [DOI] [PubMed] [Google Scholar]
- 33.Ahn S, Lee J, Hong M, et al. FGFR2 in gastric cancer: Protein overexpression predicts gene amplification and high H-index predicts poor survival. Mod Pathol 2016;29(9):1095–103. [DOI] [PubMed] [Google Scholar]
- 34.Borek A, Sokolowska-Wedzina A, Chodaczek G, et al. Generation of high-affinity, internalizing anti-FGFR2 single-chain variable antibody fragment fused with Fc for targeting gastrointestinal cancers. PLoS One 2018;13(2):e0192194. [DOI] [PMC free article] [PubMed] [Google Scholar]
- 35.Braun DA, Ishii Y, Walsh AM, et al. Clinical validation of PBRM1 alterations as a marker of immune checkpoint inhibitor response in renal cell carcinoma. JAMA Oncol 2019;5(11):1631–3. [DOI] [PMC free article] [PubMed] [Google Scholar]
- 36.Piva F, Santoni M, Matrana MR, et al. BAP1, PBRM1 and SETD2 in clear-cell renal cell carcinoma: Molecular diagnostics and possible targets for personalized therapies. Expert Rev Mol Diagn 2015;15(9):1201–10. [DOI] [PubMed] [Google Scholar]
- 37.Jiang W, Wu Y, He T, et al. Targeting of beta-catenin reverses radioresistance of cervical cancer with the PIK3CA E545K mutation. Mol Cancer Ther 2020;19(2):337–47. [DOI] [PubMed] [Google Scholar]
- 38.Hoshino I, Nagata M, Takiguchi N, et al. Panel of autoantibodies against multiple tumor-associated antigens for detecting gastric cancer. Cancer Sci 2017;108(3):308–15. [DOI] [PMC free article] [PubMed] [Google Scholar]
- 39.Zhang JX, Song W, Chen ZH, et al. Prognostic and predictive value of a microRNA signature in stage II colon cancer: A microRNA expression analysis. Lancet Oncol 2013;14(13):1295–306. [DOI] [PubMed] [Google Scholar]
- 40.Werner S, Chen H, Tao S, et al. Systematic review: Serum autoantibodies in the early detection of gastric cancer. Int J Cancer 2015;136(10):2243–52. [DOI] [PubMed] [Google Scholar]
- 41.Fassler M, Diem S, Mangana J, et al. Antibodies as biomarker candidates for response and survival to checkpoint inhibitors in melanoma patients. J Immunother Cancer 2019;7(1):50. [DOI] [PMC free article] [PubMed] [Google Scholar]
- 42.Dai L, Li J, Xing M, et al. Using serological proteome analysis to identify serum anti-nucleophosmin 1 autoantibody as a potential biomarker in European-American and African-American patients with prostate cancer. Prostate 2016;76(15):1375–86. [DOI] [PubMed] [Google Scholar]
Associated Data
This section collects any data citations, data availability statements, or supplementary materials included in this article.


