

Abstract
Rationale and Objectives:
Adiposity and physical fitness levels are major drivers of cardiometabolic risk, but these relationships have not been well-characterized in chronic kidney disease (CKD). We examined the associations of visceral adipose tissue (VAT), subcutaneous adipose tissue (SAT), intrahepatic fat and physical function with inflammation, insulin resistance, and adipokines in patients with CKD.
Study Design:
Prospective cohort study
Setting and Participants:
Participants with Stage 3–5 CKD not receiving chronic dialysis, followed at one of 8 clinical sites in the Chronic Renal Insufficiency Cohort study, and who underwent MRI of the abdomen at an annual CRIC Study visit (n=419)
Predictors:
VAT volume, SAT volume, intrahepatic fat, body mass index (BMI), waist circumference (WC), and time taken to complete the 400 m walk test (physical function)
Outcomes:
Markers of inflammation (IL1-beta, IL-6, TNF-R1, and TNF-R2), insulin resistance (HOMA-IR), and adipokines (adiponectin- total and high molecular weight [HMW], resistin, and leptin).
Analytical Approach:
Multivariable linear regression of VAT and SAT volume, intrahepatic fat and physical function, with individual markers (log-transformed values) adjusting for relevant covariates
Results:
Mean age of the study population was 64.3 years; 41% were females, and the mean eGFR was 53.2 (+/− 14.6) ml/min/1.73 m2. Over 85% were overweight or obese, and 40% had diabetes. Higher VAT volume, SAT volume, and liver proton density fat fraction, were associated with lower levels of total and HMW adiponectin, higher levels of leptin and insulin resistance, lower HDL cholesterol and higher serum triglycerides. A slower 400m walk time was associated only with higher levels of leptin, total adiponectin, plasma IL-6 and TNFR-1 and did not modify the associations between fat measures and cardiometabolic risk factors.
Limitations:
Lack of longitudinal data and dietary details
Conclusions:
Various measures of adiposity are associated with cardiometabolic risk factors. Physical function was also associated with the cardiometabolic risk factors studied and does not modify the associations between fat measures and cardiometabolic risk factors. Longitudinal studies of the relationship between body fat and aerobic fitness with cardiovascular and kidney disease progression are warranted.
Keywords: Obesity, fat, physical function, kidney disease, cardiometabolic risk factor
Introduction
In the general population, regional fat distribution rather than overall obesity is recognized as a key factor in the link between obesity and cardiovascular disease1. Central abdominal obesity is a better predictor of cardiovascular disease than overall obesity as assessed by body mass index (BMI). Importantly, various abdominal fat compartments and distributions have different associations with cardiometabolic risk factors in those without kidney disease2–7. However, such relationship in the setting of CKD have not been explored previously. Experimental studies have explored multiple mechanisms underlying the development and progression of kidney disease in the setting of obesity8. In both overweight and obesity, increases in renal plasma flow and glomerular hyperfiltration leading to an increased interglomerular pressure are noted. . Furthermore, through the renin-angiotensin-aldosterone system, adipose tissue also contributes to glomerular arteriolar modulation with changes in intraglomerular pressure and filtration fraction9.
Pro-inflammatory adipokines including adiponectin have been linked to increased urinary protein excretion and cardiovascular disease in patients with obesity10. Leptin, a 16-kDa peptide plays a key role in food intake and energy expenditure and may contribute to the progression of kidney disease secondary to the proliferation of endothelial cells and mesangial cell hypertrophy11. Data indicate that there may be a differential relationship between visceral and subcutaneous fat and inflammatory adipokines in the general population but whether these associations are similar among those with CKD is unknown. In addition, we know relatively little about the role of physical fitness and cardiovascular risk in CKD. In diabetic and non-diabetic populations (with preserved kidney function), higher physical fitness levels (independently) among those with higher BMI are associated with a lower prevalence of cardiovascular risk factors and mortality compared to those with normal BMI and lower fitness level12–14. Indeed, fitness and adiposity may have independent or synergistic relationships with mechanistic pathways for adverse outcomes, individual cardiometabolic risk factors, and clinical outcomes in CKD. Therefore, we examined the associations of visceral adipose tissue (VAT)/subcutaneous adipose tissue (SAT) (assessed using MRI), other obesity measures, and physical function (measured using 400 m walk test, a surrogate measure of physical fitness) with inflammation, insulin resistance, adipokines and lipid parameters among individuals with CKD participating in the Chronic Renal Insufficiency Cohort (CRIC) Study.
Methods
CRIC study
In the first phase of the CRIC study (2003–2008)-an ongoing multicenter observational cohort study, 3939 adults aged 21–74 years with an eGFR of 20–70 ml/min/1.73 m2 were recruited from 13 discrete clinical research sites. Later in 2013 (phase 3), an additional 1560 individuals with mild-moderate CKD were recruited and are also currently being followed. Details of the CRIC study have been published previously15.
CRIC VAP study
We enrolled 449 patients for the CRIC Visceral Adiposity and Physical function (CRIC VAP) study from 8 clinical sites, as an ancillary to the parent CRIC study. CRIC participants aged 21–79 years with an eGFR 25–74 ml/min/1.73 m2 who were enrolled in Phases 1 and 3 of CRIC were eligible for inclusion. Participants who were on dialysis or had received a kidney transplant, had severe osteoarthritis or peripheral vascular disease precluding participation in a 400 m walk test and/or could not undergo an MRI exam (with metallic implants, pacemaker, claustrophobia, etc.) were excluded. All eligible participants who participated in a 400 m walk test to assess physical functional status and had an MRI to quantify visceral, subcutaneous and intrahepatic fat content. The study protocol was approved by the Institutional Review Board at each of the participating sites. All study participants were consented at their primary sites prior to enrollment.
Covariates
Age, sex, race, smoking, alcohol intake details, comorbid conditions and medication use were obtained at routine study visits. BMI was calculated as weight in kilograms divided by height in meters squared, and waist circumference was measured at the uppermost lateral border of the iliac crest with a Gulick II tape measure.
400 m walk test
A 400 m walk test was administered during routine CRIC study visits to assess physical function and as an indicator of aerobic capacity16,17. The test was administered in an open corridor of the clinical unit with two cones spaced 20 m apart. Participants walked 10 laps around the cones for a total of 400 m and were given standard encouragement at each lap. Heart rate was recorded for each lap, and blood pressure was measured at the end of the test. Completion time for the 400 m walk was recorded in seconds. If the participant felt a need to stop and rest, they were allowed to stand in one place and rest. Participants could not lean against a wall, table or elsewhere. Stopping criteria for the test included: (1) if the participant reported chest pain, tightness or pressure in the chest, shortness of breath, feeling faint, lightheaded or dizzy, or severe leg pain, or (2) test duration over 15 minutes.
MRI imaging
Visceral and subcutaneous adipose tissue volume were assessed by magnetic resonance imaging using a standardized protocol. Images of the abdominal cavity were obtained using a Siemens, GE or Philips MR system based on availability at the participating sites. The quantitative 6-point Dixon proton density fat fraction (PDFF) measurement consisted of multiple 3D axial acquisitions spanning the dome of the liver to the symphysis pubis using 5mm slices. Typically, three breath-hold 3D slabs (obtained at end expiration) were needed to cover this distance, with a minimum of 2 slabs and a maximum of 4 slabs used. Images were reconstructed, combined, and post-processed automatically using the FDA approved commercial PDFF software for each MR system. VAT and SAT volume were quantified using an automated algorithm described in more detail by Addeman et al18, with a trained observer correcting errors when applicable. The automated segmentation algorithm applies a three-stage process to identity and segment VAT and SAT using fat, water, and PDFF images collected with 6-point Dixon MR technique. Using the combined fat and water image series, the dataset is pre-processed to identify the torso volume from background noise using adaptive k-means clustering. Adipose tissue was then identified by applying the torso volume to the PDFF image and filtering for PDFF values above 70% followed by a region growing algorithm to identify connected partial-volume adipose tissue above 50% PDFF. Finally, SAT and VAT were separated by fitting a 3D surface to the muscles that are proximal to the subcutaneous adipose. Intrahepatic fat content (% PDFF) was obtained by a trained observer placing a circular region-of-interest on a single slice in the PDFF image series and documenting the average PDFF value within the region of interest. A healthy volunteer scan was obtained prior to the study initiation to implement corrective measures to ensure consistency/accuracy of the protocol at each site.
Metabolic Assessments
Blood samples were obtained to determine fasting glucose, insulin, leptin, resistin, total/high molecular weight adiponectin, IL-6, IL-1 beta, TNFR1, and TNFR2 concentrations. Plasma insulin was determined via radioimmunoassay (EMD Millipore, Billerica, MA, USA) and insulin resistance was determined using the homeostasis model assessment of insulin resistance (HOMA-IR)19. IL-6, IL-1 beta, TNFR1, TNFR2, resistin, leptin, total and high molecular weight adiponectin were analyzed via ELISA (R&D systems, Minneapolis, MN, USA). All samples were stored at −80°C, and assays were performed at the time of initial thawing. All assays were performed in duplicate, and mean values were used in the analysis.
Statistical analysis
Clinical and demographic characteristics of the study cohort were tabulated (Table 1). Continuous (biomarkers) variables were checked for skewness and log transformed if they were not normally distributed. We examined SAT and VAT volume within various categories of BMI (18.5–24.99, 25–29.9, and >30) and WC (high or normal: < 88cm in women and <102 cm in men) using Kruskal-Wallis tests. The associations between SAT and VAT and categories of both BMI and WC were examined separately for men and women using the Kruskal-Wallis test. Boxplots were created for SAT and VAT based on stages of kidney disease (stage 3a, 3b and 4) and based on time to complete the 400 m test by quartiles of SAT and VAT. Spearman correlations of VAT, SAT, liver PDFF, BMI, WC and 400 m walk time were performed with each of the cardiometabolic risk factors.
Table 1.
Baseline characteristics of study population
| Factor | Total (N=419) |
|---|---|
| Age (years) | 64.3±8.5 |
| Female, N (%) | 170(40.6) |
| Race, N (%) | 182(43.4) |
| Non-Hispanic Black | 199(47.5) |
| Hispanic | 28(6.7) |
| Other | 10(2.4) |
| Education category, N (%) | |
| Less than high school | 48(11.5) |
| High school graduate | 72(17.2) |
| Some college | 109(26.0) |
| College graduate or higher | 190(45.3) |
| BMI (kg/m2), N (%) | |
| 18.5–24.9 | 61(14.6) |
| 25–29.9 | 150(35.9) |
| 30–39.9 | 179(42.8) |
| >40 | 28(6.7) |
| Weight (kg) | 89.2±18.7 |
| Waist Circumference (cm) | 104.6±14.6 |
| Systolic BP (mmHg)* | 126.7±18.6 |
| Diastolic BP (mmHg)* | 69.7±12.0 |
| eGFR (ml/min/1.73 m2)* | 53.2±14.6 |
| CKD stage (ml/min/1.73 m2, %), N (%) | |
| ≥90 | 4(0.96) |
| 60 – <90 | 125(30.0) |
| 45 – <60 | 174(41.7) |
| 30 – <45 | 93(22.3) |
| 15 – <30 | 19(4.6) |
| <15 | 2(0.48) |
| Urine Protein/Creatinine Ratio (g/g) | 0.17[0.07,0.59] |
| Hemoglobin A1C (%) | 6.5±1.4 |
| Chronic medical conditions, N (%) | |
| Atrial fibrillation/other arrhythmia | 64(15.3) |
| Cardiovascular disease | 98(23.4) |
| Congestive heart failure | 20(4.8) |
| Peripheral vascular disease | 16(3.8) |
| CVA | 38(9.1) |
| Chronic Obstructive Pulmonary Disease | 48(11.6) |
| Diabetes | 166(39.6) |
| Family History of CAD | 19(4.5) |
| Hyperlipidemia | 345(82.3) |
| Hypertension | 393(93.8) |
| Smoking (both previous and current) | 190(45.3) |
| Alcohol Use | 266(64.1) |
| Use of ACE Inhibitors or ARBs (%) | 278(66.3) |
| Lipid-lowering drug use (%) | 264(63.0) |
| Glucose (mg/dl) | 118.0±45.7 |
| Total cholesterol (mg/dl) | 178.0[147.5,208.5] |
| LDL cholesterol (mg/dl) | 101.0[77.0,130.0] |
| HDL cholesterol (mg/dl) | 44.0[36.0,55.0] |
| Triglycerides (mg/dl) | 125.0[89.0,179.0] |
| Adipokines, inflammatory markers | |
| Total adiponectin ng/ml | 6840[4247,12429] |
| HMW adiponectin ng/ml | 3795[2147,6455] |
| Leptin pg/ml | 29363[13252,59090] |
| Resistin ng/ml | 13.0[9.4,18.4] |
| TNFR1 pg/ml | 2429[1888,3308] |
| TNFR2 pg/ml | 4086[3147,5607] |
| IL1 beta pg/ml | 0.00[0.00,0.21] |
| IL-6 pg/ml | 2.4[1.6,3.9] |
| MRI data | |
| Visceral adipose tissue volume, L | 5.99[3.98,8.76] |
| Subcutaneous adipose tissue volume, L | 9.40[6.05,13.71] |
| Intrahepatic fat (PDFF %) | 4.3(2.7, 7.4) |
| 400 m walk time (seconds) | 384 [334, 441] |
Data not available for all subjects. Missing values: Body Mass Index (kg/m) = 1, Diastolic BP (mmHg) = 5, eGFR - CKD EPI Equation (ml/min/1.73m) = 2, Glucose (mg/dL) = 2, Height (cm) = 1, Urine Protein/Creatinine Ratio from spot sample = 26, Serum Albumin (g/dL) = 2, Systolic BP (mmHg) = 4, 24H Urine Protein (g/24H) = 303, History of Chronic Obstructive Pulmonary Disease (emphysema) = 6, Statistics presented as Mean ± SD, Median [P25, P75], or column %.
A separate multivariable regression model was constructed for each SD increase in VAT, SAT, intrahepatic fat (liver PDFF), and 400 m walk time as the independent variable and each of the cardiometabolic risk factors as the dependent variable. Cardiometabolic markers were log transformed except for LDL-cholesterol. We did not fit regression models for IL-1 beta as more than half of participants had undetectable levels. We adjusted each model for age, sex, race, diabetes, hypertension, hypercholesterolemia (except for outcomes- HDL, LDL and triglycerides), cardiovascular disease, eGFR and proteinuria. Regression models for 400 m walk test were also adjusted for BMI. Due to co-linearity between BMI and VAT/SAT/intrahepatic fat, we did not adjust for BMI in the multivariable models of VAT/SAT. We also examined VAT/SAT as categorical variables (as quartiles) and studied their relationship with the same cardiometabolic factors. We evaluated 2-way interactions between predictors that were statistically significant in the primary models and sex, and diabetes. We also evaluated the previously mentioned SAT and VAT models including an interaction with physical activity. Covariate data were missing for: BMI (n=1), eGFR (n=2), and urine protein:creatinine ratio (n=26). We used multiple imputation (SAS proc MI) with the Markov Chain Monte Carlo method and a single chain to impute 5 datasets with complete covariate data. All regression models were performed on each of the 5 imputed datasets and parameter estimates were combined with SAS MI analyze.
All statistical analyses were conducted with Linux SAS version 9.4 (SAS Institute, Cary, NC) and graphs were created using R 3.5.1 (The R Foundation for Statistical Computing, Vienna, Austria). A 2-sided p-value of 0.05 was used to determine statistical significance.
Results
Baseline characteristics
Of the 449 participants consented, 432 completed the 400 m walk test; 419 completed the MRI scan, and 409 subjects completed both the walk test and MRI assessment. The 419 participants who completed the MRI exam are included in this study (Figure S1). Mean age of the study population was 64.3 ± 8.5 years; 41% were female, 47.5% were non-Hispanic blacks. Over 85% of participants were overweight or had obesity (BMI >25 kg/m2), and 40% had diabetes. Mean eGFR was 53.2 ± 14.6 ml/min/1.73 m2 with a mean urine protein excretion of 0.56 g per day. Other baseline characteristics are presented in Table 1. Median (25th–75th percentile) VAT volume was 5993 mL (3987, 8768) mL, SAT volume was 9405 (6057, 13715) mL and intrahepatic fat was 4.3 (2.7, 7.4) %. All participants completed the 400 m walk test and the median (25th-75th percentile) time taken to complete the test was 384 (334,441) seconds. Details of the baseline lipid parameters, adipokines and inflammatory marker are outlined in Table 1. Baseline VAT and SAT levels based on BMI and WC categories and stratified by gender are presented in Table S1.
Correlations between VAT, SAT, Physical function and other adiposity measures
Time taken to complete the 400 m walk test among those with different levels of SAT and VAT are shown in Table S2. Spearman correlations of VAT, SAT, intrahepatic fat, BMI, WC and 400 m walk test time with metabolic risk factors are displayed in Table 2. VAT, SAT and intrahepatic fat were inversely correlated with total and HMW adiponectin. VAT and intrahepatic fat were also inversely correlated with HDL cholesterol. VAT, SAT and liver fat were positively correlated with leptin, HOMA-IR, and triglycerides. Similar correlations were also noted for BMI and WC with the cardiometabolic factors. On the other hand, higher levels of physical function was correlated only with leptin, resistin and inflammatory markers.
Table 2a.
Spearman correlation between cardiometabolic risk factors, VAT, SAT, and intrahepatic fat
| Factor | N | VAT rho (95% CI) | p-value | N | SAT rho (95% CI) | p-value | N | Intrahepatic fat rho (95% CI) | p-value |
|---|---|---|---|---|---|---|---|---|---|
| Total Adiponectin | 402 | −0.39 (−0.47, −0.30) | <0.001 | 402 | −0.20 (−0.29, −0.10) | <0.001 | 402 | −0.41 (−0.49, −0.33) | <0.001 |
| HMW Adiponectin | 402 | −0.40 (−0.48, −0.31) | <0.001 | 402 | −0.19 (−0.28, −0.09) | <0.001 | 402 | −0.44 (−0.52, −0.36) | <0.001 |
| Leptin | 403 | 0.15 (0.05, 0.24) | 0.003 | 403 | 0.66 (0.60, 0.71) | <0.001 | 403 | 0.24 (0.15, 0.33) | <0.001 |
| Resistin | 402 | 0.04 (−0.06, 0.14) | 0.4 | 402 | −0.02 (−0.12, 0.08) | 0.6 | 402 | −0.10 (−0.19, 0.00) | 0.05 |
| HOMA-IR | 373 | 0.27 (0.17, 0.36) | <0.001 | 373 | 0.24 (0.14, 0.33) | <0.001 | 373 | 0.31 (0.22, 0.40) | <0.001 |
| IL1B | 402 | 0.17 (0.07, 0.26) | <0.001 | 402 | 0.17 (0.07, 0.26) | <0.001 | 402 | 0.04 (−0.06, 0.14) | 0.4 |
| IL6 | 403 | 0.07 (−0.03, 0.17) | 0.2 | 403 | 0.15 (0.06, 0.25) | 0.002 | 403 | 0.12 (0.02, 0.21) | 0.020 |
| TNFAR1 | 403 | 0.02 (−0.08, 0.11) | 0.8 | 403 | −0.11 (−0.20, −0.01) | 0.03 | 403 | −0.09 (−0.18, 0.01) | 0.08 |
| TNFAR2 | 402 | −0.03 (−0.12, 0.07) | 0.6 | 402 | −0.08 (−0.18, 0.01) | 0.095 | 402 | −0.03 (−0.13, 0.07) | 0.5 |
| HDL cholesterol | 376 | −0.35 (−0.44, −0.26) | <0.001 | 376 | −0.01 (−0.11, 0.09) | 0.8 | 376 | −0.24 (−0.33, −0.14) | <0.001 |
| LDL cholesterol | 375 | −0.09 (−0.19, 0.01) | 0.07 | 375 | 0.13 (0.03, 0.23) | 0.01 | 375 | −0.06 (−0.16, 0.04) | 0.2 |
| Triglycerides | 375 | 0.34 (0.24, 0.42) | <0.001 | 375 | 0.14 (0.04, 0.24) | 0.006 | 375 | 0.37 (0.28, 0.46) | <0.001 |
Associations of adiposity measures and physical function with cardiometabolic factors
Continuous variables
The results of the multivariable-adjusted linear regression analyses for the association of VAT and SAT volume, intrahepatic fat and physical function with continuous metabolic risk factors are summarized in Table 3. Each SD higher VAT and SAT volume and intrahepatic fat were associated with lower levels of total and HMW adiponectin and HDL cholesterol, and higher levels of leptin, insulin resistance and serum triglyceride levels. Each SD higher 400m walk time was associated only with higher levels of total adiponectin, leptin, plasma IL-6 and TNFR-1.
Table 3.
Multivariable linear regression of adipokines, insulin resistance, inflammatory markers (log-transformed) and lipid profile with VAT, SAT, intrahepatic fat, and physical function
| Outcome | N | Estimate (per 1 SD increase) | StdErr | Probt |
|---|---|---|---|---|
| VAT | ||||
| Total adiponectin | 402 | −0.30 | 0.04 | <0.001 |
| HMW adiponectin | 402 | −0.31 | 0.04 | <0.001 |
| Leptin | 403 | 0.48 | 0.05 | <0.001 |
| Resistin | 402 | 0.05 | 0.03 | 0.09 |
| HOMA | 373 | 0.22 | 0.05 | <0.001 |
| IL6 | 403 | 0.04 | 0.05 | 0.3 |
| TNFAR1 | 403 | −0.00 | 0.01 | 0.9 |
| TNFAR2 | 402 | 0.01 | 0.02 | 0.7 |
| HDL cholesterol | 376 | −0.07 | 0.02 | <0.001 |
| LDL | 375 | 1.3 | 2.3 | 0.5 |
| Triglycerides | 375 | 0.16 | 0.03 | <0.001 |
| SAT | ||||
| Total adiponectin | 402 | −0.21 | 0.04 | <0.001 |
| HMW adiponectin | 402 | −0.22 | 0.04 | <0.001 |
| Leptin | 403 | 0.61 | 0.05 | <0.001 |
| Resistin | 402 | 0.03 | 0.03 | 0.2 |
| HOMA | 373 | 0.17 | 0.05 | <0.001 |
| IL6 | 403 | 0.08 | 0.04 | 0.07 |
| TNFAR1 | 403 | 0.00 | 0.01 | 0.8 |
| TNFAR2 | 402 | −0.00 | 0.02 | 0.9 |
| HDL cholesterol | 376 | −0.05 | 0.02 | 0.007 |
| LDL | 375 | 2.7 | 2.2 | 0.2 |
| Triglycerides | 375 | 0.07 | 0.03 | 0.009 |
| Intrahepatic fat | ||||
| Total adiponectin | 402 | −0.31 | 0.04 | <0.001 |
| HMW adiponectin | 402 | −0.36 | 0.04 | <0.001 |
| Leptin | 403 | 0.35 | 0.05 | <0.001 |
| Resistin | 402 | 0.01 | 0.03 | 0.8 |
| HOMA | 373 | 0.25 | 0.04 | <0.001 |
| IL6 | 403 | 0.11 | 0.04 | 0.007 |
| TNFAR1 | 403 | 0.01 | 0.01 | 0.5 |
| TNFAR2 | 402 | 0.02 | 0.02 | 0.3 |
| HDL cholesterol | 376 | −0.08 | 0.02 | <0.001 |
| LDL | 375 | −2.7 | 2.2 | 0.2 |
| Triglycerides | 375 | 0.19 | 0.02 | <0.001 |
| 400 m walk time | ||||
| Total adiponectin | 392 | 0.09 | 0.05 | 0.05 |
| HMW adiponectin | 392 | 0.05 | 0.05 | 0.3 |
| Leptin | 393 | 0.10 | 0.05 | 0.04 |
| Resistin | 392 | 0.04 | 0.03 | 0.2 |
| HOMA | 363 | −0.06 | 0.05 | 0.2 |
| IL6 | 393 | 0.13 | 0.05 | 0.006 |
| TNFAR1 | 393 | 0.06 | 0.02 | <0.001 |
| TNFAR2 | 392 | 0.01 | 0.02 | 0.7 |
| HDL cholesterol | 366 | −0.03 | 0.02 | 0.2 |
| LDL | 366 | −2.4 | 2.5 | 0.3 |
| Triglycerides | 366 | −0.03 | 0.03 | 0.4 |
Adjusted for age, sex, race, diabetes, hypertension, hypercholesterolemia (except for outcomes HDL, LDL and triglycerides), cardiovascular disease, PVD, eGFR, proteinuria.
Models with walk total seconds are also adjusted for BMI.
Estimates obtained from 5 datasets with imputed covariate values created with multiple imputation and MI analyze.
Categorical variable
The results of the multivariable-adjusted linear regression analyses for the association of VAT, SAT or liver PDFF as categorical variables (quartiles) with metabolic risk factors are summarized in Table S3. These results were qualitatively similar to the results of the continuous analyses.
Effect modifiers
The relationship between VAT and log transformed total adiponectin varied by sex (interaction term p= 0.04) suggesting that while the relationship between VAT and adiponectin was significant for both sexes, it was stronger for women than for men (women estimate per 1 SD higher −0.44, SE 0.09, men estimate −0.25, SE 0.05). The association of hepatic PDFF and log transformed HOMA-IR also varied by sex. There also was a significant interaction between liver PDFF and sex on log transformed HOMA-IR, (p=0.01) while higher liver PDFF was associated with higher HOMA-IR in both sexes, the association was stronger for women (women estimate per 1 SD higher 0.39, SE 0.07, men estimate 0.13, SE 0.06). No other significant interactions were noted with sex. No significant interactions were noted with diabetes. There was a significant interaction between VAT and 400 m walk time on log leptin (p=0.008). When we explored the interaction categorizing VAT above and below the median, the interaction was no longer significant, but a longer 400m walk time was associated with an additional increase in log leptin for those with visceral fat above the median VAT.
Discussion
In a cohort of men and women with varying degrees of CKD, a higher VAT volume, SAT volume and visceral fat deposits reflected by intrahepatic fat were associated with higher inflammatory burden, insulin resistance, altered adipokines profile and lower HDL cholesterol and higher triglyceride levels. These associations were similar to the relationship of other traditional measures of adiposity such as BMI and WC, with inflammation, insulin resistance and adipokines. Physical fitness was assessed by time taken to complete the 400 m walk test and was associated only with higher levels of leptin and higher inflammatory burden, and not with other adipokines and insulin resistance. Higher levels of physical fitness did not modify the associations between adiposity measures and cardiometabolic risk factors in CKD.
Adverse consequences of visceral fat have been attributed to several different mechanistic pathways as follows3. The increase in visceral fat is likely a response to an inability to increase SAT in the setting of positive caloric balance. Previous epidemiological investigations in the general population have shown a relationship between various fat depots and cardiometabolic risk factors. Data from the Framingham Heart Study demonstrated that both higher VAT volume and SAT volume were negatively correlated with total adiponectin and resistin, but were positively associated with systemic inflammation (IL-6, C-Reactive protein)4,20. In the Dallas Heart study, higher VAT was associated with lower adiponectin, enhanced insulin resistance, and abnormal HDL cholesterol levels. In contrast, SAT was associated with increased leptin and inflammatory markers, but not with insulin resistance, dyslipidemia and other cardiovascular risk factors21. Similar findings were also noted by the Jackson Heart Study investigators6. In contrast to the general population, the role of SAT/VAT with adipokines, inflammation and insulin resistance have not been examined in those with CKD. Our findings extend our understanding of these critical associations by characterizing them among a large cohort of individuals with CKD. Further, within this population, these relationships seem to be consistent across the sexes unlike what has been noted in the general population22,23. It is critical to note that our cohort is older (mean age 64 years vs 46 years in FHS and 44 in the DHS) and also had higher comorbidity burden unlike other study cohorts. Whether the differential associations of VAT and SAT noted in younger populations change with aging and development of comorbidity burden (as noted in our study) is unclear.
Similar to our findings, data from other community-based cohorts also observed higher correlation for both VAT and SAT with BMI/WC, and the association between VAT/SAT with the cardiometabolic factors were independent of overall adiposity21,24. We didn’t adjust for BMI/WC in the multivariable models due to high collinearity in the models. CKD per se is associated with higher CV disease burden, which is mediated in part, by greater inflammation, oxidative stress and insulin resistance. In the Framingham Heart Study, both VAT/SAT were associated with incident cardiovascular risk factors (hypertension, diabetes, HDL cholesterol) during a follow-up of 6 years25. We were unable to study this prospective relationship in our study population without pre-existing cardiovascular disease. Whether such a phenomenon exists in CKD is unknown and merits further investigation.
Finding that all metrics of adiposity assessed in our study had similar associations with cardiometabolic risk factors is notable. While MRI metrics are not readily available in clinical settings, BMI and WC can be easily measured. It is important to note that in both dialysis and non-dialysis dependent CKD, higher levels of BMI, but not WC have been associated with a lower risk of mortality26,27. Our observation that higher levels of BMI, WC, VAT and SAT were associated with a higher burden of cardiometabolic risk argues for longitudinal studies to assess if these observations will translate to higher CV events and mortality. Body fat distribution varies even within the same BMI range with some having a higher VAT while some with lower level28. Whether higher levels of VAT within different categories of SAT are associated with altered metabolic profile is of interest and warrants further study.
Data from the Framingham Health Study noted that intrahepatic fat was associated with cardiometabolic risk factors including an abnormal lipid profile and elevated BP; however data linking intrahepatic fat with adipokines and inflammatory markers are limited29. Our study provides novel data about the relationship between intrahepatic fat and metabolic risk factors in CKD. Higher liver PDFF was associated with several cardiometabolic risk factors including serum triglycerides in this cohort. Even though the exact mechanism for these observed associations are unclear, this may be because VAT and liver PDFF often influence both glucose regulation and lipid metabolism30. Higher VAT increases lipolytic activity leading to an increased delivery of hepatic fatty acids to the liver via the portal vein. The increased hepatic fatty acid load in turn increases serum triglyceride levels and contributes to hepatic insulin resistance.
Conflicting data exist regarding the relationship between various fat deposits and the risk of decline in kidney function. Data from the Framingham Offspring study shows that VAT and SAT are associated with CKD when eGFR was calculated using the cystatin C based equation, but not with MDRD31. In the Health ABC cohort, SAT, VAT, IMAT ((Intermediate Muscular Skeletal Assessment and Treatment), BMI, and WC (per SD increase) were significantly associated with a decline in kidney function and the authors concluded that anthropometric measures of body fat appear to provide an estimate of the risk of kidney function decline that is consistent with estimates based on CT measures of VAT, SAT32. We did not observe any correlation between baseline kidney function and VAT, SAT and liver PDFF in those with established CKD. Thus, whether these have any differential associations with kidney function decline will require future study.
Contrary to our hypothesis, performance on the physical function test did not alter the associations between fat measures and cardiometabolic factors. However, a higher level of physical fitness was associated with higher leptin and adiponectin levels in our cohort. Both in community-dwelling older men and women, higher leptin is associated with increased risk of impaired physical function33. Older adults with sarcopenic obesity (especially those with CKD) are also at higher risk of impaired physical function due to a loss of skeletal mass and strength from chronic inflammation and oxidative stress. The association between adiponectin and physical function has been attributed to a decline of skeletal muscle function34,35. While we did not formally assess skeletal muscle function, our observations are consistent with this observation.
Strengths of our study include a relatively large sample of patients with clinically diagnosed chronic kidney disease, the use of MRI to precisely quantify VAT, SAT and intrahepatic fat, and a validated protocol to assess aerobic fitness in patients with kidney disease. Further, fidelity of the MRI measure was assured by using the same standardized protocol at each site. We did not restrict the study to those with obesity and enrolled patients with different levels of BMI thereby increasing generalizability. Despite its strengths, we acknowledge limitations. Given the cross-sectional associations, causal relationship among adiposity measures, and cardiometabolic risk factors cannot be established. We enrolled patients who are being followed in health systems (actively seeking care) and hence whether these data are applicable to those with CKD in the community is unclear.
In summary, different adiposity measures such as BMI, WC, VAT and SAT are associated with various cardiometabolic risk factors highlighting the harmful effects of obesity in CKD. Physical function, as assessed by a 400m walk test was associated with some, but not all cardiometabolic risk factors studied. Notably, level of physical function did not modify the associations between fat measures and the cardiometabolic risk factors. A deeper understanding of the reasons for these differential associations may lead to new approaches to management of patients with CKD. Longitudinal studies addressing the relationship between measures of body fat and aerobic fitness with cardiovascular and kidney disease progression are warranted.
Supplementary Material
Figure S1. Flow chart showing number and how participants were selected for this analysis
Table S1. MRI fat by BMI category stratified by sex
Table S2. MRI fat by waist circumference (<88cm or <102cm) category stratified by sex
Table S3. Multivariable linear regression of different quartiles of adipokines, insulin resistance, inflammatory markers (log-transformed) and lipid profile with VAT, SAT, liver fat, and physical function
Figure 1—
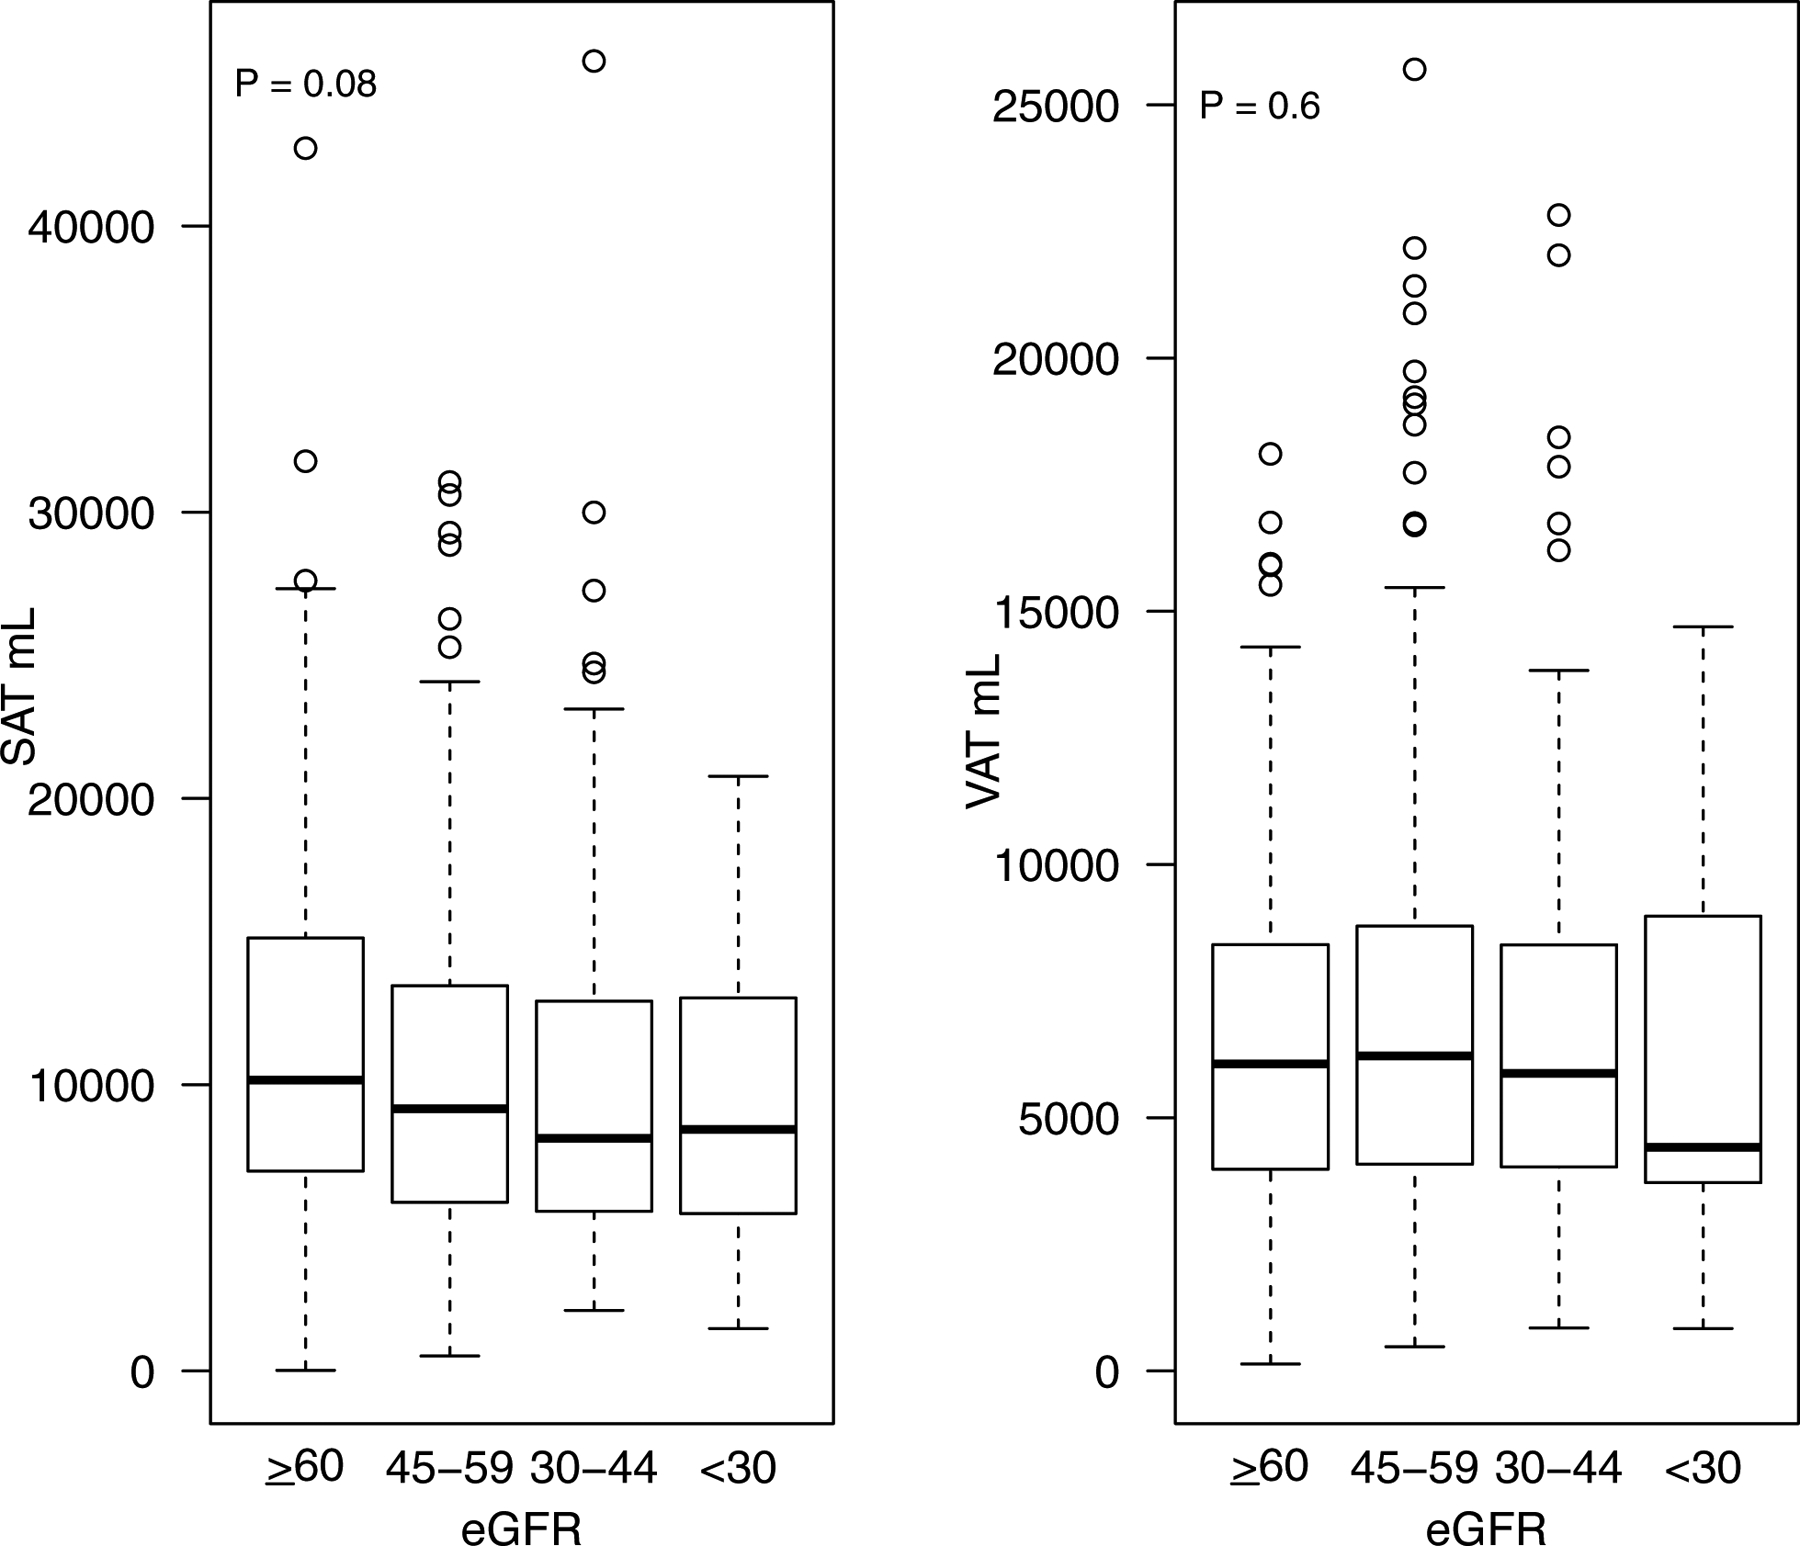
Boxplot of SAT and VAT by stage of CKD
Figure 2—
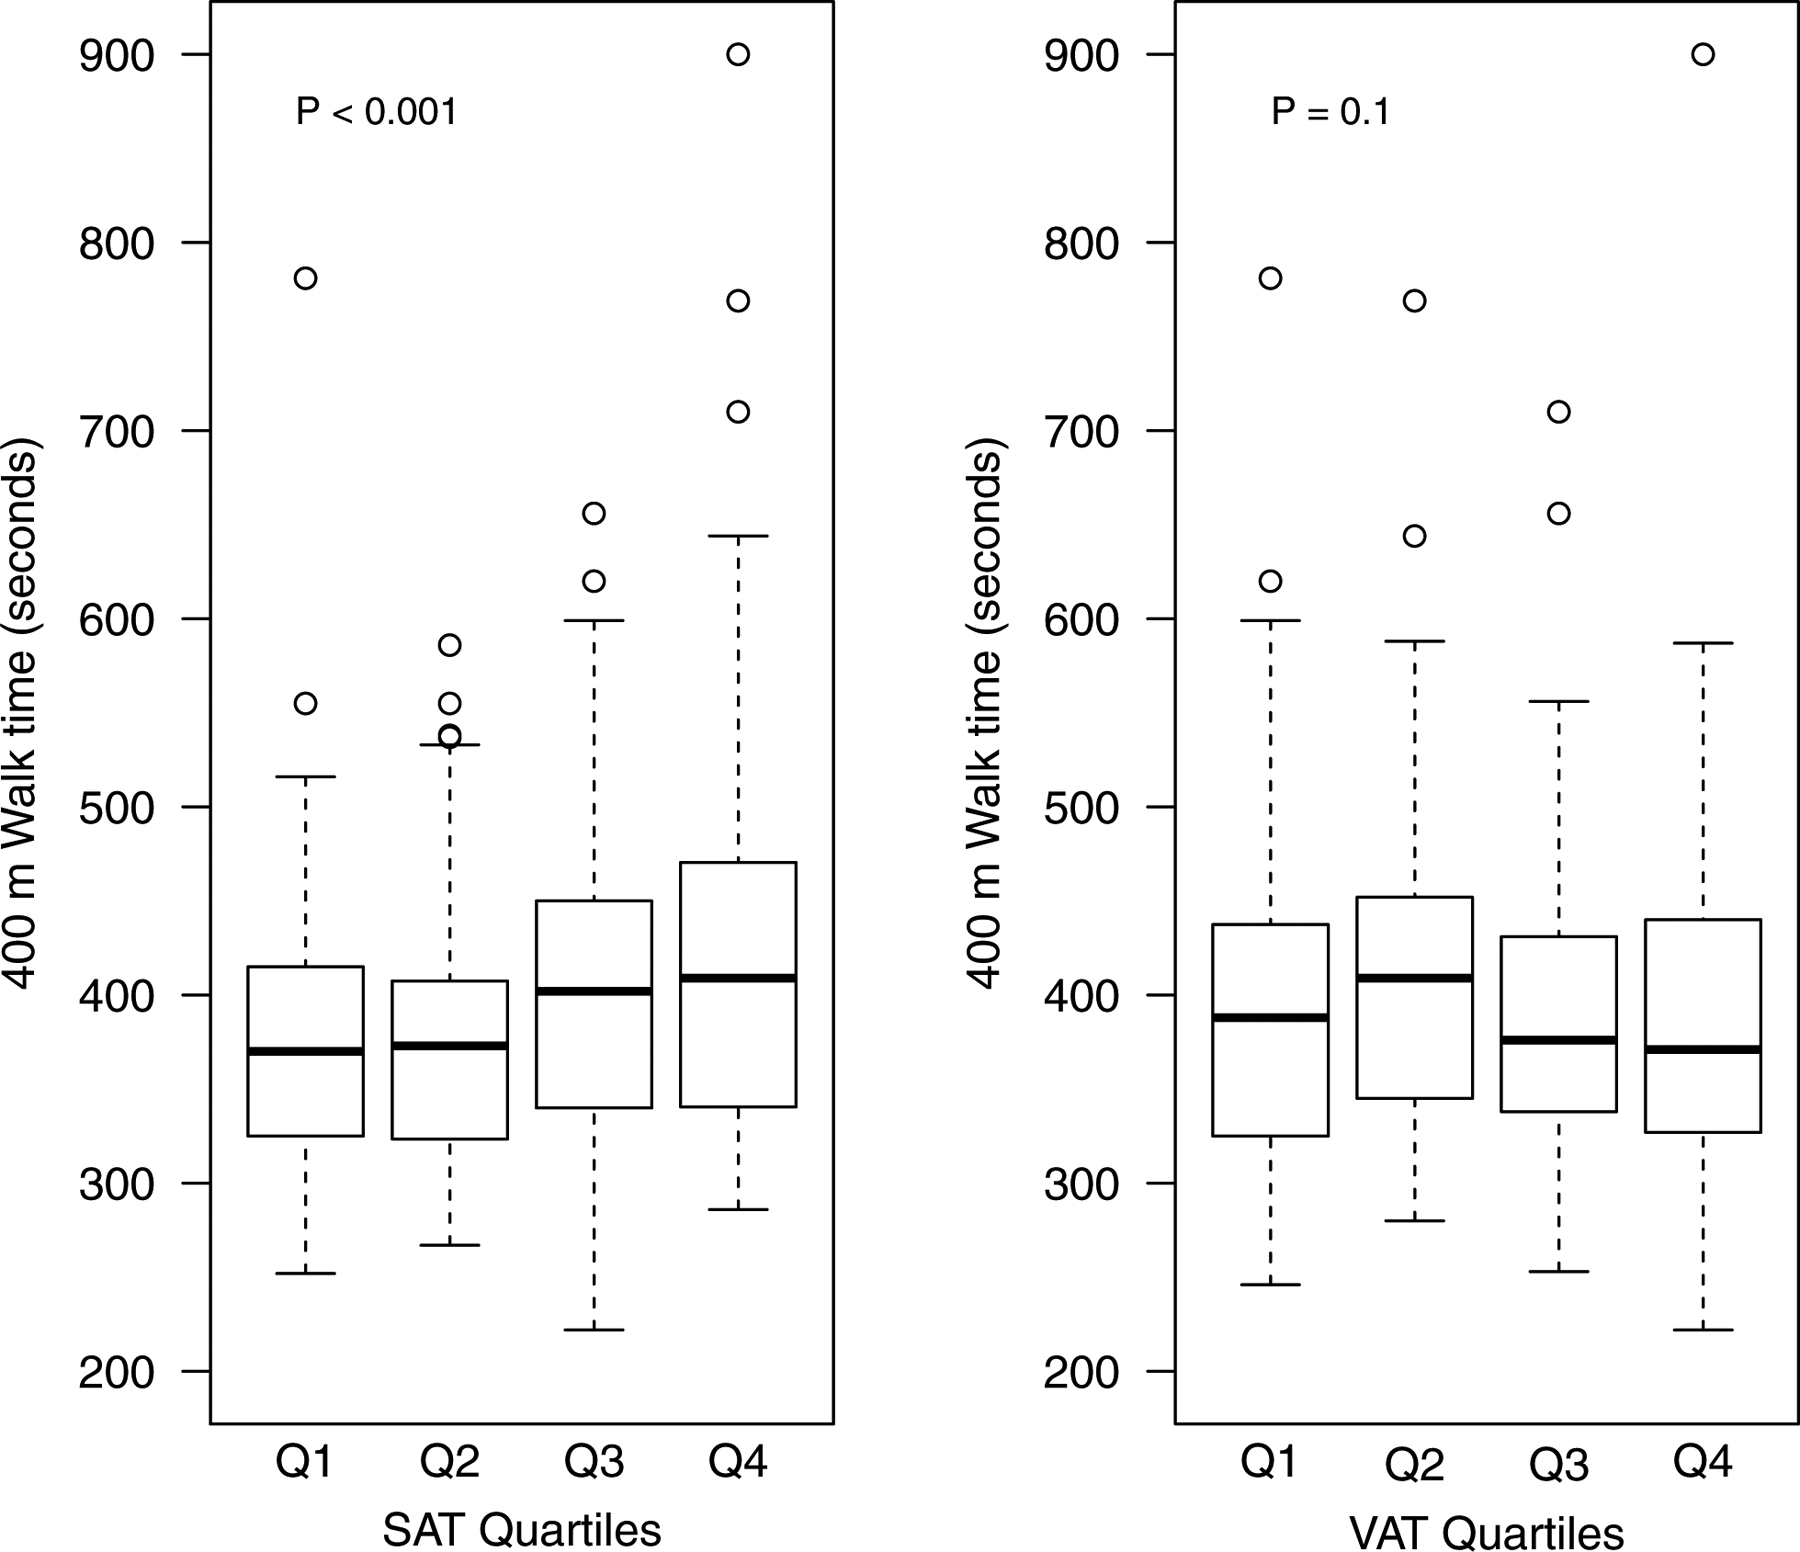
Boxplot of 400 m walk test time by quartiles of SAT and VAT
Table 2b.
Spearman correlation between cardiometabolic risk factors BMI, WC and physical function
| Factor | N | BMI rho (95% CI) | p-value | N | Waist Circumference rho (95% CI) | p-value | N | 400m walk time rho (95% CI) | p-value |
|---|---|---|---|---|---|---|---|---|---|
| Total Adiponectin | 401 | −0.31 (−0.40, −0.22) | <0.001 | 362 | −0.33 (−0.42, −0.23) | <0.001 | 392 | 0.05 (−0.05, 0.14) | 0.4 |
| HMW Adiponectin | 401 | −0.31 (−0.40, −0.22) | <0.001 | 362 | −0.35 (−0.43, −0.25) | <0.001 | 392 | 0.01 (−0.09, 0.11) | 0.8 |
| Leptin | 402 | 0.60 (0.54, 0.66) | <0.001 | 363 | 0.44 (0.35, 0.52) | <0.001 | 393 | 0.35 (0.26, 0.44) | <0.001 |
| Resistin | 401 | 0.05 (−0.05, 0.14) | 0.4 | 362 | 0.02 (−0.09, 0.12) | 0.7 | 392 | 0.18 (0.08, 0.27) | <0.001 |
| HOMA IR | 372 | 0.38 (0.29, 0.46) | <0.001 | 337 | 0.38 (0.29, 0.47) | <0.001 | 363 | 0.07 (−0.03, 0.17) | 0.2 |
| IL1-Beta | 401 | 0.04 (−0.05, 0.14) | 0.4 | 362 | 0.05 (−0.06, 0.15) | 0.4 | 392 | −0.01 (−0.11, 0.09) | 0.9 |
| IL6 | 402 | 0.28 (0.19, 0.37) | <0.001 | 363 | 0.28 (0.18, 0.37) | <0.001 | 393 | 0.34 (0.25, 0.43) | <0.001 |
| TNFAR1 | 402 | −0.01 (−0.11, 0.08) | 0.8 | 363 | 0.03 (−0.08, 0.13) | 0.6 | 393 | 0.26 (0.16, 0.35) | <0.001 |
| TNFAR2 | 401 | −0.01 (−0.10, 0.09) | 0.9 | 362 | −0.03 (−0.13, 0.08) | 0.6 | 392 | 0.15 (0.06, 0.25) | 0.002 |
| HDL cholesterol | 375 | −0.19 (−0.28, −0.09) | <0.001 | 340 | −0.27 (−0.36, −0.16) | <0.001 | 366 | −0.02 (−0.12, 0.08) | 0.7 |
| LDL cholesterol | 374 | −0.00 (−0.10, 0.10) | 0.9 | 339 | −0.10 (−0.21, 0.00) | 0.05 | 366 | −0.03 (−0.13, 0.07) | 0.5 |
| Triglycerides | 374 | 0.16 (0.06, 0.26) | 0.001 | 339 | 0.17 (0.06, 0.27) | 0.002 | 366 | −0.01 (−0.11, 0.09) | 0.8 |
PLAIN-LANGUAGE SUMMARY.
Obesity as assessed by body mass index is associated with an increased risk of heart disease and progression of kidney disease in those with chronic kidney disease (CKD). In this cohort of patients with CKD, we studied whether different obesity measures such as intra-abdominal fat, liver fat and sub cutaneous fat (obtained using an MRI scan) were associated with known cardiometabolic risk factors. We further assessed whether physical function (measured using a 400 m walk test) was independently associated with the same cardiometabolic risk factors. Our analysis suggests that all measures of higher fat content were associated with an increased level of cardiometabolic risk factors. While slower walk time were associated with an increased level of cardiometabolic risk factors, it did not modify the associations between fat measures and these risk factors. In summary, these data highlight that various abdominal fat measures and lower physical fitness levels are associated with a higher cardiovascular risk in those with CKD.
Acknowledgements:
The authors thank the participants, investigators, and staff of the CRIC Study for their contributions to this work.
Support: This work was supported by NIDDK-R01DK101500 (SDN). Funding for the CRIC Study was obtained under a cooperative agreement from National Institute of Diabetes and Digestive and Kidney Diseases (U01DK060990, U01DK060984, U01DK061022, U01DK061021, U01DK061028, U01DK060980, U01DK060963, U01DK060902 and U24DK060990). In addition, this work was supported in part by: the Perelman School of Medicine at the University of Pennsylvania Clinical and Translational Science Award NIH/NCATS UL1TR000003, Johns Hopkins University UL1 TR-000424, University of Maryland GCRC M01 RR-16500, Clinical and Translational Science Collaborative of Cleveland, UL1TR000439 from the National Center for Advancing Translational Sciences (NCATS) component of the National Institutes of Health and NIH roadmap for Medical Research, Michigan Institute for Clinical and Health Research (MICHR) UL1TR000433, University of Illinois at Chicago CTSA UL1RR029879, Tulane COBRE for Clinical and Translational Research in Cardiometabolic Diseases P20 GM109036, Kaiser Permanente NIH/NCRR UCSF-CTSI UL1 RR-024131, Department of Internal Medicine, University of New Mexico School of Medicine Albuquerque, NM R01DK119199.
Footnotes
Publisher's Disclaimer: This is a PDF file of an unedited manuscript that has been accepted for publication. As a service to our customers we are providing this early version of the manuscript. The manuscript will undergo copyediting, typesetting, and review of the resulting proof before it is published in its final form. Please note that during the production process errors may be discovered which could affect the content, and all legal disclaimers that apply to the journal pertain.
Financial Disclosure: Authors report no conflicts related to the contents of this manuscript. Outside the submitted work, SDN has served on an independent event adjudication committee for clinical trials sponsored by Bayer and Boehringer Ingelheim, served as a consultant to Tricida and Reata pharmaceuticals and received investigator-initiated research support from Keryx Biopharmaceuticals.
Publisher's Disclaimer: Disclaimer: The content is solely the responsibility of the authors and does not necessarily represent the official views of the NIH or the position or policy of the Department of Veterans Affairs or the US government.
Peer Review: Received November 25, 2019. Evaluated by 3 external peer reviewers and a statistician, with editorial input from an Acting Editor-in-Chief (Editorial Board Member Xueqing Yu MD, PhD). Accepted in revised form May 5, 2020. The involvement of an Acting Editor-in-Chief to handle the peer-review and decision-making processes was to comply with AJKD’s procedures for potential conflicts of interest for editors, described in the Information for Authors & Journal Policies.
References:
- 1.Britton KA, Massaro JM, Murabito JM, Kreger BE, Hoffmann U, Fox CS: Body fat distribution, incident cardiovascular disease, cancer, and all-cause mortality. J Am Coll Cardiol 62: 921–925, 2013 [DOI] [PMC free article] [PubMed] [Google Scholar]
- 2.Abraham TM, Pedley A, Massaro JM, Hoffmann U, Fox CS. Association between visceral and subcutaneous adipose depots and incident cardiovascular disease risk factors. Circulation. 2015. October 27;132(17):1639–47. [DOI] [PMC free article] [PubMed] [Google Scholar]
- 3.Neeland IJ, Ross R, Després JP, Matsuzawa Y, Yamashita S, Shai I, Seidell J, Magni P, Santos RD, Arsenault B, Cuevas A, Hu FB, Griffin B, Zambon A, Barter P, Fruchart JC, Eckel RH; International Atherosclerosis Society; International Chair on Cardiometabolic Risk Working Group on Visceral Obesity. Visceral and ectopic fat, atherosclerosis, and cardiometabolic disease: a position statement. Lancet Diabetes Endocrinol. 2019. July 10 pii: 10.1016/S2213-8587(19)30084-1. [Epub ahead of print] [DOI] [PubMed] [Google Scholar]
- 4.Pou KM, Massaro JM, Hoffmann U, et al. : Visceral and subcutaneous adipose tissue volumes are cross-sectionally related to markers of inflammation and oxidative stress: The framingham heart study. Circulation 116(11):1234–1241, 2007 [DOI] [PubMed] [Google Scholar]
- 5.Fox CS, Massaro JM, Hoffmann U, Pou KM, Maurovich-Horvat P, Liu CY, Vasan RS, Murabito JM, Meigs JB, Cupples LA, D’Agostino RB Sr, O’Donnell CJ. Abdominal visceral and subcutaneous adipose tissue compartments: association with metabolic risk factors in the Framingham Heart Study. Circulation. 2007. July 3;116(1):39–48. [DOI] [PubMed] [Google Scholar]
- 6.Liu J, Hickson DA, Musani SK, Talegawkar SA, Carithers TC, Tucker KL, Fox CS, Taylor HA. Dietary patterns, abdominal visceral adipose tissue, and cardiometabolic risk factors in African Americans: the Jackson heart study. Obesity (Silver Spring). 2013. March;21(3):644–51. [DOI] [PMC free article] [PubMed] [Google Scholar]
- 7.Wildman RP, Janssen I, Khan UI, et al. : Subcutaneous adipose tissue in relation to subclinical atherosclerosis and cardiometabolic risk factors in midlife women. Am J Clin Nutr 93(4):719–726, 2011 [DOI] [PMC free article] [PubMed] [Google Scholar]
- 8.Hall JE, do Carmo JM, da Silva AA, Wang Z, Hall ME: Obesity, kidney dysfunction and hypertension: Mechanistic links. Nat Rev Nephrol 15: 367–385, 2019 [DOI] [PMC free article] [PubMed] [Google Scholar]
- 9.Whaley-Connell A, Sowers JR. Obesity and kidney disease: from population to basic science and the search for new therapeutic targets. Kidney Int. 2017. August;92(2):313–323. [DOI] [PubMed] [Google Scholar]
- 10.Sharma K, Ramachandrarao S, Qiu G, et al. : Adiponectin regulates albuminuria and podocyte function in mice. J Clin Invest 118(5):1645–1656, 2008 [DOI] [PMC free article] [PubMed] [Google Scholar]
- 11.Wolf G, Hamann A, Han DC, et al. : Leptin stimulates proliferation and TGF-beta expression in renal glomerular endothelial cells: Potential role in glomerulosclerosis [seecomments. Kidney Int 56(3):860–872, 1999 [DOI] [PubMed] [Google Scholar]
- 12.McAuley PA, Artero EG, Sui X, Lee DC, Church TS, Lavie CJ, Myers JN, España-Romero V, Blair SN. The obesity paradox, cardiorespiratory fitness, and coronary heart disease. Mayo Clin Proc. 2012. May;87(5):443–51. [DOI] [PMC free article] [PubMed] [Google Scholar]
- 13.Florez H, Castillo-Florez S: Beyond the obesity paradox in diabetes: Fitness, fatness, and mortality. JAMA 308(6):619–620, 2012 [DOI] [PubMed] [Google Scholar]
- 14.Kokkinos P, Myers J, Faselis C, Doumas M, Kheirbek R, Nylen E: BMI-mortality paradox and fitness in african american and caucasian men with type 2 diabetes. Diabetes Care 35(5):1021–1027, 2012 [DOI] [PMC free article] [PubMed] [Google Scholar]
- 15.Denker M, Boyle S, Anderson AH, Appel LJ, Chen J, Fink JC, Flack J, Go AS, Horwitz E, Hsu CY, Kusek JW, Lash JP, Navaneethan S, Ojo AO, Rahman M, Steigerwalt SP, Townsend RR, Feldman HI, Chronic Renal Insufficiency Cohort Study Investigators: Chronic renal insufficiency cohort study (CRIC): Overview and summary of selected findings. Clin J Am Soc Nephrol 10: 2073–2083, 2015 [DOI] [PMC free article] [PubMed] [Google Scholar]
- 16.Simonsick EM, Fan E, Fleg JL: Estimating cardiorespiratory fitness in well-functioning older adults: Treadmill validation of the long distance corridor walk. J Am Geriatr Soc 54(1):127–132, 2006 [DOI] [PubMed] [Google Scholar]
- 17.Newman AB, Simonsick EM, Naydeck BL, et al. : Association of long-distance corridor walk performance with mortality, cardiovascular disease, mobility limitation, and disability. JAMA 295(17):2018–2026, 2006 [DOI] [PubMed] [Google Scholar]
- 18.Addeman BT, Kutty S, Perkins TG, Soliman AS, Wiens CN, McCurdy CM, Beaton MD, Hegele RA, McKenzie CA. Validation of volumetric and single-slice MRI adipose analysis using a novel fully automated segmentation method. J Magn Reson Imaging. 2015. January;41(1):233–41. [DOI] [PubMed] [Google Scholar]
- 19.Matthews DR, Hosker JP, Rudenski AS, Naylor BA, Treacher DF. Turner RC. Homeostatis model assessment: Insulin resistance and beta-cell function from fasting glucose and insulin concentration in man. Diabetologia 1985;28:412–419. [DOI] [PubMed] [Google Scholar]
- 20.Jain SH, Massaro JM, Hoffmann U, Rosito GA, Vasan RS, Raji A, O’Donnell CJ, Meigs JB, Fox CS. Cross-sectional associations between abdominal and thoracic adipose tissue compartments and adiponectin and resistin in the Framingham Heart Study. Diabetes Care. 2009. May;32(5):903–8. [DOI] [PMC free article] [PubMed] [Google Scholar]
- 21.Neeland IJ, Ayers CR, Rohatgi AK, Turer AT, Berry JD, Das SR, Vega GL, Khera A, McGuire DK, Grundy SM, de Lemos JA. Associations of visceral and abdominal subcutaneous adipose tissue with markers of cardiac and metabolic risk in obese adults. Obesity (Silver Spring). 2013. September;21(9):E439–47. [DOI] [PMC free article] [PubMed] [Google Scholar]
- 22.Bidulescu A, Liu J, Hickson DA, Hairston KG, Fox ER, Arnett DK, Sumner AE, Taylor HA, Gibbons GH. Gender differences in the association of visceral and subcutaneous adiposity with adiponectin in African Americans: the Jackson Heart Study. BMC Cardiovasc Disord. 2013. February 22;13:9. [DOI] [PMC free article] [PubMed] [Google Scholar]
- 23.Cartier A, Côté M, Lemieux I, Pérusse L, Tremblay A, Bouchard C, Després JP. Sex differences in inflammatory markers: what is the contribution of visceral adiposity? Am J Clin Nutr. 2009. May;89(5):1307–14. [DOI] [PubMed] [Google Scholar]
- 24.Scheuer SH, Færch K, Philipsen A, Jørgensen ME, Johansen NB, Carstensen B, Witte DR, Andersen I, Lauritzen T, Andersen GS. Abdominal Fat Distribution and Cardiovascular Risk in Men and Women With Different Levels of Glucose Tolerance. J Clin Endocrinol Metab. 2015. September;100(9):3340–7. [DOI] [PubMed] [Google Scholar]
- 25.Abraham TM, Pedley A, Massaro JM, Hoffmann U, Fox CS: Association between visceral and subcutaneous adipose depots and incident cardiovascular disease risk factors. Circulation 132: 1639–1647, 2015 [DOI] [PMC free article] [PubMed] [Google Scholar]
- 26.Kovesdy CP, Anderson JE, Kalantar-Zadeh K: Paradoxical association between body mass index and mortality in men with CKD not yet on dialysis. Am J Kidney Dis 49: 581–591, 2007 [DOI] [PubMed] [Google Scholar]
- 27.Kramer H, Shoham D, McClure LA, Durazo-Arvizu R, Howard G, Judd S, Muntner P, Safford M, Warnock DG, McClellan W: Association of waist circumference and body mass index with all-cause mortality in CKD: The REGARDS (reasons for geographic and racial differences in stroke) study. Am J Kidney Dis 58: 177–185, 2011 [DOI] [PMC free article] [PubMed] [Google Scholar]
- 28.Ross R, Freeman J, Hudson R, Janssen I. Abdominal obesity, muscle composition, and insulin resistance in premenopausal women. J Clin Endocrinol Metab. 2002. November;87(11):5044–51. [DOI] [PubMed] [Google Scholar]
- 29.Lee JJ, Pedley A, Hoffmann U, Massaro JM, Levy D, Long MT. Visceral and Intrahepatic Fat Are Associated with Cardiometabolic Risk Factors Above Other Ectopic Fat Depots: The Framingham Heart Study. Am J Med. 2018. June;131(6):684–692.e12. doi: 10.1016/j.amjmed.2018.02.002. [DOI] [PMC free article] [PubMed] [Google Scholar]
- 30.Huang G, Wang D, Zeb I, Budoff MJ, Harman SM, Miller V, Brinton EA, El Khoudary SR, Manson JE, Sowers MR, Hodis HN, Merriam GR, Cedars MI, Taylor HS, Naftolin F, Lobo RA, Santoro N, Wildman RP. Intra-thoracic fat, cardiometabolic risk factors, and subclinical cardiovascular disease in healthy, recently menopausal women screened for the Kronos Early Estrogen Prevention Study (KEEPS). Atherosclerosis. 2012. March;221(1):198–205. [DOI] [PMC free article] [PubMed] [Google Scholar]
- 31.Young JA, Hwang SJ, Sarnak MJ, Hoffmann U, Massaro JM, Levy D, Benjamin EJ, Larson MG, Vasan RS, O’Donnell CJ, Fox CS: Association of visceral and subcutaneous adiposity with kidney function. Clin J Am Soc Nephrol 3: 1786–1791, 2008 [DOI] [PMC free article] [PubMed] [Google Scholar]
- 32.Madero M, Katz R, Murphy R, Newman A, Patel K, Ix J, Peralta C, Satterfield S, Fried L, Shlipak M, Sarnak M: Comparison between different measures of body fat with kidney function decline and incident CKD. Clin J Am Soc Nephrol 12: 893–903, 2017 [DOI] [PMC free article] [PubMed] [Google Scholar]
- 33.Lana A, Struijk E, Guallar-Castillon P, Martin-Moreno JM, Rodriguez Artalejo F, Lopez-Garcia E: Leptin concentration and risk of impaired physical function in older adults: The seniors-ENRICA cohort. Age Ageing 45: 819–826, 2016 [DOI] [PubMed] [Google Scholar]
- 34.Karvonen-Gutierrez CA, Zheng H, Mancuso P, Harlow SD: Higher leptin and adiponectin concentrations predict poorer performance-based physical functioning in midlife women: The michigan study of women’s health across the nation. J Gerontol A Biol Sci Med Sci 71: 508–514, 2016 [DOI] [PMC free article] [PubMed] [Google Scholar]
- 35.Huang C, Niu K, Momma H, Kobayashi Y, Guan L, Nagatomi R. Inverse association between circulating adiponectin levels and skeletal muscle strength in Japanese men and women. Nutr Metab Cardiovasc Dis. 2014. January;24(1):42–9. [DOI] [PubMed] [Google Scholar]
Associated Data
This section collects any data citations, data availability statements, or supplementary materials included in this article.
Supplementary Materials
Figure S1. Flow chart showing number and how participants were selected for this analysis
Table S1. MRI fat by BMI category stratified by sex
Table S2. MRI fat by waist circumference (<88cm or <102cm) category stratified by sex
Table S3. Multivariable linear regression of different quartiles of adipokines, insulin resistance, inflammatory markers (log-transformed) and lipid profile with VAT, SAT, liver fat, and physical function