

Abstract
Increasingly, it has been recognized that analysis at the symptom, rather than diagnostic, level will drive progress in the field of immunopsychiatry. Network analysis offers a useful tool in this pursuit with the ability to identify associations between immune markers and individual symptoms, independent of all other variables modeled. However, investigation into how methodological decisions (i.e., including vs. excluding participants with C-reactive protein (CRP) > 10 mg/L, regularized vs. nonregularized networks) influence results is necessary to establish best practices for the use of network analysis in immunopsychiatry. In a sample of 3,464 adult participants from the 2015–2016 National Health and Nutrition Examination Survey dataset, this study found consistent support for associations between CRP and fatigue and changes in appetite and some support for additional CRP—criterion associations. Methodologically, results consistently demonstrated that including individuals with CRP > 10 mg/L and estimating nonregularized networks provided better estimates of these associations. Thus, we recommend considering the use of nonregularized networks in immunopsychiatry and inclusion of cases with CRP values >10 mg/L when testing the association between CRP and depression criteria, unless contraindicated by the research question being tested. Additionally, results most consistently suggest that CRP is uniquely related to fatigue and changes in appetite, supporting their inclusion in an immunometabolic phenotype of depression. Finally, these associations suggest that fatigue and changes in appetite might be particularly receptive to anti-inflammatory treatments. However, future research with more nuanced measures is necessary to parse out whether appetite increases or decreases drive this association. Further, longitudinal research is an important next step to test how these relationships manifest over time.
Introduction
Systemic low-grade inflammation is an established correlate of, and is gaining evidence as a potential causal risk factor for, depression symptoms (Dhabhar et al., 2009; Dowlati et al., 2010; Howren et al., 2009; Moriarity et al., 2020a). In fact, elevated inflammation is associated with treatment-resistant depression (Yang et al., 2019). In particular, the acute phase reactant C-reactive protein (CRP) arguably is the most researched inflammatory index in depression research (Horn et al., 2018; Howren et al., 2009). CRP is a non-specific pentameric protein synthesized in the liver that is upregulated during the acute phase of inflammation in response to stimulation from other proinflammatory proteins (e.g., interleukin (IL)-6 and IL-1 ; Du Clos, 2000).
Meta-analytic evidence generally has indicated that CRP is higher in individuals with Major Depressive Disorder (MDD) than those without a diagnosis (Haapakoski et al., 2015; Howren et al., 2009). Another meta-analysis found that higher CRP is associated with more depression symptoms in cross-sectional and longitudinal studies (Valkanova et al., 2013). However, the effect sizes vary (Horn et al., 2018), and, in some samples, relationships are not evident (e.g., Khandaker et al., 2014; Miller & Cole, 2012). One plausible explanation for this inconsistency, supported by Horn and colleagues (2018), is variability in covariates included across studies. Elevations in CRP also are associated with a diverse range of conditions and environmental stimuli, several of which also are confounded with depression (e.g., obesity, smoking, chronic health conditions; Kushner et al., 2006). Further, elevated inflammation only is seen in a subset of individuals with depression (Raison & Miller, 2011). One potential explanation for this is that CRP is not associated equally with all depression symptoms, which has inspired calls for investigations into the inflammatory phenotyping of depression (Felger et al., 2018; Krishnadas & Harrison, 2016) and expanding the scalar variety of psychopathological constructs analyzed in immunopsychiatry research (Moriarity & Alloy, in press).
Initial work examining the association between CRP and specific depression symptoms and symptom subtypes supports this argument. For example, several studies have found associations between CRP and neurovegetative symptoms such as sleeping problems, fatigue, and changes in appetite (Jokela et al., 2016; Lamers et al., 2018; White et al., 2017). In fact, out of all inflammatory proteins, a recent review concluded that CRP was the most consistently associated with neurovegetative symptoms (Majd et al., 2020). However, it is important to note that some studies find that CRP is associated with neurovegetative profiles including increased appetite (Glaus et al., 2014; Hickman et al., 2014; Lamers et al., 2018; see Milaneschi et al., 2020 for a review), and others find it is associated with scores featuring decreased appetite (Duivis et al., 2015; Elovainio et al., 2009). CRP also has been associated with depressed mood and negative attention biases (Boyle et al., 2017; White et al., 2017), in line with theory that inflammation might be particularly associated with exaggerated responsivity to negative stimuli (Dooley et al., 2018). There also is support for an association between CRP and blunted reward processing in terms of self-report anhedonia (Felger et al., 2016; Moriarity et al., 2019), decreased functional connectivity within reward circuitry (Felger et al., 2016), and high basal ganglia glutamate (Haroon et al., 2016). Although there is some support that CRP is associated with cognitive difficulties seen in depression, this association might be dependent on neurovegetative symptoms (Krogh et al., 2014). In sum, there is the strongest evidence for an association between CRP and neurovegetative symptoms, affective symptoms, and reward abnormalities.
Recently, Fried and colleagues (2019) applied network analysis (a statistical approach designed to investigate unique, pairwise associations in multivariate data) in a sample of 2,321 adults from the Netherlands Study of Depression and Anxiety (NESDA) to extend this line of inquiry. Network analysis is a powerful tool for this research question because it results in estimates of the unique association between two variables, controlling for all other variables in the network. Thus, in a network comprised of CRP and depression symptoms, an association between CRP and a specific symptom is independent of all other symptoms in the network. One set of models in Fried et al. (2019) tested the association between CRP and the nine DSM criteria for MDD controlling for two sets of covariates: 1) sex and age, and 2) sex, age, alcohol use, exercise, smoking status, body mass index (BMI), and number of current chronic diseases. When only controlling for sex and age, CRP was associated uniquely with sleep problems, energy level, and changes in appetite/weight (identical to the findings using logistic regressions in Jokela et al., 2016). However, when including more covariates, CRP still was associated with sleep problems and energy level, but not with changes in appetite/weight. Although the overlap between these findings and the others described above is promising, the replicability of network analyses has been called into question due to concerns about single-item measurement properties and high power requirements (Forbes et al., 2017; see Borsboom et al., 2017 and Jones, et al., 2019 for responses). Thus, replication is crucial, especially because CRP—symptom associations were small in this study.
The CRP—nine DSM depression criteria models are particularly important to replicate for several reasons. First, CRP is one of, if not the, most popular inflammatory protein utilized in depression research. Second, focusing on symptoms that make up current diagnostic criteria has the opportunity to characterize inflammatory phenotypes at the level depression typically is diagnosed. Although the DSM has been criticized as something that can hold back meaningful, transdiagnostic research (resulting in initiatives such as RDoC; Insel et al., 2010), modifying official diagnostic criteria is a long, slow process. Given that the DSM is still the primary tool used by clinicians in diagnosis and treatment planning, characterizing inflammatory phenotypes using DSM-criteria might help the transition from research to practice. However, research branching beyond DSM criteria still is necessary to progress psychiatric nosology and etiology. Third, most contemporary measures of depression have at least one item for each DSM criteria, but also include additional items measuring a broader depressive construct (e.g., Fried et al., 2019 included a measure of “interpersonal sensitivity”). Thus, analyzing DSM symptoms facilitates cleaner comparison between studies because including all symptoms measured might increase variability of depressive constructs across measures.
The Present Study
This study attempts to replicate and extend Fried et al.’s (2019) models using data from the National Health and Nutrition Examination Survey (NHANES), a study of physical and mental health in the United States. This is an ideal replication sample for the CRP—nine DSM depression criteria models for several reasons. First, it is larger (N = 3,464 or 3,133, depending on the specific model described below) than the original sample (N = 2,321). This is beneficial because network analyses require a lot of power given the amount of parameters estimated. Further, estimates of associations between self-report and biological variables are subject to downward biasing due to measurement-domain specific error variance, further attenuating power. Second, it also allows for an attempted cross-cultural replication (United States vs. Netherlands). Third, the original sample was 65% female. As there is evidence that females have higher levels of CRP (Lakoski et al., 2006), depression symptoms (Kessler, 2006), and that the association between the two is stronger for females (Moriarity et al., 2019), replication in a sample with more comparable proportions of males and females is important for evaluating generalizability (this dataset is 47.1% female, 52.9% male). Also, Fried et al. (2019) used a sample that predominantly consisted of individuals with current or a history of depression and anxiety. Given the amount of research on depression and inflammation in nonclinical samples (e.g., Chu et al., 2019; Duivis et al., 2015; Moriarity et al., 2020b), it is important to evaluate whether these results replicate in a nonclinical sample. This is especially true considering that even subclinical depression symptoms are associated with functional impairment and suicidality (Balázs et al., 2013). Additionally, given that inflammation is a stress-reactive system, associations between biomarkers and depression symptoms might be confounded in samples of individuals who currently report distress or impairment (criteria to meet a diagnosis of MDD).
This study also will extend Fried et al. (2019) by re-estimating the original models with different analytic choices. Network models frequently are regularized, a process that shrinks edge weights, including reducing small ones to zero, in the pursuit of a sparse network. However, there is evidence that nonregularized (estimated without this procedure) network models are preferable to regularized models for psychopathology data (Williams et al., 2019). Although Fried et al. (2019) re-estimated their most complex models without regularization, nonregularized versions were not reported for the models involving CRP and the nine DSM criteria. This will be addressed in this study. Second, the original study removed participants with CRP values > 10 mg/L, in line with recommendations that this can be indicative of acute infection (Bell et al., 2017; de Ferranti et al., 2006). However, there has been recent discussion as to the appropriateness of this as a default methodological decision, given that theory linking depression and inflammation focuses on those with elevated inflammatory profiles (Mac Giollabhui et al., 2020). Thus, this study will estimate all models with and without 331 participants with CRP values > 10 mg/L. Through a rigorous test of replication and the addition of novel statistical methodologies, this study aims to enhance our understanding of the relationship between CRP and specific depression criteria and to guide future network analyses in immunopsychiatry.
Methods
Participants and Procedures
This study utilized the NHANES 2015–2016 dataset, a nationally representative community sample of the United States. This dataset was designed by the National Center of Health Statistics (NCHS) at the Centers for Disease Control and Prevention to examine a wide range of physical and mental health constructs in the United States. The NCHS oversaw all data collection and approved the NHANES study protocol (for more details about the survey designs and data collection methodologies please review: Centers for Disease Control and Prevention, 2009; Chen et al., 2018; Zipf et al., 2013). The NHANES survey was selected to replicate Fried and colleague’s (2019) analyses focusing on CRP and DSM criteria for depression because of its large sample size and adequate measurement of CRP and depression criteria, which were completed on the same day. 5,616 adult participants were selected for the analytic sample based on complete data for serum CRP, Patient Health Questionnaire (PHQ-9), and covariate measurements (described below). 2,152 did not have complete data, resulting in an analytic sample of 3,464 adults who were an average of 47.33 years old and 47.1% female (see Table 1 for descriptives).
Table 1.
Summary of Sample Characteristics
| Entire Sample (N = 3,464) | CRP > 10 mg/L removed (N = 3,132) |
|---|---|
| M (SD) and range for continuous variables or % for categorical variables | |
| 47.33 (16.21) Range: 20–79 | 47.40 (16.34) Range: 20–79 |
| 3.28 (4.28) Range: 0–27 | 3.17 (4.18) Range: 0–27 |
| 16.5 % | 16.4 % |
| 47.1 % | 45.1 % |
| 17.5 % | 17.6 % |
| 13.0 % | 13.2 % |
| 35.5 % | 35.9 % |
| 20.7 % | 19.4 % |
| 9.2 % | 9.8 % |
| 4.0 % | 4.1 % |
| 8.9 % | 8.2 % |
| 3.4 % | 2.8 % |
| 24.8 % | 23.8 % |
| 4.8 % | 4.4 % |
| 3.1 % | 2.9 % |
| 3.7 % | 3.5 % |
| 2.1 % | 2.0 % |
| 2.3 % | 2.3 % |
| 7.4 % | 7.2 % |
| 2.3 % | 1.9 % |
| 2.6 % | 2.4 % |
| 3.3 % | 3.2 % |
Note. M = Mean, SD = Standard deviation, CRP = C-reactive protein, Dep = depression, COPD = Chronic obstructive pulmonary disease
Measures
Depression criteria
The Patient Health Questionnaire (PHQ-9; Kroenke et al., 2001) is a nine-item self-report measure that was administered to assess the frequency of nine DSM-IV diagnostic criteria during the past 2 weeks, including one additional item to assess the level of impairment due to these symptoms. Only the nine items measuring sadness, anhedonia, sleep problems, fatigue, psychomotor difficulties, feeling bad about oneself, difficulty concentrating, changes in appetite, and thoughts of death were used in analyses (see Table 2 for item wording). Participants were asked to rate each item using a 4-point Likert scale ranging from 0 (not at all) to 3 (nearly every day). Cronbach’s α = .84 in this sample. Diagnostic interview data were not available but, based on a meta-analysis (Manea et al., 2012), between 6.8% and 12.8% of the sample endorsed symptoms above suggested clinical cut-offs (PHQ-9 score 8–11). Additionally, 16.5% of the sample reported that the criteria they endorsed caused them some level of difficulty.
Table 2.
Node Descriptives and Item Descriptions
| Mean (Variation) | ||
|---|---|---|
| CRP>10 mg/L Removed | CRP>10 mg/L Included | |
| CRP (mg/L) | 2.48 (5.50) | 4.26 (66.54)* |
| Sad: “Feeling down, depressed or hopeless” | .34 (.48) | .35 (.50) |
| Anhedonia: “Have little interest in doing things” | .38 (.58) | .39 (.60) |
| Sleep problems: “Trouble sleeping or sleeping too much” | .61 (.85) | .63 (.87) |
| Fatigue: “Feeling tired or having little energy” | .76 (.82) | .79 (.86) |
| Appetite changes: “Poor appetite or overeating” | .38 (.57) | .40 (.60) |
| Psychomotor changes: “Moving or speaking slowly or too fast” | .15 (.26) | .15 (.27) |
| Difficulty concentrating: “Trouble concentrating on things” | .25 (.42) | .26 (.44) |
| Feels bad about self: “Feeling bad about oneself” | .24 (.39) | .25 (.41) |
| Thoughts of death: “Thought you would be better off dead” | .06 (.10) | .06 (.10) |
Note:
CRP is raw in this table, but was transformed using a nonparanormal transformation for analyses, CRP = C-reactive protein
Fried et al. (2019) used the Inventory of Depressive Symptomatology Self-Report (IDS-SR; Rush et al., 1996). The IDS-SR has 28 items, also rated on a 0–3 scale, asking about frequency of the symptoms in the week prior to the assessment. To create the model testing the 9 DSM-5 criteria, the most severe response endorsed out of all relevant items was used (e.g., sleep problems was coded as the most severely reported out of the four sleep-related questions). Two items were compounded to create the appetite/weight variable, two were compounded for the anhedonia variable, and two were compounded for the psychomotor difficulties variable.
C-reactive protein
Blood was drawn via venipuncture and high sensitivity CRP levels were assayed using the SYNCHRON System(s) High Sensitivity C-Reactive Protein reagent. The system portioned out one-part sample to 26-parts reagent into a cuvette and monitored change in absorbance at 940 nanometers. This change is proportional to the concentration of CRP and is used to calculate the concentration based on a single-point adjusted, pre-determined calibration curve. There was a change in lab equipment during the 2015–2016 survey cycle from the Beckman Coulter UniCel DxC 600 Synchron chemistry analyzer to the Beckman Coulter UniCel DxC 600i Synchron chemistry analyzer. An internal comparison study was reported to indicate no statistical adjustment was required to correct for this change. Specimens were frozen at −70 °C until the day of the assay. Samples were estimated singly as part of a Multi-analyte Biochemistry Panel. Lower limit of detection for CRP was .08 mg/L (values lower than this were set to .08 mg/L). Participants were asked to fast the morning before the blood draw.
Covariates
To replicate the procedures of Fried et al. (2019), age, sex, alcohol intake, smoking status (“Never”, “Past”, “Current), BMI, disease burden (number of current chronic diseases), and physical activity all were included as covariates in the present study (however, not all covariates were used in all models, see “Statistical Analyses”). Sex was coded as 0 = “Male”, 1 = “Female”, so positive associations with sex represent higher levels in females. Alcohol intake was assessed via the Alcohol Use Questionnaire (Piccinelli et al., 1997). Smoking status was coded as 1 = “Never”, 2 = “Past”, 3 = “Current”. BMI was calculated based on self-reported height and weight measurements (weight [kg]/height [m2]). Physical activity was quantified as MET minutes (minutes of exercise per week corrected for the amount of energy required for a given activity) via a modified version of the Global Physical Activity Questionnaire (Armstrong & Bull, 2006).
Statistical Analyses
Analyses were conducted in R version 3.6.2 (R Core Team, 2013). Unless otherwise stated, analytic decisions matched Fried et al. (2019). Skewed distributions (specifically, for exercise and alcohol consumption in all models) were normalized using the nonparanormal transformation (Liu et al., 2009). CRP only was skewed (and consequently, transformed) for the models including CRP > 10 mg/L.
First, in line with Fried et al. (2019), two network models were estimated to assess the association between CRP and nine DSM depression criteria controlling for i) sex and age and ii) sex, age, alcohol use, exercise, smoking status, BMI, and number of chronic diseases. In network models, variables are referred to as “nodes” and the associations between two nodes, controlling for all other associations in the networks, are described as “edges”. Given that the data consisted of categorical, ordinal, continuous, and count variables, the R-package mgm (Version 1.2–10; Haslbeck & Waldorp, 2020) was used to estimate Mixed Graphical Models (MGMs). To minimize false positives, mgm employs the least absolute shrinkage and selection operator (LASSO; Tibshirani, 1996). The LASSO shrinks all edge weights towards zero and sets very small edge weights to exactly zero. The magnitude of this penalty is specified by parameter lambda, which was selected using the Extended Bayesian Information Criterion (EBIC; Foygel & Drton, 2010, see Epskamp & Fried, 2018 for a tutorial paper on regularized networks). Additionally, EBIC has a tuning parameter gamma (lower gamma results in less conservative models), which was set to 0 for the primary models. Rationale for this distinction is described below. However, in line with Fried et al. (2019), identical regularized models were re-estimated with mgm’s default gamma (0.25) as a sensitivity analysis. To further reduce the risk of false positives, mgm employs a threshold (Loh & Wainwright, 2012) to set very small edge weights to zero. Consistent with research finding that nonregularized networks are preferable to regularized networks for psychopathology research (Williams et al., 2019), both gamma = 0 models were re-estimated without regularization while still controlling for the false positive rate via the threshold. All models were estimated with and without 331 individuals with CRP > 10 mg/L (eight total primary models, not including the gamma = .25 sensitivity analyses).
Gamma was specified as zero because it should be expected that associations between a specific inflammatory protein and depression criteria will be small for several reasons: i) theory for depression risk focuses on the broader construct of inflammation, of which CRP is only a single indicator of non-specific inflammation, ii) there are many potential interacting biopsychosocial factors that influence and compound depression risk throughout the lifespan (Raison & Miller, 2011), and iii) analyzing different measurement domains (i.e., blood assays vs. self-report) introduces measurement domain-specific variance that will not be shared between our nodes of interest (biology—self-report), downward biasing estimates. Importantly, all edges are shrunk towards zero under LASSO regularization (Epskamp & Fried, 2018), and simulation work studying LASSO primarily has assumed all variables come from the same measurement domain. Thus, depression—inflammation links are disproportionality likely to be reduced to 0 than “same-domain” edges (e.g., between two self-report nodes) under regularization.
Identical to Fried et al. (2019), edge weight stability was estimated using the bootnet package (Version 1.4.3, described in more detail in Epskamp et al., 2017). In short, 500 bootstraps were used to estimate 95% confidence intervals for the edge weights. The proportion of bootstraps in which edges of interest were nonzero are reported. Note that, in the regularized models, the edge-estimates (and thus, sample distributions) are biased towards zero. Finally, we also estimated predictability, which quantifies how well a node is predicted by the other nodes in the network (interpreted similar to an R2; Haslbeck & Waldorp, 2018).
Results
Preliminary Analyses
Descriptive statistics for all nodes can be found in Table 2. Independent samples t-tests comparing those with and without CRP > 10 mg/L on study variables found that individuals with CRP > 10 mg/L had higher total depression criteria scores (Mdiff = 1.17, p < .001), higher BMI (Mdiff = 7.40, p < .001), less exercise (Mdiff = −698.39 METs, p = .047), more diseases (Mdiff = .43, p < .001), and were more likely to be female (X2 = 58.32, p < .001). Participants grouped by CRP status (i.e., < or ≥ 10 mg/L) did not differ on age (Mdiff = −.83, p = .342), alcohol consumption (Mdiff = 169.18, p = .636), or smoking status (X2 = 1.14, p = .567). Females had higher CRP and total depression criteria scores than males (Mdiff = 1.71 mg/L, p < .001; Mdiff = .90, p < .001, respectively).
Regularized Networks
Controlling for sex and age
See Table 3 for a summary of edge weights, CRP predictability, and stability of nonzero edges (for both Fried et al., 2019 and the current analyses). In the first direct replication model (regularized networks excluding CRP > 10 mg/L, Figure 1a), higher CRP was associated with fatigue and greater changes in appetite when adjusting for sex and age, similar to Fried et al. (2019). The CRP-fatigue and CRP-appetite edges were nonzero in 95% and 63% of the bootstrapped analyses, respectively. However, there also was an edge between CRP and sleep problems in Fried et al. (2019), which was not found in this sample. CRP predictability was similar between the two studies (original: 3.4%, replication: 3.7%).
Table 3.
CRP Predictability and CRP-Symptom Edge Weights/Stability
| CRP Predictability | Sad | Anhedonia | Sleep | Fatigue | Appetite | Psychomotor | Concentration | Feels Bad | Thoughts of Death | |
|---|---|---|---|---|---|---|---|---|---|---|
| CRP > 10 mg/L Excluded | ||||||||||
|
Fried et al. (2019) Regularized: 2 Covariates |
3.4% | x | x | .03 (85%) | .04 (79%) | .08 (99%) | x | x | x | x |
|
Fried et al. (2019) Regularized: All Covariates |
17.3% | x | x | .02 (46%) | .03 (51%) | x | x | x | x | x |
| Regularized: 2 Covariates | 3.7 % | x | x | x | .03 (95%) | .05 (63%) | x | x | x | x |
| Regularized: All Covariates | 21.5 % | x | x | x | x | x | x | x | x | x |
| Nonregularized: 2 Covariates | 4.1 % | x | .02 (63%) | x | .05 (100%) | .07 (96%) | x | x | x | x |
| Nonregularized: All Covariates | 21.6 % | x | x | x | x | .02 (61%) | x | .03 (80%) | −.02 (53%) | x |
| CRP > 10 mg/L Included | ||||||||||
| Regularized: 2 Covariates | 5.9 % | x | x | x | .06 (95%) | .08 (100%) | x | x | x | x |
| Regularized: All Covariates | 28.8 % | x | x | x | .02 (38%) | .03 (58%) | x | x | x | x |
| Nonregularized: 2 Covariates | 6.0 % | x | x | x | .07 (100%) | .09 (100%) | −.01 (67%) | x | x | x |
| Nonregularized: All Covariates | 29.1 % | x | x | x | .02 (67%) | .04 (81%) | x | .03 (72%) | −.02 (66%) | x |
Note: x = no edge between CRP and this symptom, % of 500 bootstraps for which the edge weight was non-zero in parentheses
Figure 1. Regularized, two covariate network models of CRP and depression criteria.
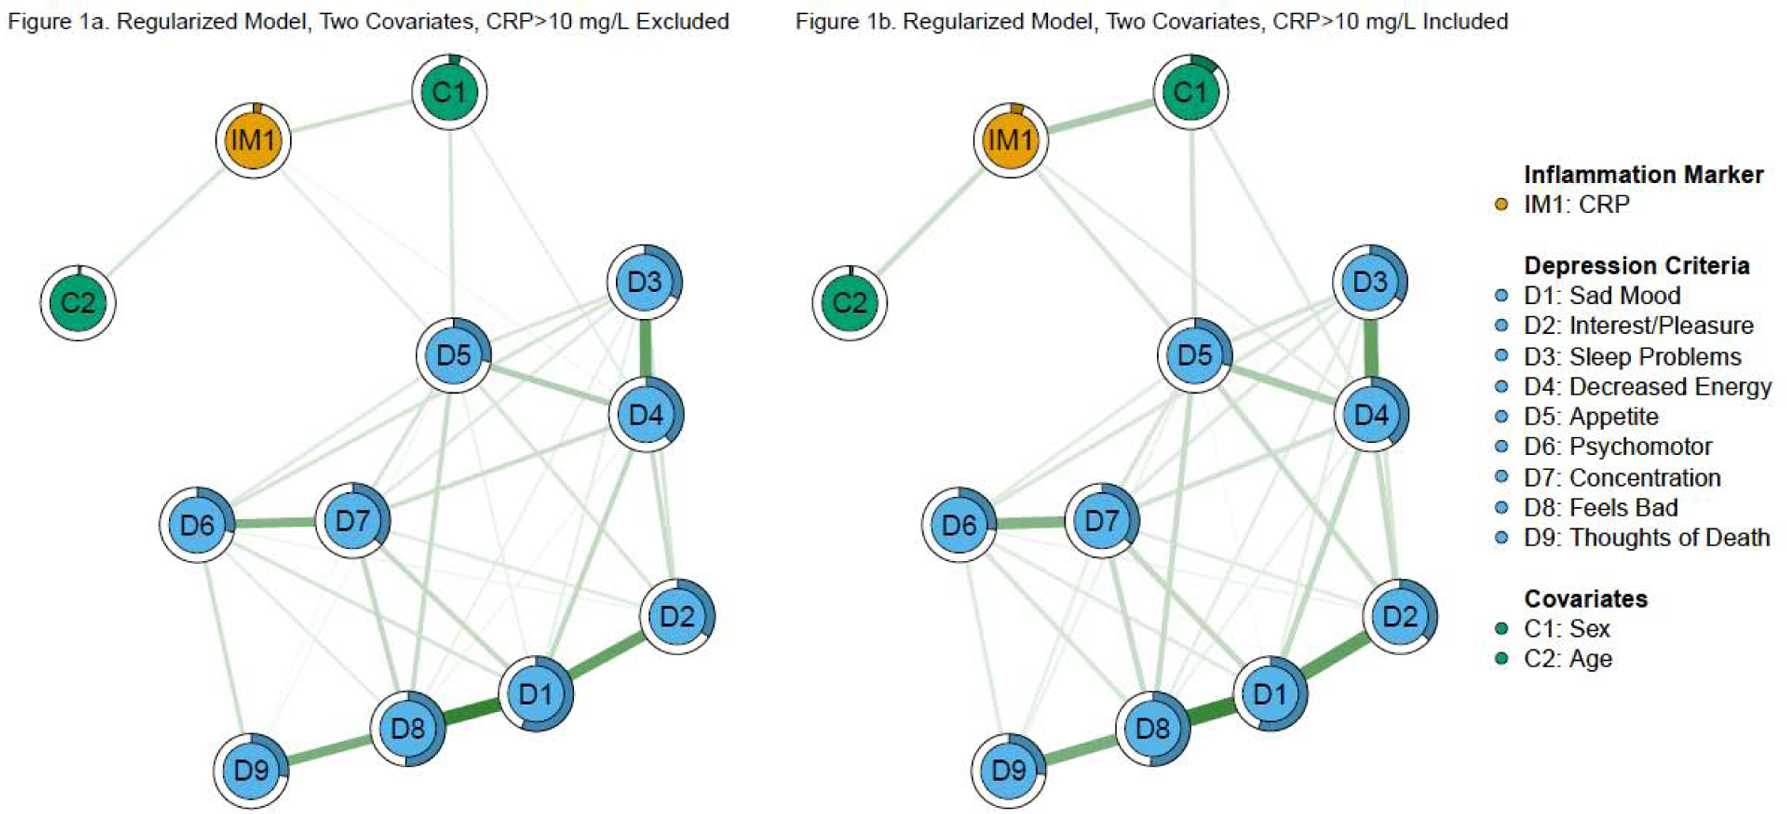
Note: Green edges in the networks depict positive associations, red edges represent negative associations, and thicker/more saturated edges depict stronger associations.
Results were comparable when the model was re-estimated including participants with CRP > 10 mg/L (Figure 1b). CRP was associated with fatigue and greater changes in appetite (nonzero in 95% and 100% of bootstraps, respectively), with greater stability and edge weights. CRP predictability (5.9%) was slightly higher compared to the identical model excluding CRP > 10 mg/L. Both models were identical when re-estimated with gamma = .25.
Controlling for sex, age, alcohol use, exercise, smoking status, BMI, and number of chronic diseases
In the second direct replication model (regularized networks excluding CRP > 10 mg/L, Figure 2a), there were no CRP—criterion edges (CRP—fatigue and CRP—changes in appetite were nonzero in only 19% and 31% of bootstraps, respectively). In Fried et al. (2019), both CRP—sleep problems and CRP—fatigue were robust to additional covariates. Predictability of CRP was higher in this sample (21.5%) compared to the original study (17.3%). Because there were fewer CRP—depression edges in this sample, this difference is driven by stronger associations between CRP and the covariates in this model.
Figure 2. Regularized, total covariate network models of CRP and depression criteria.
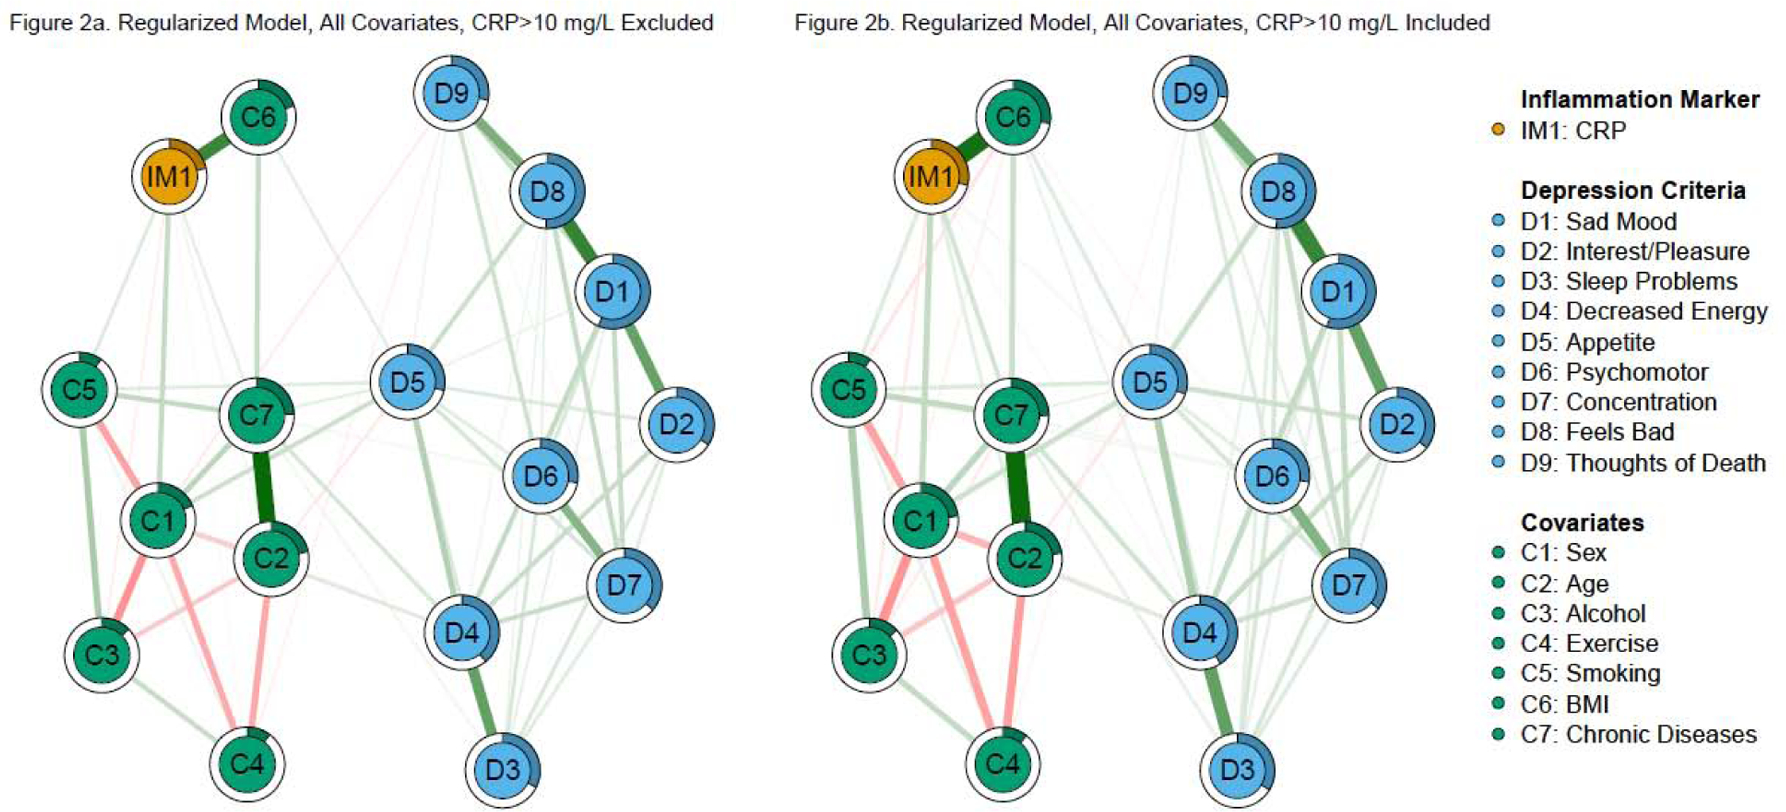
Note: Green edges in the networks depict positive associations, red edges represent negative associations, and thicker/more saturated edges depict stronger associations.
Unlike the model without participants with CRP > 10 mg/L, the model with these participants included retained the associations between CRP and fatigue and changes in appetite (Figure 2b). However, these edges were notably smaller and less stable than in the model with fewer covariates (nonzero in 38% and 58% of bootstraps, respectively). CRP predictability (28.8%) was higher compared to the identical model excluding CRP > 10 mg/L. Both models were almost identical when re-estimated with gamma = .25 (r > .99).
Nonregularized Networks
Controlling for sex and age
Fried et al. (2019) did not re-estimate the above models without regularization (although they did estimate nonregularized versions of other models). In the nonregularized model including sex and age in this study (Figure 3a), CRP still was associated with fatigue and greater changes in appetite (which were nonzero in 100% and 96% of the bootstrapped analyses, respectively). CRP also was associated with greater anhedonia (nonzero in 63% of the bootstraps). Predictability for CRP (4.1%) was slightly higher compared to the regularized model.
Figure 3. Nonregularized, two covariate network models of CRP and depression criteria.
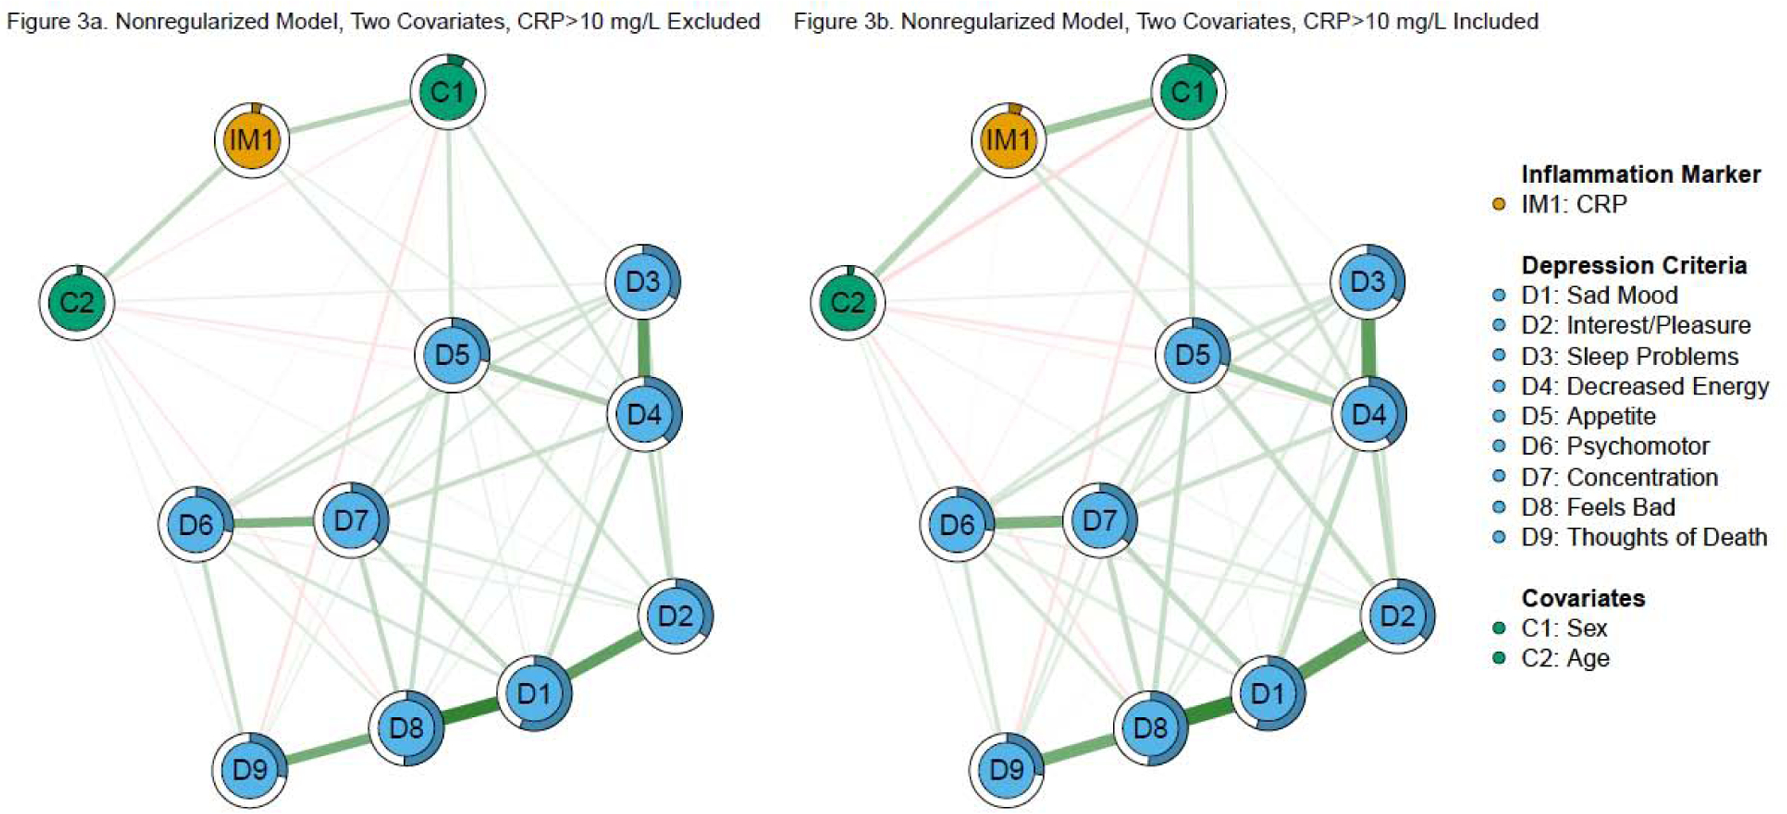
Note: Green edges in the networks depict positive associations, red edges represent negative associations, and thicker/more saturated edges depict stronger associations.
Nonregularized models including CRP > 10 mg/L (Figure 3b) also had highly stable associations with fatigue and greater changes in appetite (each was nonzero in all 500 bootstraps). Both edge weights were larger than the previous model. Unlike the model excluding CRP > 10 mg/L, CRP also was associated with fewer psychomotor abnormalities (nonzero in 67% of bootstraps), but not anhedonia. Predictability for CRP (6.0%) was slightly higher compared to the identical model excluding CRP > 10 mg/L
Controlling for sex, age, alcohol use, exercise, smoking status, BMI, and number of chronic diseases
The nonregularized model excluding CRP > 10 mg/L with all covariates had three CRP—criterion edges (Figure 4a). Specifically, CRP was associated with greater changes in appetite, difficulty concentrating, and less feeling bad for oneself (nonzero in 61%, 80%, and 53% of bootstraps, respectively). Interestingly, although the CRP—fatigue association was not above the threshold in this model, it was nonzero in 57% of the bootstraps (a greater proportion than CRP—feeling bad for oneself). Predictability for CRP (21.6%) increased slightly compared to the regularized model.
Figure 4. Nonregularized, total covariate network models of CRP and depression criteria.
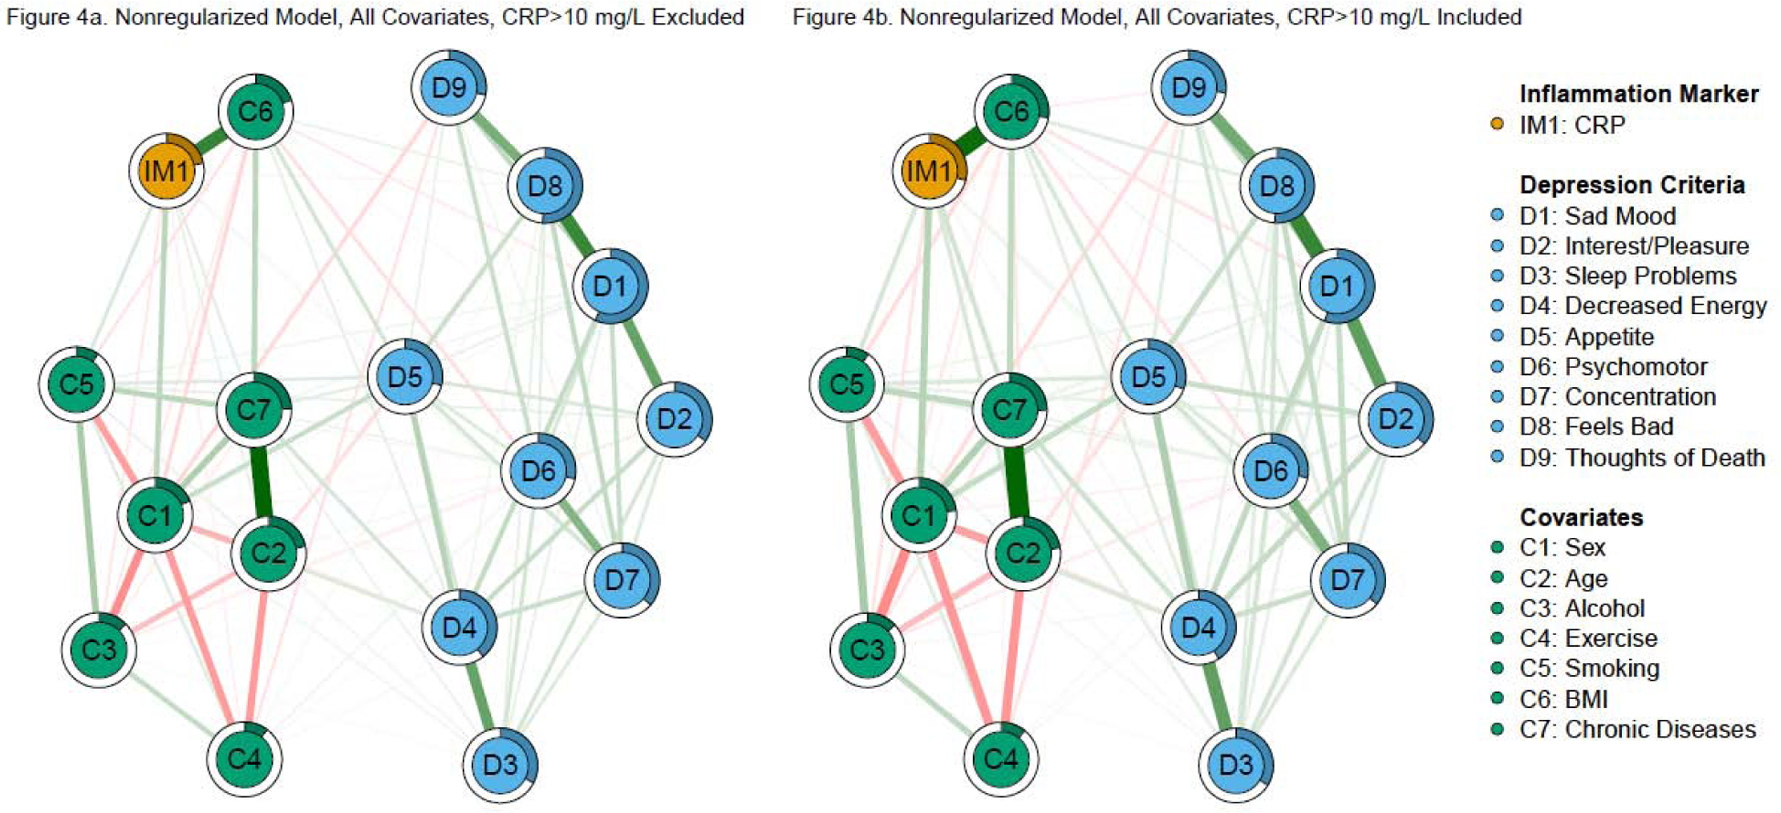
Note: Green edges in the networks depict positive associations, red edges represent negative associations, and thicker/more saturated edges depict stronger associations.
The nonregularized model including all of the covariates and participants with CRP > 10 mg/L had the most CRP—criterion edges (four, Figure 4b). Specifically, CRP was associated with fatigue, greater changes in appetite, difficulty concentrating, and less feeling bad for oneself (nonzero in 67%, 81%, 72%, 66% of bootstraps, respectively). Predictability for CRP (29.1%) was higher compared to the identical model excluding CRP > 10 mg/L.
Discussion
Depression is a highly heterogeneous disorder (e.g., Fried, 2017) and as psychiatry adopts a transdiagnostic approach in classifying mental illness, there is a heightened focus on identifying behavioral phenotypes (e.g., Research Domain Criteria [RDoC]; Insel et al., 2010). Increasingly, it has been recognized that analysis at the symptom, rather than diagnostic, level will drive progress in the field of immunopsychiatry (Felger et al., 2018; Horn et al., 2020; Moriarity & Alloy, in press). One promising analytic approach for this venture is network analysis, which identifies variable—variable (i.e., CRP—symptom) associations that are independent of all other variables in the network. However, the replicability of networks has been questioned (Forbes et al., 2017), concerns that might be particularly valid when comparing variables from different measurement domains (e.g., biological and self-report) due to attenuated effect sizes. Thus, the present study sought to replicate Fried and colleagues’ (2019) application of network analysis to the inflammatory phenotyping of depression criteria.
The current study provides further evidence that non-specific inflammation (i.e., CRP) is not a unilateral correlate of all depressive criteria. Specifically, Fried et al. (2019) found that CRP was linked to changes in sleep, fatigue, and changes in appetite when controlling for sex and age, but only changes in sleep and fatigue when controlling for all covariates. Direct replications also found associations with fatigue and changes in appetite when controlling for sex and age, but there were no CRP—criterion associations when including all covariates in these models. However, out of the six extended models, every model had an association between CRP and changes in appetite and only one model was missing the link between CRP and fatigue. The link between CRP and sleeping problems was not observed in any of our models. Additionally, this study extends the previous analyses by investigating two important analytical decisions: the use of regularized vs. nonregularized networks (which Fried et al. (2019) did, but only for their most complex models) and the removal of individuals with CRP > 10 mg/L. Model comparisons found that the CRP—criterion associations were strongest and most stable when using nonregularized networks and including participants with elevated CRP. These findings may help enhance our understanding of the etiology and presentation of depressive disorders, refine future treatment planning, and inform the design of future studies.
CRP and Depression Criteria
Results demonstrate that fatigue and appetite changes may be depression criteria with inflammatory underpinnings. There are several reasons why fatigue and appetite changes may be more characterized by immunological disruption relative to other depression criteria. Fatigue and appetite changes are well-established sickness behaviors in animal models of depression (Hart, 1988). Sickness behaviors (e.g.., fatigue, appetite changes, anhedonia), which are primarily somatic in nature, are critical in preserving resources while fighting infections, and thus, are theorized to have a stronger immunological component relative to other depression criteria (e.g., negative self-referential thoughts, concentration difficulties, thoughts of death; Dantzer et al., 2008).
In animal studies, causal links between inflammation and increased fatigue have been established; hyperinflammation (induced via a lipopolysaccharide (LPS) injection) directly exacerbated fatigue in mice (Krzyszton et al., 2008). In depressed humans, preliminary studies demonstrate that CRP is associated with fatigue and low energy, above and beyond other symptoms of depression (Jokela et al., 2016; White et al., 2017). One study found that CRP levels were 40% higher in elderly women reporting fatigue relative to those with no reported fatigue; however, this finding did not extend to the men in the study (Valentine et al., 2009), indicating that there may be sex differences underlying these relationships.
If replicated, such findings carry significant clinical implications. Fatigue is an important treatment target specifically because it is compounded by several environmental and health conditions germane to depression, including physical activity, sleep quality, sex, and health conditions (Valentine et al., 2009). Fatigue also often is a residual symptom for recovering individuals and is less responsive to traditional antidepressant therapies (Fava et al., 2014). Importantly, elevated inflammation also is associated with treatment resistant depression (Yang et al., 2019). Although nascent, researchers have begun to explore whether specific depression treatment strategies that improve fatigue, such as behavioral activation, also lower inflammation (Euteneuer et al., 2017). Among participants with elevated CRP, Euteneuer and colleagues (2017) found that patients experienced a decrease in CRP levels following a cognitive behavioral therapy (CBT) that specifically emphasized exercise relative to a more standard CBT approach. Results should be interpreted with caution given the small sample size, but provide an important example of how basic research findings are being translated to refine strategies to target treatment-resistant aspects of depression and its correlates.
These findings also replicated Fried et al. (2019) and other work (e.g., Jokela et al., 2016) to find that CRP is associated with appetite changes. However, neither study’s measures elucidate whether CRP is specifically associated with decreases in appetite, increases in appetite, or both. Some studies have found that CRP is elevated with neurovegetative symptoms that included decreased appetite (e.g., Duivis et al., 2015; Elovainio et al., 2009), but the majority of extant research supports an association between CRP and increased appetite. For example, several studies have found CRP to be elevated in atypical depression (characterized by increased appetite and hypersomnia) compared to melancholic depression (characterized by loss of appetite and insomnia; Glaus et al., 2014; Hickman et al., 2014). There also is evidence that depressed individuals with increased appetite have the highest levels of CRP (Lamers et al., 2018). In a study that compared depressed individuals with increased appetite to depressed individuals with decreased appetite, and to healthy controls, only depressed participants with increased appetite demonstrated higher levels of CRP and other inflammatory markers (Simmons et al., 2018). Although the majority of evidence indicates that CRP is associated with increased appetite in depression, it is possible that this relationship is conditional on third variables. For example, Andréasson and colleagues (2007) suggest that differences in HPA axis and CRF abnormalities in melancholic vs. atypical depression (Gold et al., 2002) might account for this discrepancy. Regardless, the current study provides additional evidence for the link between immune and metabolic signaling pathways, which might influence changes in appetite and eating behaviors in individuals with depression (Cosgrove et al., 2020). Given established bidirectional relationships between depression and changes in appetite/weight (e.g., obesity; Pan et al., 2012), longitudinal data (with more nuanced measures of appetite/eating behaviors) is necessary to evaluate the role inflammation might play.
Nonregularized models resulted in additional nonzero edges. Specifically, when individuals with CRP > 10 mg/L were excluded, CRP was associated with anhedonia when covarying for sex and age. This is the only model within which we found this association (other than the supplementary results with the subsetted sample of adults with PHQ-9 scores greater than, or equal to, eight, described below), and it was on the lower end of stability seen in these models; however, it is important to note that the multifaceted nature of anhedonia was not captured by the PHQ-9 (it asked whether the participant “Had little interest in doing things”). As there is evidence that CRP is associated positively with anhedonia (Felger et al., 2016; Moriarity et al., 2019) and a variety of other reward abnormalities (Haroon et al., 2016; Moriarity et al., 2020b), further research investigating specific facets of anhedonia (e.g., anticipatory vs. consummatory) is warranted.
Nonregularized models including individuals with CRP > 10 mg/L also had additional edges. Specifically, the model only accounting for sex and age had an association between CRP and fewer psychomotor difficulties. Many of the considerations described for the anhedonia finding apply here (lack of internal replication, relatively low stability, lack of measured distinct criterion facets). The inclusion of both psychomotor agitation and retardation particularly is problematic as they are antithetical to one another, and currently, there only is evidence for an association between CRP and psychomotor retardation (see Majd et al., 2020 for a review). Majd and colleagues also describe several additional measurement issues in this literature (lack of distinction between physical and cognitive slowing, lack of use of objective measures), which should be addressed in future research. In conclusion, this study does not provide strong support for an association between CRP and fewer psychomotor difficulties.
Finally, two additional CRP—criterion associations were present in both nonregularized models with all covariates (i.e., including and excluding CRP > 10 mg/L). Specifically, CRP was associated with greater difficulty concentrating and less feeling bad for oneself. There is no previous empirical support for an association between CRP and lack of negative self-thought, and it was the least stable edge in both models it appeared in; thus, it should be interpreted with extreme caution. However, the association between CRP and difficulty concentrating was stable and consistent with previous research (Krogh et al., 2014). Importantly, unlike Krogh and colleagues, the relationship between CRP and cognitive difficulties was robust to accounting for other criteria of depression.
Impact of Nonregularization and Including CRP > 10 mg/L
There is evidence that nonregularized network models are preferable over regularized models for psychopathology research (Williams et al., 2019). In biological psychiatry, this is exacerbated by concerns about measurement domain-specific variance downward biasing biomarker—self-report estimates. Consistent with this rationale, Fried et al. (2019) re-estimated their most complex model without regularization; however, they did not investigate the impact of this decision on the models replicated here. We included both regularized and nonregularized models in this study. The associations between CRP and fatigue and changes in appetite were present in all nonregularized models, except the nonregularized model excluding individuals with CRP > 10 mg/L, which was missing the CRP—fatigue association. However, despite this lack of an association in the model, bootstrapped analyses indicated that it was present in the majority of bootstraps estimated (57%). This inconsistency, along with the fact that this edge was present in nine of ten models (eight from this study and two from Fried et al. (2019)), does little to diminish confidence in this association. Importantly, edge weights between CRP and depression criteria were larger and more stable, and predictability of CRP was higher, in nonregularized vs. regularized models, supporting their use in this research.
This study also extends Fried et al. (2019) by estimating models with and without individuals with CRP values greater than 10 mg/L. It is not uncommon that immunopsychiatry studies exclude individuals with CRP levels above 10 mg/L, as this cutoff can be indicative of acute infection (Bell et al., 2017; de Ferranti et al., 2006). However, as discussed in a recent commentary by Mac Giollabhui et al. (2020), this might not be an appropriate decision for every research question, a recommendation also highlighted in a recent meta-analysis focused on methodological decisions for inflammation-related research (Horn et al., 2018). As theory about the relationship between inflammation and depression focuses on those with elevated inflammation, excluding these participants might remove those who are most at risk for psychopathology secondary to inflammation. This is particularly true if the relationship between inflammation and depression is more categorical (i.e., only present in those who are “inflamed”) rather than continuous (i.e., an increase in inflammation leads to an increase in symptoms, regardless of the amount of inflammation itself). Results from the models including CRP > 10 mg/L largely mirror the results with these participants removed, except that the associations between CRP and fatigue/changes in appetite were present in all models. Additionally, the CRP—criterion edges were stronger, more stable, more consistent, and CRP had higher predictability in the models including CRP > 10 mg/L, supporting the inclusion of these participants in these analyses. One potential explanation for these differences is that the CRP—depression relationship might be moderated by sample characteristics associated with increased likelihood of having CRP > 10 mg/L in this sample (e.g., being female, less exercise). Alternatively, it might be that removing these individuals with CRP > 10 mg/L removes those for whom the CRP—criterion relationships are the strongest. Or, these discrepancies might be the result of decreased power when excluding participants. Consequently, this study provides strong evidence that removing individuals with CRP > 10 mg/L might attenuate CRP—depression criteria associations and that studies testing the association between CRP and depression criteria should include participants with CRP > 10 mg/L and remove these participants as a sensitivity analysis, rather than the other way around. However, to fully characterize the inflammatory characteristics of a sample, we suggest to, at the very least, always report the proportion of the sample above this cut-off (at least until better cut-offs are established, as this might be an antiquated cut-off (Mac Giollabhui et al., 2020)).
Strengths and Weaknesses
In addition to these extensions, this study has several notable strengths. First, it consists of a larger (by 811 or 1,143 participants, depending on the model), and more racially diverse sample than the original sample studied by Fried et al. (2019), improving upon generalizability. However, it is important to note that there is likely more variability in depression in the Fried et al. (2019) dataset than this NHANES dataset, because it included healthy cases, cases with past depression, and cases with current depression, whereas the NHANES dataset is a population-based dataset. Greater variability might help some effects be detected (e.g., the CRP—sleeping problems association that was not observed in our study), although it is unclear whether the differences in variability would influence power to a comparable degree than the greater sample size. Second, given sex differences in CRP, depression, and the relationship between the two (Kessler, 2006; Lakoski et al., 2006; Moriarity et al., 2019), it is important to note that the data used for this project had a more equal sex-distribution (the original study’s sample was 65% female and the present study’s sample was 47.1% female.). Third, it is important for research to investigate replicability cross-culturally, which this study accomplished by replicating results from a Dutch sample in a sample from the United States. Relatedly, this study investigated replicability of results in a primarily clinical dataset (NESDA) with a primarily nonclinical dataset (NHANES). Additionally, because this study was in a community sample, it is less susceptible to Berkson’s bias (for a discussion of Berkson’s bias and psychological networks see de Ron et al., 2019) induced by conditioning on diagnostic status (which could result in CRP—depression criterion relationships conditioned on number of other symptoms, the presence of an “A criterion”, duration, and impairment/distress). However, we understand that some readers would be interested in seeing these networks in a sample of clinically depressed participants. Although no diagnostic interview was administered, the nonregularized, CRP > 10 mg/L models have been re-estimated with the 444 participants with a PHQ-9 score greater than or equal to eight (the lowest cut-off score in the meta-analysis by Manea et al., 2012). Results are reported and discussed in the Supplemental Results and Discussion. Finally, although the depression measure used in this study had three items that were double-barreled, which reduces clarity of results (which is reiterated below), it is an improvement over Fried et al. (2019), which had four variables that were compounded across several items (the most severely endorsed out of two items were compounded to create the appetite/weight variable, two were compounded for the anhedonia variable, and two were compounded for the psychomotor difficulties variable), resulting in lack of clarity about what item was modeled for which participants. Additionally, Fried et al. (2019) collapsed items measuring changes in weight and changes in appetite, which provides less clarity than the single item measuring changes in appetite used in this study. Unlike Fried et al. (2019), this issue was not applicable to the anhedonia variable modeled in this study.
However, this study must be considered in light of several limitations. First, NHANES does not have several of the inflammatory proteins (i.e., IL-6, tumor necrosis factor-α) or symptoms beyond the nine DSM criteria (e.g., interpersonal sensitivity), precluding replication of all models in Fried et al. (2019). Relatedly, some might argue the use of different measures for criteria/covariates is a weakness of this replication. Although this prevents direct replication, similarity between results ameliorates concerns about Fried et al.’s (2019) results being measure specific. Further, several DSM depression criteria are multi-faceted in ways that were not accounted for by the PHQ-9. For example, increases/decreases in appetite and weight are considered the same DSM criterion; however, the depression measure in this study only measured changes in appetite (agnostic of the direction of this change). Similarly, three of the items (changes in appetite, difficulty sleeping, and psychomotor difficulties) were double-barreled, reducing clarity of results. Additionally, both inflammation and depression can be influenced by different types of medication; however, subgrouping based on medication status would have led to power concerns given the small effect sizes and large power requirements of network analyses. A similar point can be made about subgrouping based on disease state. Although we control for total ongoing diseases in our models, not all diseases are equally associated with inflammatory abnormalities or depression. We prioritized defining our variables as consistently as possible with Fried et al. (2019) to maximize this study’s utility as a replication study because, to our knowledge, there are no published network replications in immunopsychiatry or biological psychiatry. However, future work would benefit from controlling for specific diseases associated with the variables modeled. Also, this study was cross-sectional in nature. Thus, the causal direction of effects cannot be inferred. Instead, these results represent patterns of concurrence between CRP and various depression criteria. This is an important first step, and it is promising that most of the results replicated, but longitudinal research is necessary to advance this area of research. Finally, although not a limitation, it should be acknowledged that the CRP—criterion associations observed in this study were small. However, as the inflammation—depression relationship appears to operate in a positive feedback loop (Moriarity et al., 2020a), small effects can compound over time.
The primary discrepancies between these results and Fried et al. (2019) are that CRP was not associated with sleep problems in any of these models and that none of the CRP—criterion edges were retained in the most conservative model (CRP > 10 mg/L excluded, regularized, including all covariates). These differences might be attributable to sample characteristics such as nationality (United States vs. Netherlands), racial heterogeneity (this study had greater racial diversity), sex make-up (this study had a more equal distribution of males/females), and/or clinical severity (this study was a population-based sample, Fried et al. (2019) primarily consisted of individuals with current or past depression and/or anxiety diagnoses). In particular, evidence that CRP is a stronger predictor of somatic problems (including sleep disturbance) in women (Niles et al., 2018), suggests Fried et al.’s (2019) greater proportion of females (65% to 47%) might account for the lack of this association in our models. Additionally, higher CRP predictability in our model with all covariates excluding CRP > 10 mg/L (which found no CRP—criterion associations) than the CRP predictability of the same model in Fried et al. (2019) (despite finding CRP—criterion associations) suggests that CRP had a stronger association with covariates in this sample, resulting in less variance to be explained by criteria. Discrepancies also might be a result of measures used and how they were handled. For example, the measure used in this study had one sleep question that asked whether a participant was “having trouble sleeping or sleeping too much”, whereas Fried et al. (2019) selected the most severely rated of four sleep-related items. Similar item selection was done for anhedonia, changes in appetite, and psychomotor difficulties in Fried et al. (2019). Finally, the CRP—sleep finding could have been a false positive, as it was highly unstable (exactly zero in 54% of bootstraps) in Fried et al.’s model with all covariates (however, it is important to note that it was stable in the model only controlling for age and sex, present in 85% of bootstraps). A similar note should be made for the CRP—fatigue association in Fried et al.’s (2019) model with all covariates (exactly zero in 49% of bootstraps), which also didn’t replicate in this study.
Conclusion
Leveraging translational research and transdiagnostic research methodologies (e.g., network analysis) is critical to deepening our understanding of the immunological underpinnings of depression and applying this knowledge to improve diagnosis and treatment. The results of this study largely corroborate the conclusions of Fried et al. (2019), supporting the utility of network analyses using biological and self-report data. Specifically, CRP consistently was associated with higher levels of appetite change and fatigue across both studies, suggesting that these criteria might be targetable via anti-inflammatory treatments. However, it is important to note that this study did not differentiate between increases and decreases in appetite; thus, further research is needed to identify what aspect of appetite change is driving associations. Methodologically, results of this study suggest that the exclusion of individuals with CRP values >10 mg/L might attenuate associations between CRP and depression symptoms and supports the use of nonregularized vs. regularized network models in biological psychiatry research testing unique associations between biomarkers and diagnostic criteria. Future studies should leverage longitudinal data, utilize more nuanced self-report measures of criteria, include objective measures of relevant variables (e.g., psychomotor retardation), and incorporate these approaches into treatment evaluation research.
Supplementary Material
CRP is consistently associated with fatigue and changes in appetite
CRP might be associated with anhedonia and difficulty concentrating
Exclusion of CRP > 10 mg/L attenuates CRP—symptom associations
Nonregularized networks should be considered in immunopsychiatry
Funding:
Daniel P. Moriarity was supported by National Research Service Award F31MH122116. Marin M. Kautz was supported by National Science Foundation Graduate Research Fellowship 1650457. Lauren B. Alloy was supported by National Institute of Mental Health grant R01MH101168.
Footnotes
Publisher's Disclaimer: This is a PDF file of an unedited manuscript that has been accepted for publication. As a service to our customers we are providing this early version of the manuscript. The manuscript will undergo copyediting, typesetting, and review of the resulting proof before it is published in its final form. Please note that during the production process errors may be discovered which could affect the content, and all legal disclaimers that apply to the journal pertain.
References
- Armstrong T, Bull F, 2006. Development of the World Health Organization Global Physical Activity Questionnaire (GPAQ). J. Public Health (Bangkok) 14, 66–70. 10.1007/s10389-006-0024-x [DOI] [Google Scholar]
- Balázs J, Miklõsi M, Keresztény Á, Hoven CW, Carli V, Wasserman C, Apter A, Bobes J, Brunner R, Cosman D, Cotter P, Haring C, Iosue M, Kaess M, Kahn JP, Keeley H, Marusic D, Postuvan V, Resch F, Saiz PA, Sisask M, Snir A, Tubiana A, Varnik A, Sarchiapone M, Wasserman D, 2013. Adolescent subthreshold-depression and anxiety: Psychopathology, functional impairment and increased suicide risk. J. Child Psychol. Psychiatry Allied Discip 54, 670–677. 10.1111/jcpp.12016 [DOI] [PubMed] [Google Scholar]
- Bell JA, Kivimäki M, Bullmore ET, Steptoe A, Bullmore E, Vértes PE, Cardinal R, Richardson S, Leday G, Freeman T, Hume D, Regan T, Wu Z, Pariante C, Cattaneo A, Zuszain P, Borsini A, Stewart R, Chandran D, Carvalho Livia A, Bell Joshua A, Souza-Teodoro LH, Perry H, Harrison N, Drevets W, Wittenberg GM, Sun Y, Jones D, Bullmore E, Khan S, Stylianou A, Henderson RB, Carvalho LA, 2017. Repeated exposure to systemic inflammation and risk of new depressive symptoms among older adults. Transl. Psychiatry 7, e1208 10.1038/tp.2017.155 [DOI] [PMC free article] [PubMed] [Google Scholar]
- Borsboom D, Fried EI, Epskamp S, Waldorp LJ, van Borkulo CD, van der Maas HLJ, Cramer AOJ, 2017. False alarm? A comprehensive reanalysis of “evidence that psychopathology symptom networks have limited replicability” by Forbes, Wright, Markon, and Krueger (2017). J. Abnorm. Psychol 126, 989–999. 10.1037/abn0000306 [DOI] [PubMed] [Google Scholar]
- Boyle CC, Ganz PA, Van Dyk KM, Bower JE, 2017. Inflammation and attentional bias in breast cancer survivors. Brain Behav. Immun 66, 85–88. 10.1016/j.physbeh.2017.03.040 [DOI] [PMC free article] [PubMed] [Google Scholar]
- Centers for Disease Control and Prevention, 2009. National Health and Nutrition Examination Survey (NHANES) stored biologic specimens: Guidelines for proposals to use samples and proposed cost schedule. [Google Scholar]
- Chen TC, Clark J, Riddles MK, Mohadjer LK, Fakhouri THI, 2018. Vital and Health Statistics National Health and Nutrition Examination Survey , 2015 − 2018 : Sample Design and Estimation Procedures. [PubMed] [Google Scholar]
- Chu AL, Stochl J, Lewis G, Zammit S, Jones PB, Khandaker GM, 2019. Longitudinal association between inflammatory markers and specific symptoms of depression in a prospective birth cohort. Brain. Behav. Immun 76, 74–81. 10.1016/j.bbi.2018.11.007 [DOI] [PMC free article] [PubMed] [Google Scholar]
- Cosgrove KT, Burrows K, Avery JA, Kerr KL, DeVille DC, Aupperle RL, Teague TK, Drevets WC, Simmons WK, 2020. Appetite change profiles in depression exhibit differential relationships between systemic inflammation and activity in reward and interoceptive neurocircuitry. Brain. Behav. Immun 83, 163–171. 10.1016/j.bbi.2019.10.006 [DOI] [PMC free article] [PubMed] [Google Scholar]
- Dantzer R, O’Connor JC, Freund GG, Johnson RW, Kelley KW, 2008. From inflammation to sickness and depression: When the immune system subjugates the brain. Nat. Rev. Neurosci 9, 46–56. 10.1038/nrn2297 [DOI] [PMC free article] [PubMed] [Google Scholar]
- de Ferranti SD, Gauvreau K, Ludwih DS, Newburger JW, Rifai N, 2006. Inflammation and changes in metabolic syndrome abnormalities in US adolescents: Findings from the 1988–1994 and 1999–2000 National health and nutrition examination surveys. Clin. Chem 52, 1325–1330. [DOI] [PubMed] [Google Scholar]
- de Ron J, Fried EI, Epskamp S, 2019. Psychological networks in clinical populations: Investigating the consequences of Berkson’s bias. Psychol. Med 10.1017/S0033291719003209 [DOI] [PubMed] [Google Scholar]
- Dhabhar FS, Burke HM, Epel ES, Mellon SH, Rosser R, Reus VI, Wolkowitz OM, 2009. Low serum IL-10 concentrations and loss of regulatory association between IL-6 and IL-10 in adults with major depression. J. Psychiatr. Res 43, 962–969. 10.1016/j.jpsychires.2009.05.010 [DOI] [PubMed] [Google Scholar]
- Dooley LN, Kuhlman KR, Robles TF, Eisenberger NI, Craske MG, Bower JE, 2018. The role of inflammation in core features of depression: Insights from paradigms using exogenously-induced inflammation. Neurosci. Biobehav. Rev 94, 219–237. 10.1016/j.neubiorev.2018.09.006 [DOI] [PMC free article] [PubMed] [Google Scholar]
- Dowlati Y, Herrmann N, Swardfager W, Liu H, Sham L, Reim EK, Lanctôt KL, 2010. A meta-analysis of cytokines in major depression. Biol. Psychiatry 67, 446–457. 10.1016/j.biopsych.2009.09.033 [DOI] [PubMed] [Google Scholar]
- Du Clos T, 2000. Function of C-reactive protein. Ann. Med 32, 274–278. [DOI] [PubMed] [Google Scholar]
- Duivis HE, Kupper N, Vermunt JK, Penninx BW, Bosch NM, Riese H, Oldehinkel AJ, de Jonge P, 2015. Depression trajectories, inflammation, and lifestyle factors in adolescence: The Tracking Adolescents’ Individual Lives Survey. Heal. Psychol 34, 1047–1057. 10.1037/hea0000210 [DOI] [PubMed] [Google Scholar]
- Elovainio M, Aalto AM, Kivimäki M, Pirkola S, Sundvall J, Lönnqvist J, Reunanen A, 2009. Depression and C-reactive protein: Population-based health 2000 study. Psychosom. Med 71, 423–430. 10.1097/PSY.0b013e31819e333a [DOI] [PubMed] [Google Scholar]
- Epskamp S, Borsboom D, Fried EI, 2017. Estimating psychological networks and their accuracy: A tutorial paper. Behav. Res. Methods 50, 195–212. 10.3758/s13428-017-0862-1 [DOI] [PMC free article] [PubMed] [Google Scholar]
- Epskamp S, Fried EI, 2018. A Tutorial on Regularized Partial Correlation Networks. Psychol. Methods 23, 617–634. [DOI] [PubMed] [Google Scholar]
- Fava M, Ball S, Nelson JC, Sparks J, Konechnik T, Classi P, Dube S, Thase ME, 2014. Clinical relevance of fatigue as a residual symptom in major depressive disorder. Depress. Anxiety 31, 250–257. 10.1002/da.22199 [DOI] [PubMed] [Google Scholar]
- Felger JC, Haroon E, Miller AH, 2018. What’s CRP got to do with it? Tackling the complexities of the relationship between CRP and depression. Brain Behav. Immun 73, 163–164. 10.1016/j.bbi.2018.08.003 [DOI] [PubMed] [Google Scholar]
- Felger JC, Li Z, Haroon E, Woolwine BJ, Jung MY, Hu X, Miller AH, 2016. Inflammation is associated with decreased functional connectivity within corticostriatal reward circuitry in depression. Mol. Psychiatry 21, 1358–1365. 10.1038/mp.2015.168 [DOI] [PMC free article] [PubMed] [Google Scholar]
- Forbes MK, Wright AG, Markon KE, Krueger RF, 2017. Evidence that Psychopathology Symptom Networks have Limited Replicability. J. Abnorm. Psychol 126, 969–988. 10.1016/j.physbeh.2017.03.040 [DOI] [PMC free article] [PubMed] [Google Scholar]
- Foygel R, Drton M, 2010. Extended Bayesian information criteria for Gaussian graphical models, in: Advances in Neural Information Processing Systems 23: 24th Annual Conference on Neural Information Processing Systems 2010, NIPS 2010; pp. 604–612. [Google Scholar]
- Fried EI, von Stockert S, Haslbeck JMB, Lamers F, Schoevers RA, Penninx BWJH, 2019. Using network analysis to examine links between individual depressive symptoms, inflammatory markers, and covariates. Psychol. Med 10.31234/osf.io/84ske [DOI] [PubMed] [Google Scholar]
- Glaus J, Vandeleur CL, von Känel R, Lasserre AM, Strippoli MPF, Gholam-Rezaee M, Castelao E, Marques-Vidal P, Bovet P, Merikangas K, Mooser V, Waeber G, Vollenweider P, Aubry JM, Preisig M, 2014. Associations between mood, anxiety or substance use disorders and inflammatory markers after adjustment for multiple covariates in a population-based study. J. Psychiatr. Res 58, 36–45. 10.1016/j.jpsychires.2014.07.012 [DOI] [PubMed] [Google Scholar]
- Gold PW, Gabry KE, Yasuda MR, Chrousos GP, 2002. Divergent endocrine abnormalities in melancholic and atypical depression: Clinical and pathophysiologic implications. Endocrinol. Metab. Clin. North Am 31, 37–62. 10.1016/S0889-8529(01)00022-6 [DOI] [PubMed] [Google Scholar]
- Haapakoski R, Mathieu J, Ebmeier KP, Alenius H, Kivimäki M, 2015. Cumulative meta-analysis of interleukins 6 and 1β, tumour necrosis factor α and C-reactive protein in patients with major depressive disorder. Brain. Behav. Immun 49, 206–215. 10.1016/j.bbi.2015.06.001 [DOI] [PMC free article] [PubMed] [Google Scholar]
- Haroon E, Fleischer CC, Felger JC, Chen X, Woolwine BJ, Patel T, Hu XP, Miller AH, 2016. Conceptual convergence: increased inflammation is associated with increased basal ganglia glutamate in patients with major depression. Mol. Psychiatry 1–7. 10.1038/mp.2015.206 [DOI] [PMC free article] [PubMed] [Google Scholar]
- Hart BL, 1988. Biological basis of the behavior of sick animals. Neurosci. Biobehav. Rev 12, 123–137. 10.1016/S0149-7634(88)80004-6 [DOI] [PubMed] [Google Scholar]
- Haslbeck JMB, Waldorp LJ, 2020. mgm: Estimating Time-Varying Mixed Graphical. J. Stat. Softw 93, 1–46. [Google Scholar]
- Haslbeck JMB, Waldorp LJ, 2018. How well do network models predict observations? On the importance of predictability in network models. Behav. Res. Methods 50, 853–861. 10.3758/s13428-017-0910-x [DOI] [PMC free article] [PubMed] [Google Scholar]
- Hickman RJ, Khambaty T, Stewart JC, 2014. C-reactive protein is elevated in atypical but not nonatypical depression: Data from the National Health and Nutrition Examination Survey (NHANES) 1999–2004. J. Behav. Med 37, 621–629. 10.1007/s10865-013-9510-0 [DOI] [PubMed] [Google Scholar]
- Horn SR, Fisher PA, Pfeifer JH, Allen NB, Berkman ET, 2020. Levers and barriers to success in the use of translational neuroscience for the prevention and treatment of mental health and promotion of well-being across the lifespan. J. Abnorm. Psychol 129, 38–48. 10.1037/abn0000465 [DOI] [PMC free article] [PubMed] [Google Scholar]
- Horn SR, Long MM, Nelson BW, Allen NB, Fisher PA, Byrne ML, 2018. Replication and reproducibility issues in the relationship between C-reactive protein and depression: A systematic review and focused meta-analysis. Brain Behav. Immun 73, 85–114. 10.1016/j.bbi.2018.06.016 [DOI] [PMC free article] [PubMed] [Google Scholar]
- Howren MB, Lamkin DM, Suls J, 2009. Associations of depression with C-reactive protein, IL-1, and IL-6: a meta-analysis. Psychosom. Med 71, 171–186. 10.1097/PSY.0b013e3181907c1b [DOI] [PubMed] [Google Scholar]
- Insel T, Cuthbert B, Garvey M, Heinssen R, Pine D, Quinn K, Sanislow C, Wang P, 2010. Research Domain Criteria (RDoC): Toward a new classification framework for research on mental disorders. Am. J. Psychiatry Online 167, 748–751. 10.1176/appi.ajp.2010.09091379 [DOI] [PubMed] [Google Scholar]
- Jokela M, Virtanen M, Batty GD, Kivimäki M, 2016. Inflammation and Specific Symptoms of Depression. JAMA Psychiatry 73, 87 10.1001/jamapsychiatry.2015.1977 [DOI] [PubMed] [Google Scholar]
- Jones PJ, Williams DR, Mcnally RJ, 2019. Sampling variability is not nonreplication: A Bayesian reanalysis of Forbes, Wright, Markon, & Krueger. OSF Prepr 10.31234/osf.io/egwfj [DOI] [PubMed] [Google Scholar]
- Kessler RC, 2006. The epidemiology of depression among women. Women Depress. A Handb. Soc. Behav. Biomed. Sci 74, 22–38. 10.1017/CBO9780511841262.004 [DOI] [Google Scholar]
- Khandaker GM, Pearson RM, Zammit S, Lewis G, Jones PB, 2014. Association of serum interleukin 6 and C-reactive protein in childhood with depression and psychosis in young adult life a population-based longitudinal study. JAMA Psychiatry 71, 1121–1128. 10.1001/jamapsychiatry.2014.1332 [DOI] [PMC free article] [PubMed] [Google Scholar]
- Krishnadas R, Harrison NA, 2016. Depression phenotype, inflammation, and the brain: Implications for future research. Psychosom. Med 78, 384–388. 10.1097/PSY.0000000000000339 [DOI] [PubMed] [Google Scholar]
- Kroenke K, Spitzer RL, Williams JB, 2001. The PHQ-9: validity of a brief depression severity measure. J. Gen. Intern. Med 16, 606–613. [DOI] [PMC free article] [PubMed] [Google Scholar]
- Krogh J, Benros ME, Jørgensen MB, Vesterager L, Elfving B, Nordentoft M, 2014. The association between depressive symptoms, cognitive function, and inflammation in major depression. Brain. Behav. Immun 35, 70–76. 10.1016/j.bbi.2013.08.014 [DOI] [PubMed] [Google Scholar]
- Krzyszton CP, Sparkman NL, Grant RW, Buchanan JB, Broussard SR, Woods J, Johnson RW, 2008. Exacerbated fatigue and motor deficits in interleukin-10-deficient mice after peripheral immune stimulation. Am. J. Physiol. - Regul. Integr. Comp. Physiol 295, 1109–1114. 10.1152/ajpregu.90302.2008 [DOI] [PMC free article] [PubMed] [Google Scholar]
- Kushner I, Rzewnicki D, Samols D, 2006. What does minor elevation of C-reactive protein signify? Am. J. Med 119, 166.e17–166.e28. 10.1016/j.amjmed.2005.06.057 [DOI] [PubMed] [Google Scholar]
- Lakoski SG, Cushman M, Criqui M, Rundek T, Blumenthal RS, D’Agostino RB, Herrington DM, 2006. Gender and C-reactive protein: Data from the Multiethnic Study of Atherosclerosis (MESA) cohort. Am. Heart J 152, 593–598. 10.1016/j.ahj.2006.02.015 [DOI] [PubMed] [Google Scholar]
- Lamers F, Milaneschi Y, De Jonge P, Giltay EJ, Penninx BWJH, 2018. Metabolic and inflammatory markers: Associations with individual depressive symptoms. Psychol. Med 48, 1102–1110. 10.1017/S0033291717002483 [DOI] [PubMed] [Google Scholar]
- Liu H, Lafferty J, Wasserman L, 2009. The nonparanormal: Semiparametric estimation of high dimensional undirected graphs. J. Mach. Learn. Res 10, 2295–2328. 10.1184/r1/6610712 [DOI] [PMC free article] [PubMed] [Google Scholar]
- Loh P, Wainwright MJ, 2012. Structure estimation for discrete graphical models: Generalized covariance matrices and their inverses. Adv. Neural Inf. Process. Syst. 2087–2095 10.1214/13-AOS1162 [DOI] [Google Scholar]
- Mac Giollabhui N, Ellman LM, Coe CL, Byrne ML, Abramson LY, Alloy LB, 2020. To exclude or not to exclude: Considerations and recommendations for C-reactive protein values higher than 10 mg/L. Brain. Behav. Immun 10.1016/j.bbi.2020.01.023 [DOI] [PMC free article] [PubMed] [Google Scholar]
- Majd M, Saunders EFH, Engeland CG, 2020. Inflammation and the dimensions of depression: A review. Front. Neuroendocrinol 56 10.1016/j.yfrne.2019.100800 [DOI] [PubMed] [Google Scholar]
- Manea L, Gilbody S, McMillan D, 2012. Optimal cut-off score for diagnosing depression with the Patient Health Questionnaire (PHQ-9): a meta-analysis. Can. Med. Assoc. J 184, 191–196. 10.1503/cmaj.112004 [DOI] [PMC free article] [PubMed] [Google Scholar]
- Milaneschi Y, Lamers F, Berk M, Penninx BWJH, 2020. Depression Heterogeneity and Its Biological Underpinnings: Toward Immunometabolic Depression. Biol. Psychiatry 88, 369–380. 10.1016/j.biopsych.2020.01.014 [DOI] [PubMed] [Google Scholar]
- Miller GE, Cole SW, 2012. Clustering of depression and inflammation in adolescents previously exposed to childhood adversity. Biol. Psychiatry 72, 34–40. 10.1016/j.biopsych.2012.02.034. [DOI] [PMC free article] [PubMed] [Google Scholar]
- Moriarity DP, Alloy LB, 2020. Beyond diagnoses and total symptom scores: Diversifying the level of analysis in psychoneuroimmunology research. Brain. Behav. Immun 89, 1–2. 10.1016/j.bbi.2020.07.002 [DOI] [PMC free article] [PubMed] [Google Scholar]
- Moriarity DP, Kautz MM, Mac Giollabhui N, Klugman J, Coe CL, Ellman LM, Abramson LY, Alloy LB, 2020a. Bidirectional associations between inflammatory biomarkers and depressive symptoms in adolescents: Potential causal relationships. Clin. Psychol. Sci 8, 690–703. 10.1017/CBO9781107415324.004 [DOI] [PMC free article] [PubMed] [Google Scholar]
- Moriarity DP, Mac Giollabhui N, Ellman LM, Klugman J, Coe CL, Abramson LY, Alloy LB, 2019. Inflammatory proteins predict change in depressive symptoms in male and female adolescents. Clin. Psychol. Sci 7, 754–767. 10.1177/2167702619826586 [DOI] [PMC free article] [PubMed] [Google Scholar]
- Moriarity DP, Ng T, Titone MK, Chat IK, Nusslock R, Miller GE, Alloy LB, 2020b. Reward sensitivity and ruminative response styles for positive and negative affect interact to predict inflammation and mood symptomatology. Behav. Ther 51, 829–842. 10.1016/j.beth.2019.11.007 [DOI] [PMC free article] [PubMed] [Google Scholar]
- Niles AN, Smirnova M, Lin J, O’Donovan A, 2018. Gender differences in longitudinal relationships between depression and anxiety symptoms and inflammation in the health and retirement study. Psychoneuroendocrinology 95, 149–157. 10.1016/j.psyneuen.2018.05.035.Gender [DOI] [PMC free article] [PubMed] [Google Scholar]
- Pan A, Sun Q, Czernichow S, Kivimaki M, Okereke OI, Lucas M, Manson JE, Ascherio A, Hu FB, 2012. Bidirectional association between depression and obesity in middle-aged and older women. Int. J. Obes 36, 595–602. 10.1038/ijo.2011.111 [DOI] [PMC free article] [PubMed] [Google Scholar]
- Piccinelli M, Tessari E, Bortolomasi M, Piasere O, Semenzin M, Garzotto N, Tansella M, 1997. Efficacy of the Alcohol Use Disorders Identification Test as a screening tool for hazardous alcohol intake and related disorders in primary care: A validity study. Br. Med. J 314, 420–424. [DOI] [PMC free article] [PubMed] [Google Scholar]
- Raison CL, Miller AH, 2011. Is depression an inflammatory disorder? Current 13, 467–475. 10.1109/ICCEREC.2016.7814953 [DOI] [PMC free article] [PubMed] [Google Scholar]
- Rush AJ, Giles DE, Schlesser MA, 1996. The inventory of depressive symptomatology (IDS): Psychometric properties. Psychol. Med 26, 477–486. [DOI] [PubMed] [Google Scholar]
- Simmons WK, Burrows K, Avery JA, Kerr KL, Taylor A, Bodurka J, Potter W, Teague TK, Drevets WC, 2018. Appetite changes reveal depression subgroups with distinct endocrine, metabolic, and immune states. Mol. Psychiatry 1–12. 10.1038/s41380-018-0093-6 [DOI] [PMC free article] [PubMed] [Google Scholar]
- Team, R.C., 2013. R: A language and environment for statistical computing R Foundation for Statistical Computing. [Google Scholar]
- Tibshirani R, 1996. Regression Shrinkage and Selection via the Lasso. J. R. Stat. Soc 58, 267–288. [Google Scholar]
- Valentine RJ, McAuley E, Vieira VJ, Baynard T, Hu L, Evans EM, Woods JA, 2009. Sex differences in the relationship between obesity, C-reactive protein, physical activity, depression, sleep quality and fatigue in older adults. Brain. Behav. Immun 23, 643–648. 10.1016/j.bbi.2008.12.003 [DOI] [PubMed] [Google Scholar]
- Valkanova V, Ebmeier KP, Allan CL, 2013. CRP, IL-6 and depression: A systematic review and meta-analysis of longitudinal studies. J. Affect. Disord 150, 736–744. 10.1016/j.jad.2013.06.004 [DOI] [PubMed] [Google Scholar]
- White J, Kivimäki M, Jokela M, Batty GD, 2017. Association of inflammation with specific symptoms of depression in a general population of older people: The English Longitudinal Study of Ageing. Brain. Behav. Immun 61, 27–30. 10.1016/j.bbi.2016.08.012 [DOI] [PubMed] [Google Scholar]
- Williams DR, Rhemtulla M, Wysocki AC, Rast P, 2019. On Nonregularized Estimation of Psychological Networks. Multivariate Behav. Res 54, 719–750. 10.1080/00273171.2019.1575716 [DOI] [PMC free article] [PubMed] [Google Scholar]
- Yang C, Wardenaar KJ, Bosker FJ, Li J, Schoevers RA, 2019. Inflammatory markers and treatment outcome in treatment resistant depression: A systematic review. J. Affect. Disord 257, 640–649. 10.1016/j.jad.2019.07.045 [DOI] [PubMed] [Google Scholar]
- Zipf G, Chiappa M, Porter KS, Ostchega Y, Lewis BG, Dostal J, 2013. National Health and Nutrition Examination Survey: Plan and Operations, 1999 – 2010 [PubMed] [Google Scholar]
Associated Data
This section collects any data citations, data availability statements, or supplementary materials included in this article.