Abstract
In the present investigations, we construct a new mathematical for the transmission dynamics of corona virus (COVID‐19) using the cases reported in Kingdom of Saudi Arabia for March 02 till July 31, 2020. We investigate the parameters values of the model using the least square curve fitting and the basic reproduction number is suggested for the given data is ℛ0 ≈ 1.2937. The stability results of the model are shown when the basic reproduction number is ℛ0 < 1. The model is locally asymptotically stable when ℛ0 < 1. Further, we show some important parameters that are more sensitive to the basic reproduction number ℛ0 using the PRCC method. The sensitive parameters that act as a control parameters that can reduce and control the infection in the population are shown graphically. The suggested control parameters can reduce dramatically the infection in the Kingdom of Saudi Arabia if the proper attention is paid to the suggested controls.
Keywords: COVID‐19 mathematical model, global sensitivity analysis, numerical results, parameters estimations, real data, stability results
1. INTRODUCTION
The world is now facing a new fatal disease which is known as COVID‐19 caused mainly by the coronavirus. This virus was reported early in China city Wuhan and began to spread rapidly to the entire world. Due to the lockdown measure and control, the disease is now almost finished in China while the rest of the world is struggling to minimize its infections cases. It is documented that people suffered with coronavirus have the respiratory illness and recovered without any specific treatment. The people specially, the old age and those with underlying medical problems such as diabetes, cancer, chronic respiratory diseases, are cardiovascular disease are more considered to develop serious illness. In order to reduce the transmission of this virus and preventing from it, is the best possible way is of the well information about the (COVID‐19) virus, its causes and its spreads. In order to protect himself from this virus is to wash the hands regularly or the use of alcohol based rub, and avoid touching the face. Now, there is no specific treatment or vaccination for the (COVID‐19) but there are many ongoing trials in order to develop the vaccines and possible treatment mechanism [1].
The corona virus which is spread quickly more faster than a common flu virus, that is why the disease spread around the globe and become an epidemic. Most of the world countries have a large number of (COVID‐19) cases, where in some countries, such as United states, Italy, France, Iran, China, India, Spain, Mexico the cases are very high. According to the recent update about the coronavirus, the total infected registered cases are 22,423,016 with 787,909 deaths while the recovered cases are 15,907,858. In Saudi Arabia, the coronavirus first case was reported on March 02, 2020 [2] where a Saudi national came from Iran via Bahrain. A second case reported on March 14, where a person came from Iran via Bahrain who is the companion of the first without mentioned that he had visited Iran [3]. Due to the increase of the infected cases across the country, the educations institutions, restaurants and other places where there is a risk of the infection to be spreaded further are closed. International flights including domestics are suspended, Umrah visitors are restricted, hajj is restricted to a few number of people. A strick lockdown and curfew were started in the cities where the risk was high. After the decreasing of the infection, there were reported a partial curfew in some cities except Makkah. At the end of July 2020, 288,609 cases were reported with 3167 deaths and the recovered are 252,035.
The coronavirus which is currently is an epidemic globally put many people to deaths and infections with major economic loss over the globe. Researchers from different fields studied the coronavirus and identified the possible way to protect the humans. In this regard, a number of articles published where the coronavirus were the prime target was the COVID‐19. Many researchers published mathematical models in order to understand the dynamics and complexities of the coronavirus. A mathematical model that addressed the dynamics of coronavirus in Canada has been studied in Reference [4]. A mathematical is formulated to study the data of China, Italy and France is explored in Reference [5]. In Reference [6], the authors formulated a mathematical model in terms of the fractional derivatives and explored the dynamics of coronavirus using the Chines real data. A new mathematical study about the coronavirus and the impact of the lockdown on the society is explored in Reference [7]. Using a fractional mathematical model in Reference [8], the authors used the real data of UK, USA and Italy and performed the numerical investigations. The mathematical and computational analysis of the COVID‐19 disease in Mexico has been discussed in Reference [9]. The impact of non‐pharmaceutical interventions on the dynamics of novel coronavirus has been reported in Reference [10]. The dynamics of novel coronavirus with optimal control strategies has been studied in Reference [11]. The authors in Reference [12] explored the dynamical analysis of the COVID‐19 with quarantine and isolations using the real data. A mathematical study on coronavirus using the real cases from Nigeria has been studied in Reference [13]. A mathematical model with real statistical cases from Ghana has been analyzed in Reference [14]. A mathematical model with singular and nonsingular operators have been studied in Reference [15].
The aims of this study are construct a novel mathematical for the coronavirus using the real cases reported in Saudi Arabia since, March 02 till July 31, 2020. We use the new concept of the interaction of exposed with susceptible individuals which is reasonable and make the progress of the infection cases more. Some mathematical properties of the model are explored in detailed. The sensitivity analysis is performed and obtained the numerical results for the sensitive parameters which can be regarded the best control for the disease eradication. The details model formulations and others sections in this paper are as follows: The formulation of the new mathematical with brief discussion is given in Section 2. The analysis of the equilibrium points and the stability results have been discussed in Section 3. In Section 4, we study the parameter estimations, sensitivity analysis, and the numerical results with discussion. A brief conclusions based on the work presented in given in Section 5.
2. MODEL FORMULATION
We formulate the model by dividing the population N(t) into five different classes, namely, the susceptible, exposed, asymptomatic infected (not showing symptoms but infected other healthy people), symptomatic infected (that have symptoms of disease and infect other people), and the recovered individuals, respectively, denoted by S(t), E(t), A(t), I(t), and R(t), so N(t) = S(t) + E(t) + A(t) + I(t) + R(t). The concentration of the corona virus in the environment is denoted by B(t). People in infected class which have the disease symptoms fully can transmit the infection to other people. People who are in the exposed class which are in the period of incubation which do not have symptoms but can transmit the infection to other people. The asymptomatic people do not show any symptoms but it transmits the infection to other people and regarded a threat to the human population for further generation of infection. We write the following model based on the above discussion:
| (1) |
where the initial conditions are given by
| (2) |
The birth rate of the susceptible individuals is shown by Λ while the natural mortality rate is given by d. β i for i = 1,2,3,4 are the contact rate respectively, among exposed and susceptible, infected (showing symptoms) and susceptible, symptomatically infected (not showing symptoms) and susceptible (which are considered to be the direct transmission), and the environment indirect to human transmission. The exposed individuals develop symptoms become infected at a rate (1 − τ)δ, where the asymptomatic infection occur with a rate τδ. The infected people die at infected class at a rate d 1 while the recovery from infected, asymptomatic infected occur at rate γ 1 and γ 2, respectively. The parameters ψ i for i = 1,2,3 are rate at which the exposed, infected and asymptomatically infected people contributed the virus to the environment reservoir while the removal rate of the virus from the environment reservoir is shown by ϕ section Model analysis.
2.1. Solution positivity
Lemma 1
Consider the initial data H(0) ≥ 0, where H(t) = (S(t), E(t), I(t), A(t), R(t), B(t)). Then, for any t > 0, we have the non‐negative solution for the system (1). Further,
with N(t) = S(t) + E(t) + I(t) + A(t) + R(t).
Consider t 1 = sup{t > 0 : H(t) > 0 ∈ [0, t]}. So, t 1 > 0. The following result is given using the first equation of the model (1),
(3) with . Then, the Equation (3) can be written as,
(4) So,
(5) so that
(6) For the remaining equations, we take the same steps that are shown for the above equation of model (1) to show H(t) > 0 for every t > 0. For the second part, note that 0 < S(0) ≤ N(t), 0 < E(0) ≤ N(t), 0 < I(0) ≤ N(t), 0 < A(0) ≤ N(t), 0 < R(0) ≤ N(t). The additions of all the equations except the last one of the model (1), the following is presented:
so,
Next, we present the following result for model (1) about it is invariant regions. Let the feasible region be Ω, shown by
The following result is established.
Lemma 2
The region Ω for the system (1) is positively invariant with the non‐negative initial conditions.
In order to show the above result, we add the first equations of the system (1), and get the following,
Hence, , if . So, . So, the region shown by Ω is positively invariant. Further, and , then either the solutions enters Ω in finite time or N(t) tends to asymptotically. Thus, the region Ω attracts all the solutions in .
3. EQUILIBRIUM POINTS AND THEIR ANALYSIS
The model (1) has a unique disease free equilibrium, given by
In order to find the stability of the system (1), we need to compute the basic reproduction number ℛ0. For this, we consider the infected classes, E, I, A, and B, follow the method given in Reference [16] and have the results in the following.
The required basic reproduction number for the given corona virus model is
where
| (7) |
where k 1 = d + δ, k 2 = γ 1 + d + d 1, and k 3 = γ 2 + d. Next, we find the local stability analysis of the model (1) at the disease free equilibrium (DFE). The following theorem is presented.
Theorem 1
The coronavirus model is locally asymptotically stable at Y 0 if ℛ0 < 1.
The Jacobian matrix of system (1) at Y 0 is given by
From J(Y 0), we have the eigenvalues −d, − d that show clearly negative real parts and the rest of the eigenvalues can be obtained from the following equations:
where
It can be observed that all the coefficients above a i > 0 for i = 1,2,3,4 whenever ℛ0 < 1 and further it satisfy the Routh‐Hurtwiz criteria a i > 0 for i = 1,2,3,4 and . Thus, it can be concluded that the corona virus model is locally asymptotically stable at the disease free equilibrium Y 0.
Next, we obtained the expressions for the endemic equilibrium. The endemic equilibrium of the corona virus model (1) denoted by Y 1 = (S *, E *, I *, A *, R *, B *) and is given by
Using the above result into
we have
where
The above result suggests if ℛ0 > 1, then, a unique endemic equilibrium exists and there is no possibility of the existing of the backward bifurcation phenomenon.
4. PARAMETERS ESTIMATION, SENSITIVITY ANALYSIS AND THE NUMERICAL RESULTS
Here, we estimate the model parameters for the corona virus model (1) using the infected cases reported in Kingdom of Saudi Arabia since March 02 till July 31 and parameterized the model. The time unit is taken to be in days. We consider some of the parameters of the model from literature such as the natural death rate d and the birth rate Λ. These parameters can be calculated as N(0) = Λ/d, where N(0) is the total population of Saudi Arabia in 2020 and it is N(0) = 34813871. The average lifespan in Saudi Arabia is 1/74.87. The birth is calculated and given by Λ = 1273.94 per day. The others parameters of the model are obtained through data fitting and can be seen in Table 1. The total corona cases reported in Kingdom of Saudi Arabia at the end of July 2020 are 288,690 with 3167 deaths. From these infected cases, the number of recovered people are 252,039. From this data, it is clear that 1% death reported while the 99% people have been recovered or discharged. The computed reproduction number for this given data is ℛ0 = 1.2937.
TABLE 1.
Parameters fitted to the real data
| Parameter | Description | Value | Source | |
|---|---|---|---|---|
| Λ | Recruitment rate | d × N(0) | Estimated | |
| d | Natural mortality rate |
|
[2] | |
| β 1 | Contact rate among exposed and susceptible | 0.1233 | Fitted | |
| β 2 | Contact rate among infected (symptomatic) and susceptible | 0.0542 | Fitted | |
| β 3 | Contact rate among infected (asymptomatic) and susceptible | 0.0020 | Fitted | |
| β 4 | Contact rate among environment and susceptible | 0.1101 | Fitted | |
| δ | Incubation period | 0.1980 | Fitted | |
| τ | Incubation period | 0.3085 | Fitted | |
| d 1 | Natural death rate due to Infection at I | 0.0104 | Fitted | |
| γ 1 | Recovery from I | 0.3680 | Fitted | |
| γ 2 | Recovery from A | 0.2945 | Fitted | |
| ψ 1 | Virus contribution due to E to B | 0.2574 | Fitted | |
| ψ 2 | Virus contribution due to I to B | 0.2798 | Fitted | |
| ψ 3 | Virus contribution due to A to B | 0.1584 | Fitted | |
| ϕ | Virus removal from environment | 0.3820 | Fitted |
The parameters values used in Table 1 are used to show the model (1) versus data fitting in Figures 1. The COVID‐19 cases reported in Saudi Arabia versus model fitting have been shown in 1 which provide best fit to the data. Next, we determine the sensitivity analysis of the model parameters that which parameters can greatly affect the basic reproduction number ℛ0, so the following subsection is devoted to obtain the global sensitivity analysis.
FIGURE 1.
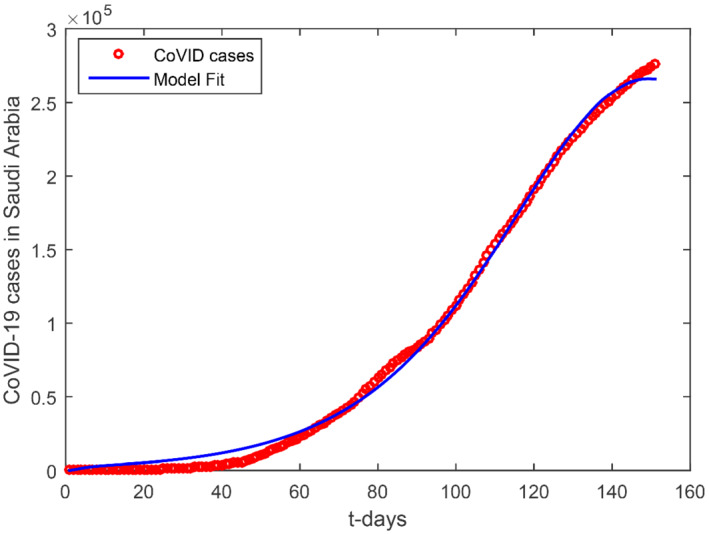
The COVID‐19 cases in Kingdom of Saudi Arabia versus model simulation
4.1. Sensitivity analysis
The aims of the sensitivity analysis for an epidemic model are to determine the dominant factors related to a certain interventions that affects the dynamics of disease greatly. We present the PRCC analysis in order to find out the most influential parameters that contribute to ℛ0. In this analysis, the parameters considered and their respective p values are shown in Table 2. The most sensitive parameter is ϕ and the others are d, β 4, ψ 1, β 1, δ, γ 2, β 3, ψ 2, ψ 3, τ, γ 1, β 2, and d 1. The positive indices parameters in Table 2 increase the value of ℛ0 that is the COVID infection will increase in the population while the parameters with negative indices in Table 2 indicate the decrease in the COVID infection in the population. The PRCC graph has been shown in Figure 2 where the important sensitive parameters and their effect on model will be explored in the following section.
TABLE 2.
Partial rank correlation coefficient (PRRC) values of ℛ0 with corresponding p values
| Parameter | Description | PRCC values | p Values |
|---|---|---|---|
| β 1 | Contact rate among exposed and susceptible | 0.5350 | 0.0000 |
| β 2 | Contact rate among infected (symptomatic) and susceptible | 0.1015 | 0.0014 |
| β 3 | Contact rate among infected (asymptomatic) and susceptible | 0.1598 | 0.0000 |
| β 4 | Contact rate among environment and susceptible | 0.6693 | 0.0000 |
| δ | Incubation period | −0.3515 | 0.0000 |
| d | Natural death rate | −0.7373 | 0.0000 |
| τ | Incubation period | 0.1186 | 0.0002 |
| d 1 | Natural death rate due to Infection at I | −0.0382 | 0.2306 |
| γ 1 | Recovery from I | −0.1049 | 0.0010 |
| γ 2 | Recovery from A | −0.1946 | 0.0000 |
| ψ 1 | Virus contribution due to E to B | 0.5567 | 0.0000 |
| ψ 2 | Virus contribution due to I to B | 0.1312 | 0.0000 |
| ψ 3 | Virus contribution due to A to B | 0.1254 | 00.0001 |
| ϕ | Virus removal from environment | −0.7664 | 0.0000 |
FIGURE 2.
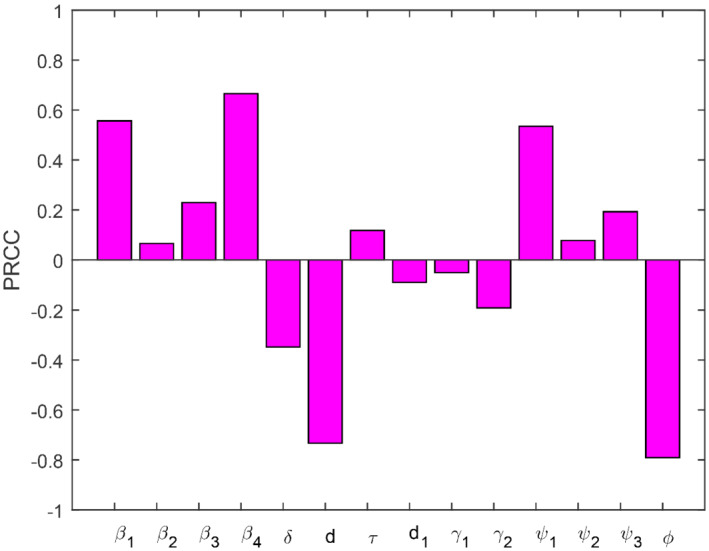
The COVID‐19 cases in Kingdom of Saudi Arabia versus model simulation
5. NUMERICAL RESULTS
In this subsection, we obtained the numerical solution of the new COVID‐19 model (1). The time unit is considered in days. The parameters estimated and fitted shown in Table 1 are considered and obtained the Figures 3, 4, 5, 6, 7, 8, 9, 10, 11, 12, 13, 14. The stability of the model (1) is shown graphically in Figure 3. Figure 4 represents the dynamics of the susceptible versus total number of infected individuals (TI). It can be seen from Figures 3 and 4 that the model (1) is locally asymptotically stable. The parameter β 1 and its impact on infected individuals are shown graphically in Figure 5. In Figure 6, the parameter β 4 and its impact on the infected cases are given. The parameters ψ 1 and ϕ and their effect on the infected cases are shown, respectively, in Figures 7 and 8. In Figures 5, 6, 7, 8, it can be observed that by decreasing the value of the parameters β 1, β 4, ψ 1, and ϕ can reduce the infection in the cases greatly. The parameter β 1, which defines the contact among healthy and susceptible people can reduce the infection if the contact among is restricted or limited. Also, the shaking hands, the physical distance, the social distances, and the other instructions suggested by World Health Organization (WHO) should be carefully adopted. The parameter β 4 defines the contact among the healthy people and the environment in the virus (which may be a seafood market). The visiting people and buying things that can produce the infection further and infect other healthy people should be avoid. The parameter ψ 1 that defines the visiting exposed individuals to the environment of the seafood market and makes the infection process more complex should be restricted. It is obvious that in China the generation of the infected cases was reported mainly by the cause of the virus in the seafood market, therefore, the parameter ψ that defines the removal rate of the virus should be increased by using the properly sprayed and other chemical related material that are beneficial to improve the reduction of the viruses on the surface. The total number of infected compartments for the sensitivity parameters has been shown graphically in Figures 9, 10, 11, 12, 13, 14. From these graphical results, it can be seen the reducing the value of the parameters β 1, β 4, ψ 1, ϕ, ψ 2, and ψ 3, the total number of infected cases reduces faster. Therefore, the suggested parameters that we discussed above should be considered as control parameters for the reduction of the virus from the community.
FIGURE 3.
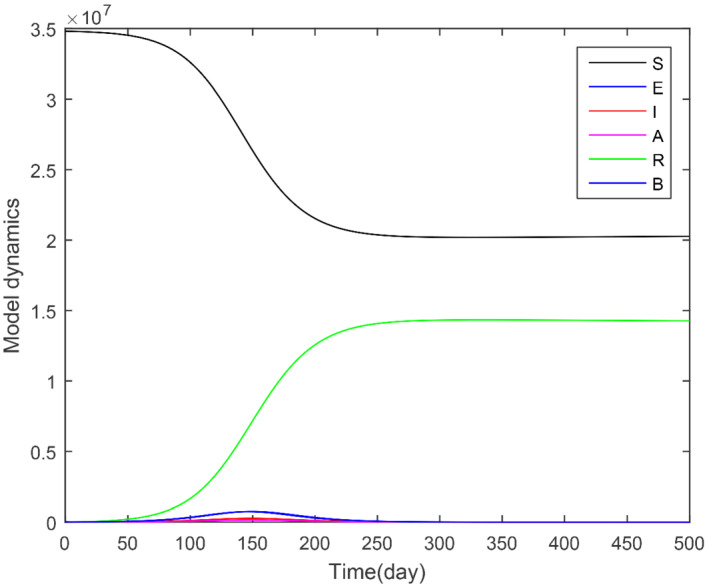
Stability of the model (1) when ℛ0 = 1.2935 > 1
FIGURE 4.
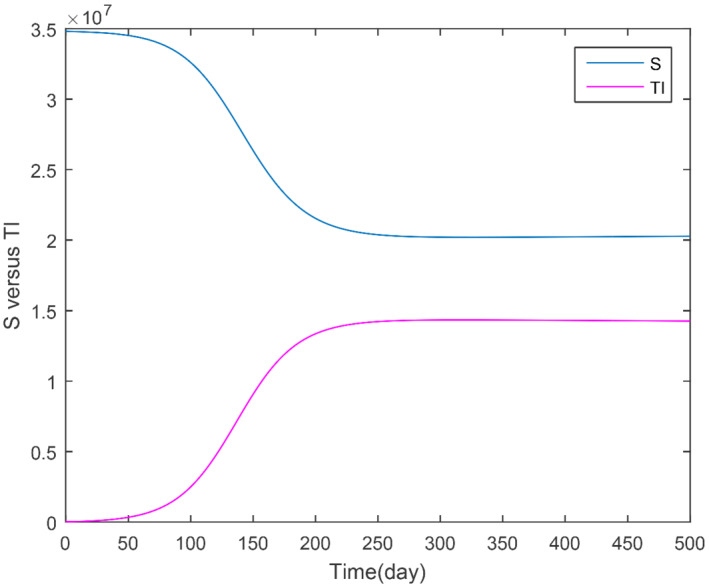
Total number of infected people versus susceptible individuals (TI refereed as total infected)
FIGURE 5.
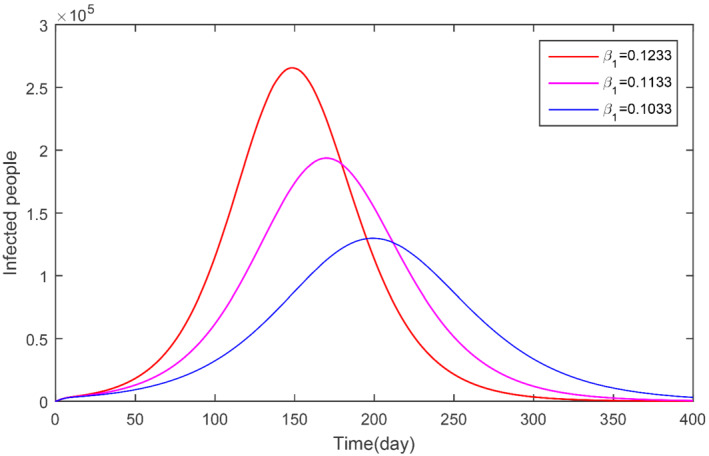
The parameter β 1 and its impact on infected population
FIGURE 6.
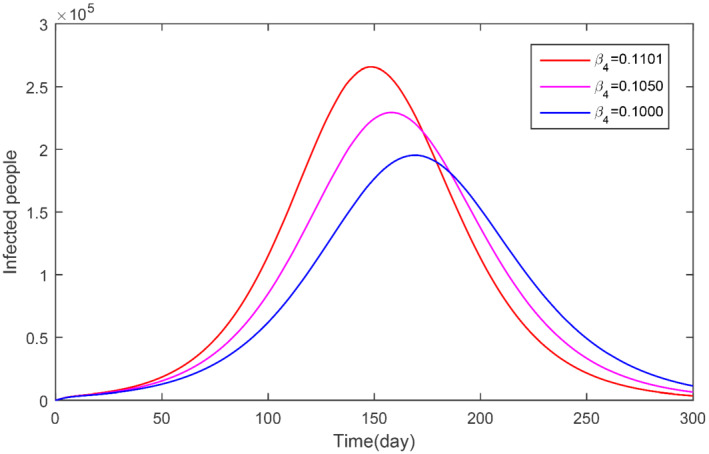
The parameter β 4 and its impact on infected population
FIGURE 7.
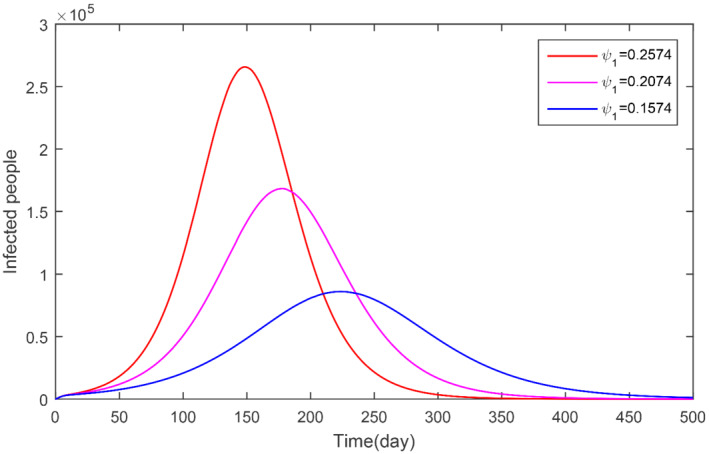
The parameter ψ 1 and its impact on infected population
FIGURE 8.
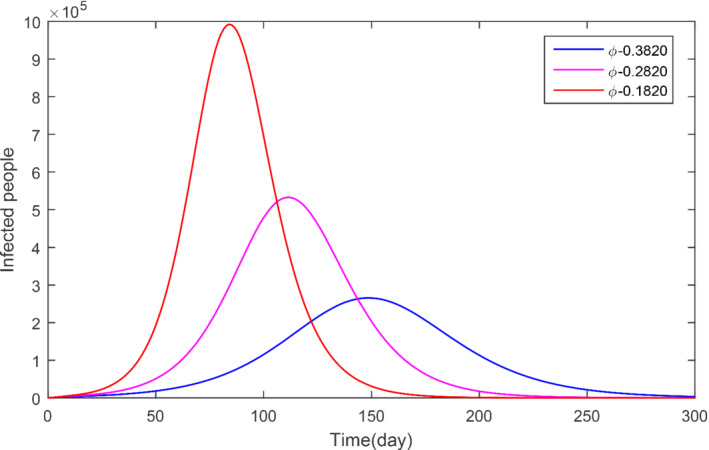
The parameter ϕ and its impact on infected population
FIGURE 9.
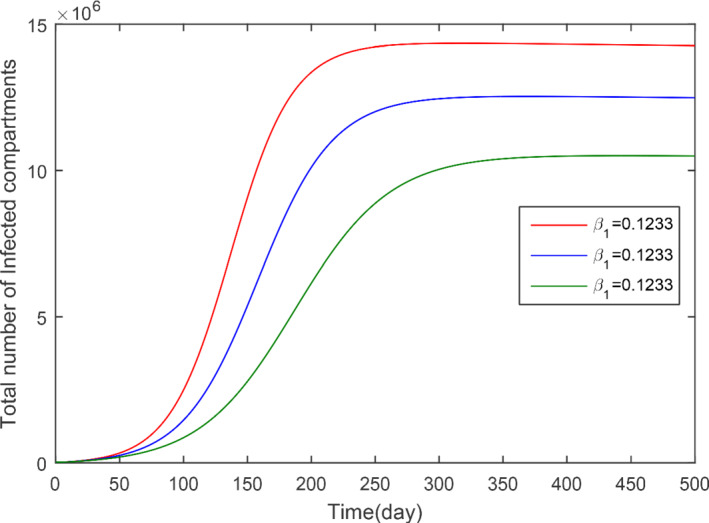
The impact of β 1 with various values on the total infected cases
FIGURE 10.
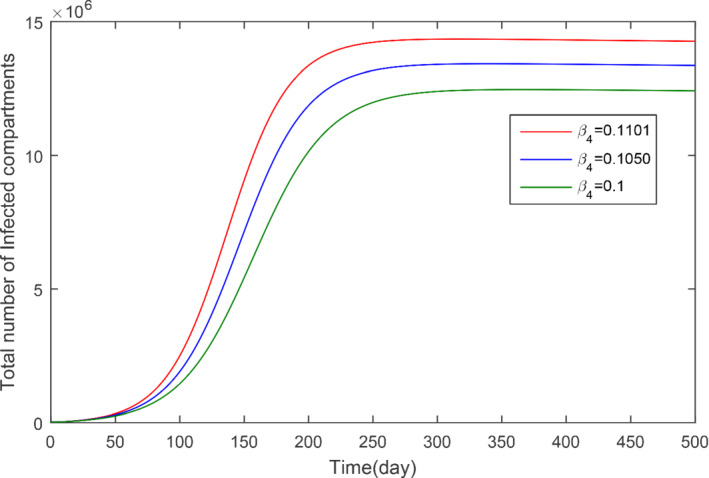
The impact of β 4 with various values on the total infected cases
FIGURE 11.
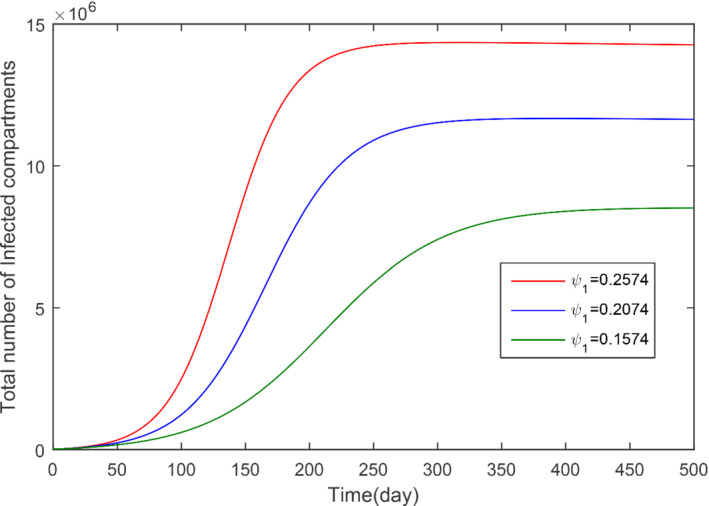
The impact of ψ 1 with various values on the total infected cases
FIGURE 12.
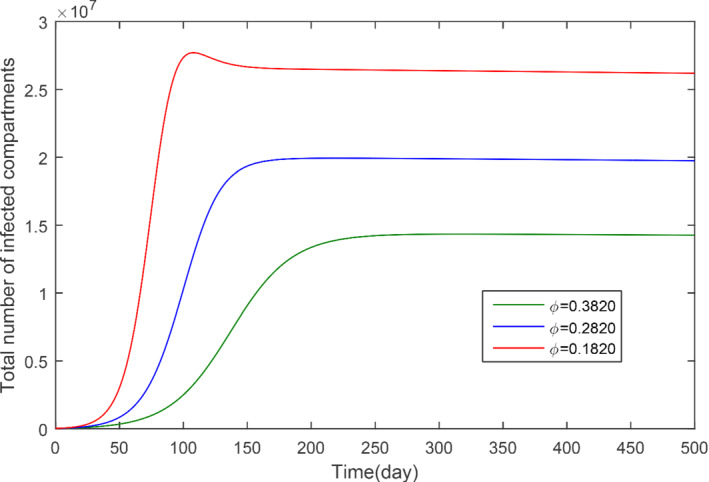
The impact of ϕ with various values on the total infected cases
FIGURE 13.
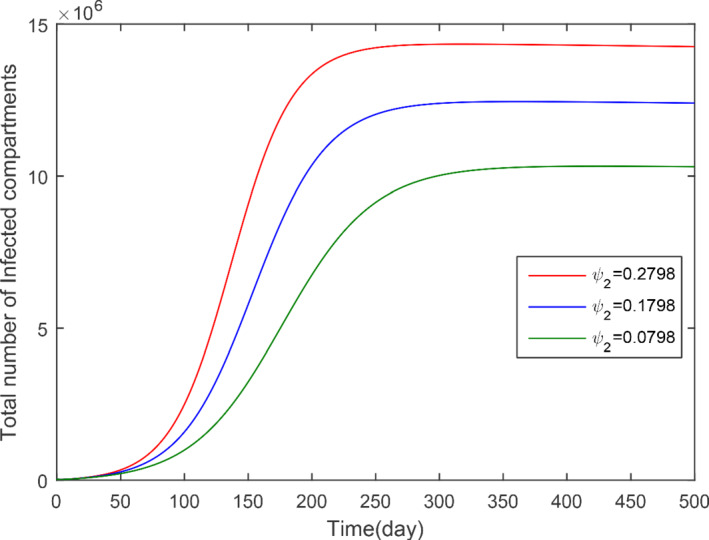
The impact of ψ 2 with various values on the total infected cases
FIGURE 14.
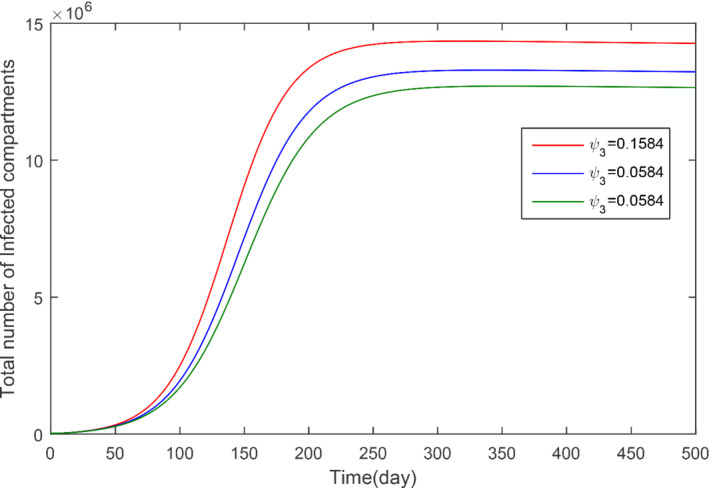
The impact of ψ 3 with various values on the total infected cases
6. CONCLUSION
In this investigations, we constructed a new mathematical model for the dynamics of COVID‐19 with the real cases of COVID infection in Kingdom of Saudi Arabia. We invested and found that the model is locally asymptotically stable when ℛ0 < 1. Further, we presented the least square curve fit and obtained the real parameters and found the basic reproduction number ℛ0 ≈ 1.2937 for the Saudi Arabia data. The real parameters are used in the PRCC analysis and the related parameters are investigated that were more sensitivity to the basic reproduction number ℛ0. We solved the model and obtained the graphical results for the important parameters for the case of infected people and for the total number of infected cases. We observed from the graphical results that the infected cases in Saudi Arabia will be decreased more in a faster way if the government should restrict the people to the home only, avoid shaking hands, follow properly washing the hands, restricts the visits to the endemic areas, the places where the infection can be generate further must be restricted and the physical distances or social distances must be followed carefully.
ACKNOWLEDGMENT
The authors are thankful to the institute of Research and Consulting Studies at King Khalid University of supporting this research through grant number #31‐17‐S‐2020.
Alqarni MS, Alghamdi M, Muhammad T, Alshomrani AS, Khan MA. Mathematical modeling for novel coronavirus (COVID‐19) and control. Numer Methods Partial Differential Eq.. 2022;38:760–776. 10.1002/num.22695
Funding information King Khalid University, 31‐17‐S‐2020
REFERENCES
- 1. World Health Organization . Coronavirus.
- 2. Saudi Arabia announces the first case of coronavirus , Arab news. Riyadh: Saudi research and marketing group, 3 March 2020.
- 3. Saudi Arabia detects second coronavirus case . Arab News. 4 March 2020. Archived from the original on 5 March 2020. Retrieved 7 March 2020.
- 4. Wu Jianhong et al., Quantifying the role of social distancing, personal protection and case detection in mitigating COVID‐19 outbreak in Ontario, Canada, J. Math. Ind. 10(1) (2020), 1–12. [DOI] [PMC free article] [PubMed] [Google Scholar]
- 5. Fanelli Duccio and Piazza Francesco, Analysis and forecast of COVID‐19 spreading in China, Italy and France, Chaos, Solitons Fract. 134 (2020), 109761. [DOI] [PMC free article] [PubMed] [Google Scholar]
- 6. Khan Muhammad Altaf and Atangana Abdon, Modeling the dynamics of novel coronavirus (2019‐ncov) with fractional derivative, Alex. Eng. J. 59 (2020), 2379–2389. [Google Scholar]
- 7. Atangana Abdon, Modelling the spread of COVID‐19 with new fractal‐fractional operators: Can the lockdown save mankind before vaccination? Chaos, Solitons Fract. 136 (2020), 109860. [DOI] [PMC free article] [PubMed] [Google Scholar]
- 8. Utkucan Şahin and Tezcan Şahin, Forecasting the cumulative number of confirmed cases of COVID‐19 in Italy, UK and USA using fractional nonlinear grey bernoulli model, Chaos, Solitons Fract. 138 (2020), 109948. [DOI] [PMC free article] [PubMed] [Google Scholar]
- 9. Torrealba‐Rodriguez O., Conde‐Gutiérrez R. A., and Hernández‐Javier A. L., Modeling and prediction of COVID‐19 in Mexico applying mathematical and computational models, Chaos, Solitons Fract. 138 (2020), 109946. [DOI] [PMC free article] [PubMed] [Google Scholar]
- 10. Ngonghala Calistus N. et al., Mathematical assessment of the impact of non‐pharmaceutical interventions on curtailing the 2019 novel coronavirus, Math. Biosci. 325 (2020), 108364. [DOI] [PMC free article] [PubMed] [Google Scholar]
- 11. Ullah Saif and Khan Muhammad Altaf, Modeling the impact of non‐pharmaceutical interventions on the dynamics of novel coronavirus with optimal control analysis with a case study, Chaos, Solitons Fract. 139 (2020), 110075. [DOI] [PMC free article] [PubMed] [Google Scholar]
- 12. Khan Muhammad Altaf et al., The dynamics of COVID‐19 with quarantined and isolation, Adv. Differ. Equ. 2020(1) (2020), 1–22. [DOI] [PMC free article] [PubMed] [Google Scholar]
- 13. Okuonghae D. and Omame A., Analysis of a mathematical model for COVID‐19 population dynamics in Lagos, Nigeria, Chaos, Solitons Fract. 139 (2020), 110032. [DOI] [PMC free article] [PubMed] [Google Scholar]
- 14. Asamoah Joshua Kiddy K. et al., Global stability and cost‐effectiveness analysis of COVID‐19 considering the impact of the environment: Using data from Ghana, Chaos, Solitons Fract. 140 (2020), 110103. [DOI] [PMC free article] [PubMed] [Google Scholar]
- 15. Zhang Zizhen, A novel COVID‐19 mathematical model with fractional derivatives: Singular and nonsingular kernels, Chaos, Solitons Fract. 139 (2020), 110060. [DOI] [PMC free article] [PubMed] [Google Scholar]
- 16. Van den Driessche Pauline and Watmough James, Reproduction numbers and sub‐threshold endemic equilibria for compartmental models of disease transmission, Math. Biosci. 180(1–2) (2002), 29–48. [DOI] [PubMed] [Google Scholar]


