

Abstract
Many drugs that have been proposed for treatment of coronavirus disease 2019 (COVID‐19) are reported to cause cardiac adverse events, including ventricular arrhythmias. In order to properly weigh risks against potential benefits, particularly when decisions must be made quickly, mathematical modeling of both drug disposition and drug action can be useful for predicting patient response and making informed decisions. Here, we explored the potential effects on cardiac electrophysiology of four drugs proposed to treat COVID‐19: lopinavir, ritonavir, chloroquine, and azithromycin, as well as combination therapy involving these drugs. Our study combined simulations of pharmacokinetics (PKs) with quantitative systems pharmacology (QSP) modeling of ventricular myocytes to predict potential cardiac adverse events caused by these treatments. Simulation results predicted that drug combinations can lead to greater cellular action potential prolongation, analogous to QT prolongation, compared with drugs given in isolation. The combination effect can result from both PK and pharmacodynamic drug interactions. Importantly, simulations of different patient groups predicted that women with pre‐existing heart disease are especially susceptible to drug‐induced arrhythmias, compared with diseased men or healthy individuals of either sex. Statistical analysis of population simulations revealed the molecular factors that make certain women with heart failure especially susceptible to arrhythmias. Overall, the results illustrate how PK and QSP modeling may be combined to more precisely predict cardiac risks of COVID‐19 therapies.
Study Highlights.
WHAT IS THE CURRENT KNOWLEDGE ON THE TOPIC?
Several drugs being investigated for treatment of coronavirus disease 2019 (COVID‐19) have been reported to prolong cardiac action potentials.
WHAT QUESTION DID THIS STUDY ADDRESS?
Do drugs and drug combinations that have been proposed for treatment of COVID‐19 increase ventricular arrhythmia risk in particular patient groups?
WHAT DOES THIS STUDY ADD TO OUR KNOWLEDGE?
Drugs and drug combinations being used to treat COVID‐19 may increase risk of ventricular arrhythmias, particularly in women with pre‐existing cardiac disease.
HOW MIGHT THIS CHANGE DRUG DISCOVERY, DEVELOPMENT, AND/OR THERAPEUTICS?
The research provides an approach to weigh the potential benefits of COVID‐19 treatments against the risks of adverse events from these therapeutics.
The rapid spread of coronavirus disease 2019 (COVID‐19) worldwide, in the absence of established therapeutics, has forced clinicians to improvise by treating patients “off label” with drugs that were approved to treat other diseases. The investigational off‐label use of such drugs for COVID‐19 has led to the initiation of several clinical studies, generally small in scope due to the urgent nature of the healthcare crisis. Some of these have included drug combinations, such as lopinavir (LP) plus ritonavir (RT) 1 , 2 or chloroquine (CQ) plus azithromycin (AZ). 3 , 4 , 5 Under the current pandemic conditions, with clinicians attempting to maintain scientific rigor while delivering treatments quickly, it can be difficult to properly weigh the potential benefits of drugs against the risks of adverse events. It can be especially challenging to determine the risks of drug combinations because specific combinations have often not been examined during preclinical or early clinical safety assessments.
Mathematical models can be used to rapidly predict the physiological effects of drug treatments, and simulations with such models gain importance when time is of the essence. This can become particularly true when considering drug combinations due to the complexities that are introduced when drugs are co‐administered. These can include both pharmacokinetic (PK) interactions, whereby the presence of one drug alters the concentration of a second drug, and pharmacodynamic interactions, whereby the overall physiological consequences result from the combined biological effects of the two drugs. The former can be studied with pharmacometric approaches, whereas the latter can be addressed with quantitative systems pharmacology (QSP) models that explicitly incorporate drug mechanisms of action. Both PK and QSP simulations are likely to become particularly important for proposed COVID‐19 treatments because: (i) adverse cardiac events, including QT prolongation, have been associated with several of these drugs, 6 , 7 , 8 (ii) drug disposition has previously been characterized for most of the drugs being considered for treatment 9 , 10 , 11 , 12 ; (iii) modeling of pharmacological effects on cardiac electrophysiology, including adverse events, is a mature area of research 13 , 14 , 15 ; and (iv) QSP models can simulate the effects of drugs applied in different contexts, thereby allowing for the effects of factors such as comorbidities to be considered.
Here, we present cellular simulation results that predict an additive drug combination effect on QT prolongation, indicating that these combinations may increase the risk of ventricular arrhythmias in patients with COVID‐19. The simulations further highlight the importance of sex differences and the presence of existing cardiac disease, such that particular drug combinations may be especially dangerous for women with heart failure (HF). Importantly for future studies, the results demonstrate a pipeline for systematic examination and a quantitative methodology that can be used to balance the potential benefits of COVID‐19 treatments against the risks of cardiac arrhythmias.
METHODS
Drugs considered and data sources
To begin to understand potential side effects caused by COVID‐19 treatments, we considered four drugs currently under investigation: LP, RT, CQ, and AZ, as well as the former two and the latter two drugs in combination. We selected these four drugs for initial analysis because their effects on cardiac ionic currents have been assessed under standardized conditions. Crumb et al. 16 have reported effective free therapeutic plasma concentrations (EFTPCs) for each drug in addition to half maximal inhibitory concentration (IC50) values that indicate the affinity of each drug to block the following cardiac ionic currents: (i) fast Na+ current; (ii) late Na+ current; (iii) transient outward K+ current; (iv) rapid delayed rectifier K+ current; (v) slow delayed rectifier K+ current; (vi) inward rectifier K+ current; and (vii) L‐type Ca2+ current. This publication 16 also estimated Hill coefficients for each drug‐channel combination. This unified data source was exploited for QSP model simulations of drug effects (see below). IC50 values and estimated Hill coefficients are shown in Table S1 .
Cardiac cellular QSP modeling of drug effects
The O’Hara et al. mathematical model 17 of the human endocardial ventricular myocyte was used to simulate the effects of drugs on ventricular action potentials (APs). This model, comprising a system of 41 ordinary differential equations, simulates interactions between ionic currents and Ca2+ cycling in the ventricular myocyte, and drug‐induced changes to APs in models such as these are well‐correlated with clinically observed changes to electrocardiographic waveforms. 13 , 14 , 15
Block of ionic currents by particular drugs was simulated with a pore block model. With this approach, the conductance (G) of each ionic current is scaled based on drug concentration ([C]), the IC50 value, and the Hill coefficient (H) that together describe how the drug blocks that current, for example:
All simulation results were obtained during steady‐state pacing at 1 Hz. An electrical stimulus current (2 ms duration, 32 μA/cm2 amplitude) was applied repeatedly to induce action potentials once per second, simulating a typical resting heart rate. A series of 100 consecutive stimuli were delivered to each cell, which usually caused cells to reach steady‐state, meaning that consecutive action potentials were identical. When steady‐state was reached, we quantified AP duration (APD) as the interval from the AP upstroke (maximal rate of rise) until membrane voltage decreased by 90% from peak level to resting level. Drug‐induced AP prolongation was calculated as ΔAPD (i.e., drug‐treated minus untreated cells). We defined cells as exhibiting arrhythmic dynamics when APD was not constant from beat to beat, due to repolarization failure, secondary membrane depolarizations, or an alternating long‐short pattern known as alternans.
Modeling of pharmacokinetics
To link drug concentrations in the QSP simulations with free plasma drug concentrations that are likely to be observed in patients, we used PK models to simulate drug disposition of AZ, 11 CQ, 12 or LP + RT. 10 These models, implemented as published, allowed us to simulate temporal changes in either total or free plasma concentrations with different dosing regimens.
The LP + RT model, 10 built with data from 35 treatment‐naïve HIV‐infected patients, showed that plasma concentrations of these drugs were well‐characterized by a one‐compartment model with first‐order absorption and a lag time. An exponential term was used to incorporate the effect of RT concentration on the clearance of LP, and we assumed an unbound fraction of 0.01 to relate total drug concentrations to free plasma concentrations that are likely to be present in patients. 18 The AZ PK model 11 was a three‐compartment model with first‐order absorption, lag time, and first‐order elimination, and this model calculated free drug concentrations directly. Finally, a PK model for CQ plasma concentrations was recently published using data from 24 healthy subjects. 12 This model consists of two‐compartments, with first‐order absorption and elimination. Because CQ has been shown to accumulate in target tissues, including the heart, we also used results from a physiologically‐based PK model 9 developed in Simcyp (version 18; Certara, UK). This model was validated using data from different clinical studies, including PK data of 8 patients with COVID‐19 after an oral administration of 500 mg CQ phosphate b.i.d. for 7 days. This model predicted drug concentrations not only in plasma but also in the heart, which allowed us to extract relevant unbound cardiac drug concentrations by assuming that the unbound fraction in the heart (0.39) was identical to the fraction in plasma. 19
Pharmacodynamic variability between individuals
Two factors that are known to influence the risk of drug‐induced arrhythmia are female sex 20 and the presence of pre‐existing HF. 21 We simulated differences between men and women and between healthy and failing myocytes using established protocols. These methods, published by Yang et al. 22 and Gomez et al., 23 respectively, consist of scaling parameter values based on measured differences in ion transport pathways between male and female hearts, or between healthy and failing myocytes. More specifically, each ion transport pathway in the O’Hara et al. model 17 is associated with a maximal conductance that is proportional to the number of functional channels, pumps, or transporters in the cell. Differences in ion transport between cell types can therefore be implemented by scaling these maximal conductances, and we implemented this scaling to create four variants of the baseline ventricular myocyte: healthy male (assumed to be the original model), healthy female, HF male, and HF female. See Table S2 for details.
Once baseline models for the different patient groups had been created, we generated virtual populations to simulate physiological variability between individuals. 24 , 25 , 26 All maximal conductances in the model (Table S3 ) were randomized about their respective baseline values by choosing scale factors from a log‐normal distribution. 24 , 25 , 26 This approach ensured that, for each maximal conductance, approximately half of the cells in the population would have values greater than normal (scale factor > 1) and half would be smaller than normal. The degree of variability was chosen to produce simulated heterogeneity in action potential waveforms that roughly matches variability seen in recordings from human myocytes.
Logistic Regression analysis
Simulations of the HF female population predicted that CQ + AZ therapy could induce arrhythmic dynamics in a minority of cells (85 of 1,000 cells). To assess why individual cells within the population were either susceptible or resistant to arrhythmias, we performed logistic regression analysis on the population results. 27 , 28 Each cell in the simulated population was labeled as either a 0 (no arrhythmic dynamics) or a 1 (arrhythmic dynamics) and the MATLAB function MNRFIT was used to derive a logistic model that can predict the probability of arrhythmia from the parameter values in each cell. This can be used to rank‐order parameters based on their importance in governing whether arrhythmic dynamics occur. 27 , 28
Model code is available at the first author's github repository: https://github.com/meeravarshneya1234/COVID19Drugs_ArrhythmiaRisk
RESULTS
We performed simulations to predict the effects on human ventricular APs of LP, RT, CQ, and AZ. Based on a comprehensive study of how various drugs affect cardiac ion channels, 16 we calculated that each of the proposed COVID‐19 treatments will block a slightly different complement of ionic currents (Figure 1a ). These drug‐specific, concentration‐dependent alterations to ionic currents were applied to a mathematical model of the human ventricular endocardial myocyte 17 to predict drug‐induced changes to cardiac APs. Simulations performed with each drug at 10 times the reported EFTPC show that all drugs can induce substantial AP prolongation at these high concentrations (Figure 1b ), with lopinavir causing the most dramatic effects. Simulations performed across drug concentrations ranging from 0.3 times to 10 times EFTPC confirm that the drugs prolong APD (AP duration at 90% repolarization) in a concentration‐dependent manner, with the largest effects occurring at the highest drug concentrations (Figure 1c ).
Figure 1.
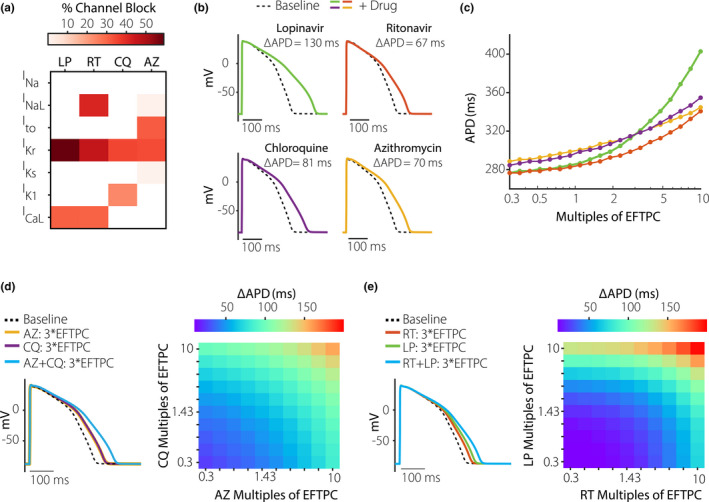
Concentration‐dependent effects of coronavirus disease 2019 (COVID‐19) drugs on ventricular action potentials. (a) Heatmap illustrating the extent to which azithromycin (AZ), chloroquine (CQ), ritonavir (RT), and lopinavir (LP) inhibit 7 important cardiac ionic currents, as previously measured by Crumb et al. 16 These authors reported effective free therapeutic plasma concentration (EFTPC) of each drug, in addition to half maximal inhibitory concentration (IC50) values that indicated how much each drug influenced 7 cardiac ionic currents (see Methods for abbreviations). Block of currents by particular drugs at 10*EFTPC was calculated based on drug concentration and IC50 values using a simple pore block model. (b) Simulations with the baseline myocyte model demonstrating how each drug, at 10*EFTPC, is predicted to influence ventricular action potentials (APs). (c) Concentration‐response curves illustrating how the 4 drugs influence AP duration (APD), the duration between the action potential upstroke (maximal rate of change of voltage) and 90% repolarization. Drug concentrations tested ranged from 0.3 times to 10 times EFTPC, with logarithmically spaced increments. (d) Predicted AP prolongation (ΔAPD) for CQ + AZ. (e) Predicted ΔAPD for LP + RT. Combination therapy causes greater AP prolongation than drugs applied individually, as shown in both heatmaps illustrating ΔAPD over a range of drug concentrations, and in example AP traces showing effects at 3*EFTPC.
Because recently published clinical studies on COVID‐19 treatments have delivered combination therapy, 1 , 2 , 3 , 4 , 5 we next simulated the combined effects of LP + RT 1 , 2 and CQ + AZ. 3 , 4 , 5 Importantly, the simulations predict that combination therapy causes a greater increase in APD (ΔAPD) than does either drug in isolation. For instance, at 3 times EFTPC, CQ + AZ individually produce ΔAPD of 43.2 and 43.2 ms, respectively, whereas ΔAPD is 86.5 ms for combination therapy (Figure 1d ). Similarly (Figure 1e ), ΔAPD for lopinavir and ritonavir is larger (66.7 ms) than that produced by either drug in isolation (41.4 and 27.0 ms, respectively).
Although the mechanistic simulations indicate the possibility for pharmacodynamic interactions during combination therapy, drug concentrations in patients may not reach the levels assumed in the simulations. To more accurately incorporate clinical drug concentrations, we implemented models based on quantitative PK studies on these drugs. 9 , 10 , 11 , 12 Simulations with a model developed for LP + RT therapy, 10 shown in Figure 2a , predict higher LP concentrations with combination therapy (400 mg/100 mg twice daily) than with LP therapy alone (400 mg twice daily). This occurs due to PK interactions whereby RT inhibits LP clearance. Simulations were next performed in a virtual population to predict how drug plasma concentrations vary between individuals. These results suggest that, between extreme individuals in a population, peak concentrations of either drug may differ by > 10‐fold. To link the PK model predictions with the mechanistic simulations, we calculated the mean peak concentration of the 5% of the patients with the highest drug concentrations (highlighted in red in Figure 2 ), and then used those values as inputs to the cellular QSP model.
Figure 2.
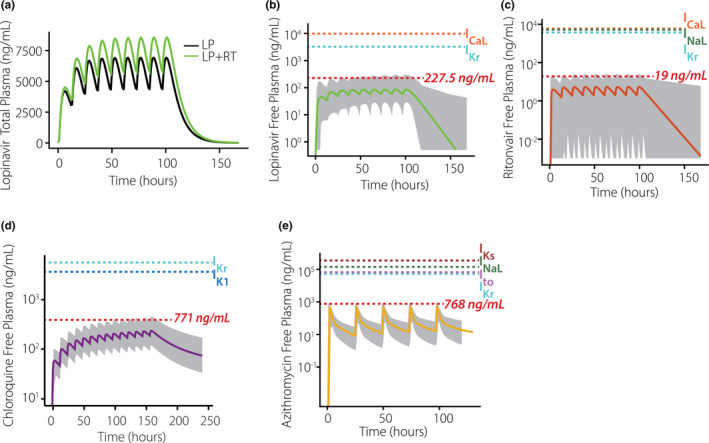
Simulated population pharmacokinetics of coronavirus disease 2019 (COVID‐19) drugs. (a) Simulations show that plasma concentrations of lopinavir (LP) are greater with co‐administration of ritonavir (RT) than when the former drug is given alone. (b) Predicted free plasma concentrations of LP under standard dosing regimen with RT. (c) Predicted free plasma concentrations of RT under standard dosing regimen with LP. (d) Predicted free plasma concentrations of chloroquine under standard dosing regimen. (e) Predicted free plasma concentrations of azithromycin under standard dosing regimen. In b–e, the thick line indicates the median individual within a virtual population of 1,000 (gray shaded area), the red dashed line indicates mean peak concentration of the 5% of the patients with highest drug concentrations, and additional dashed lines indicate IC50 values for cardiac ion channel inhibition.
Figure 2d,e show predicted concentrations under standard dosing regimens of CQ (500 mg b.i.d. for 7 days) and AZ (daily dosing, 500 mg), respectively. Because most prior studies do not suggest PK interactions between these two drugs, plasma concentrations during combination therapy can be predicted from simulations of each drug in isolation. AZ concentrations for QSP model simulations were predicted based on peak concentrations in the top 5% of individuals, as with LP and RT. Predictions of the cardiac effects of CQ, however, are complicated by two factors: (i) uncertainty about the fractions of bound vs. unbound drug, and (ii) evidence that the drug accumulates in target tissues, including the heart. 9 , 29 To translate plasma PK results to drug concentrations for myocyte simulations, we examined results from a recent study with a physiologically‐based PK model for CQ that incorporated drug accumulation in different tissues. 9 This study predicted that, on average, CQ concentrations in the heart were at least 25 times higher than concentrations in plasma (minimum of 10,000 ng/mL in the heart vs. roughly 400 ng/mL in plasma, depending on dosing regimen). Based on this study, we therefore used a free cardiac concentration of 3,900 ng/mL for QSP simulations (10,000 ng/mL multiplied by the unbound fraction of 39%). Because our population PK CQ plasma concentrations reach 771 ng/mL in select individuals, this represents a somewhat conservative estimate of drug accumulation in the heart.
Next, we sought to predict how sex differences and pre‐existing cardiac disease may influence the AP prolongation caused by COVID‐19 therapies. We used established methods to simulate differences in myocytes between men and women, 22 and between healthy and failing hearts. 23 Following these previous studies, 22 , 23 we scaled ionic current maximal conductances based on measured differences in ion transport pathways among groups (Figure 3a ). We refer to the four groups as healthy male, HF male, healthy female, and HF female. The parameter modifications illustrated in Figure 3a altered myocyte AP waveforms in both the absence and presence of drugs. For instance, Figure 3b shows baseline model APs in the four groups without (black dashed lines) and with (colored lines) estimated clinical concentrations of CQ + AZ. AP prolongation (ΔAPD) was quite substantial with this drug regimen and was greatest in the simulated HF female cell (ΔAPD = 249 ms in HF female vs. 166 ms in healthy male). For clinical concentrations of LP + RT, predicted AP prolongation was modest (< 10 ms) in all four cell types (Figure 3c ).
Figure 3.
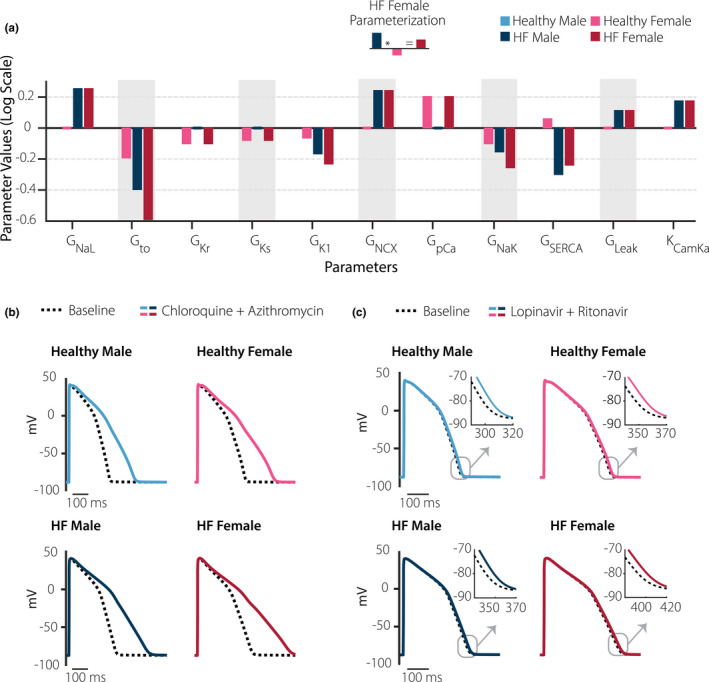
Sex differences and cardiac disease influence cardiac effects of coronavirus disease 2019 (COVID‐19) drugs. (a) With the baseline model defined as the healthy male myocyte, bars illustrate alterations to model parameters that were implemented to simulate myocytes from healthy female, diseased male, and diseased female hearts. Y‐axis represents natural logarithm of the fold change in each parameter such that increases are positive and decreases are negative (i.e., an increase in a parameter by a factor of e (2.718) would be represented as + 1). (b) Effects of clinical concentrations of lopinavir plus ritonavir in the four groups where black dashed lines are action potentials (Aps) with no drug, and solid colored lines show effects of drugs. (c) Effects of clinical concentrations of chloroquine plus azithromycin in the four groups. In both cases, simulated action potential prolongation was greatest in the baseline female heart failure (HF) myocyte.
Finally, we generated four virtual populations to simulate physiological variability among individuals. With this approach, random variation in parameter values caused heterogeneity in AP waveforms in the four groups (Figure 4a ). Distributions of ΔAPD across each population show that AP prolongation is greatest in the HF female group, for both CQ + AZ and LP + RT and therapy (Figure 4b ). For LP + RT therapy, median AP prolongation is below 10 ms in all groups, but can reach as high as 15 ms for individual cells in the HF female population. CQ + AZ therapy, which produced greater AP prolongation in general, could also cause arrhythmic dynamics in select myocytes. The number of cells exhibiting arrhythmic dynamics was greater in the HF female group (85 of 1,000 cells) compared with any other group (1 cell in healthy male, 16 cells in HF male, and 19 cells in healthy female groups).
Figure 4.
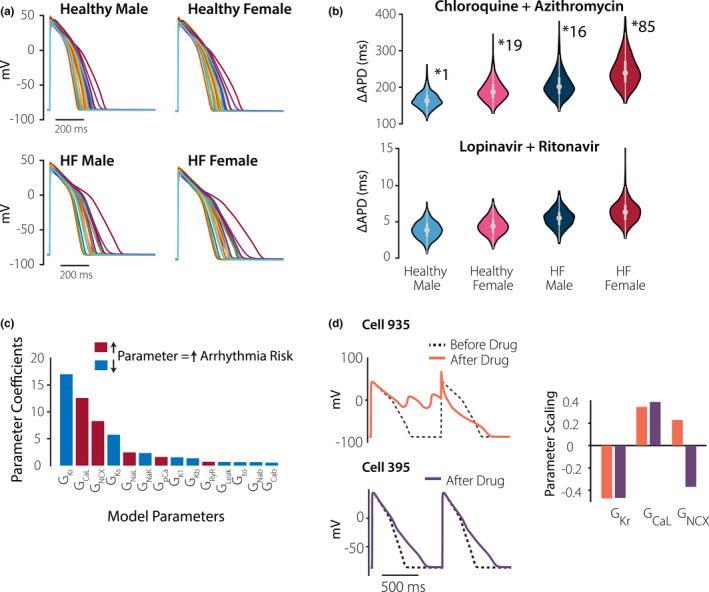
Virtual population simulations and arrhythmia susceptibility in female heart failure group. (a) Virtual population simulations of the four groups, as indicated. Each panel shows 20 action potentials (APs) from the population of 1,000. (b) Distributions of drug‐induced action potential prolongation (ΔAPD) by different drug combinations, in the four populations, as indicated. With chloroquine + azithromycin treatment, arrhythmic dynamics were observed in 1 cell (healthy male), 16 cells (HF male), 19 cells (healthy female), and 85 cells (HF female) from each 1,000 cell population. (c) Parameter sensitivity values obtained from logistic regression analysis of the HF female population. Parameters are rank ordered from greatest to least effect on arrhythmic dynamics, and are color‐coded based on whether an increase in a parameter will increase or decrease the arrhythmia probability. (d) Simulation results comparing two cells from the HF female population to indicate the importance of Na+‐Ca2+ exchange (NCX) in determining arrhythmia susceptibility. Results show action potentials before (dashed black line) and after (colored lines) application of chloroquine + azithromycin. The two cells had comparable levels of GKr and GCaL, but different levels of GNCX, as indicated by the bar graphs. Drugs caused arrhythmic dynamics in cell 935, with higher than normal GNCX, but not in Cell 395, with lower than normal GNCX.
To determine the factors that control susceptibility of individual myocytes to drug‐induced arrhythmias, we performed logistic regression analysis on the HF female population. This analysis 27 , 28 quantifies each parameter’s importance in determining whether arrhythmias occur, and Figure 4c shows the 14 most predictive parameters (from a total of 17 analyzed). The top two parameters identified through this approach, rapid delayed rectifier K+ current and L‐type Ca2+ current, were expected based on prior research. 13 , 14 , 15 The third most important parameter, however, Na+‐Ca2+ exchanger (GNCX), was a surprising result. To examine this more closely, we identified two cells from the HF female population (cells 935 and 395) that had similar levels of rapid delayed rectifier K+ current and L‐type Ca2+ current, but different levels of GNCX (bar graphs in Figure 4d ). Specifically, GNCX was larger than normal in cell 935 but smaller than normal in cell 395. Simulated application of CQ + AZ caused arrhythmic dynamics in cell 935, but not in cell 395 (Figure 4d ), confirming the prediction that high levels of NCX may predispose individuals to these arrhythmias.
DISCUSSION
The simulation results presented here indicate that proposed treatments for COVID‐19 do indeed carry cardiac risk, and special caution should be exercised when developing combination therapies. With standard dosing regimens, the simulations suggest that AP prolongation is primarily driven by either LP or CQ in the two combination therapy regimens examined, with CQ causing the most pronounced effects. This result is consistent with a recent small clinical trial in Brazil, which was terminated due to increased mortality in the high‐dose CQ arm of the study. 3 An improved safety profile may be a reason for clinicians to favor the CQ derivative hydroxychloroquine for COVID‐19, 30 but this drug is also associated with cardiac adverse events. 6
Our results are also consistent with a handful of recent studies that have used a variety of quantitative approaches to assess the cardiac risks from COVID‐19 therapies. These have ranged from a simple clinical decision tree 31 to an empirical algorithm that incorporates factors, such as drug metabolism and pharmacovigilance data, 32 to simulations with mechanistic QSP models similar to those used here. 33 A common theme of both these studies and the present work is that the risks posed by COVID‐19 therapies are not constant across the population but depend on factors, such as patient demographics and pre‐existing conditions. In particular, our virtual population simulations suggest that women with HF will be at greatest risk of arrhythmia during treatment with these drugs. This increased vulnerability of women, combined with the generally worse prognosis for men with COVID‐19, 34 suggests that sex differences should be considered when weighing risks against benefits. Our results, considered in the context of other recent studies, 31 , 32 , 33 suggest factors that can be incorporated in future simulation studies of drug risks. These can include fever and inflammation, which are associated with COVID‐19 and can influence the electrophysiology of cardiac myocytes. Additional variables that should also be considered in future work include the potential effects of drug metabolites and the possibility that, during combination therapy, two drugs may interact at the ion channel level in either a synergistic or antagonistic manner.
Despite these limitations, the research presented illustrates how simulations of both drug disposition and drug mechanisms can be combined to assess the risk of adverse events within particular patient groups, which can help to guide treatment decisions during this rapidly evolving pandemic.
Funding
Research in E.A.S. laboratory is supported by the National Institutes of Health (U01 HL136297, U54 HG008098), the National Science Foundation (MCB 1615677) and the US Food and Drug Administration (75F40119C10021). M.V. is supported by a fellowship from the National Heart Lung and Blood institute (F31 HL149358) and has previously been supported by a training grant from the National Institute of General Medical Sciences (T32 GM062754).
Conflict of Interest
I.I.‐A. is an employee of AstraZeneca. This research mostly predates and is completely unrelated to her work with AstraZeneca. All other authors declared no competing interest for this paper.
Author Contributions
E.A.S. wrote the manuscript. M.V., I.I.‐A., C.C., R.D., A.G., T.K.P., and E.A.S. designed the research. M.V. and I.I.‐A. performed the research. M.V., I.I.‐A., C.C., R.D., A.G., T.K.P., and E.A.S. analyzed the data.
Disclaimer
As Associate Editor of CPT: Pharmacometrics and Systems Pharmacology, Eric A. Sobie was not involved in the review or decision process for this paper.
Supporting information
Supplementary Material
References
- 1. Cao, B. et al A trial of lopinavir‐ritonavir in adults hospitalized with severe Covid‐19. N. Engl. J. Med. 382, 1787–1799 (2020). [DOI] [PMC free article] [PubMed] [Google Scholar]
- 2. Costanzo, M. , De Giglio, M.A.R. & Roviello, G.N. SARS‐CoV‐2: recent reports on antiviral therapies based on lopinavir/ritonavir, darunavir/umifenovir, hydroxychloroquine, remdesivir, favipiravir and other drugs for the treatment of the new coronavirus. Curr. Med. Chem. 27, 4536–4541 (2020). [DOI] [PubMed] [Google Scholar]
- 3. Borba, M.G.S. et al Effect of high vs low doses of chloroquine diphosphate as adjunctive therapy for patients hospitalized with severe acute respiratory syndrome coronavirus 2 (SARS‐CoV‐2) infection: a randomized clinical trial. JAMA Netw. Open 3, e208857 (2020). [DOI] [PubMed] [Google Scholar]
- 4. Feeney, E. et al The COVIRL‐001 trial: a multicentre, prospective, randomised trial comparing standard of care (SOC) alone, SOC plus hydroxychloroquine monotherapy or SOC plus a combination of hydroxychloroquine and azithromycin in the treatment of non‐critical, SARS‐CoV‐2 PCR‐positive population not requiring immediate resuscitation or ventilation but who have evidence of clinical decline: a structured summary of a study protocol for a randomised controlled trial. Trials 21, 430 (2020). [DOI] [PMC free article] [PubMed] [Google Scholar]
- 5. Vouri, S.M. , Thai, T.N. & Winterstein, A.G. An evaluation of co‐use of chloroquine or hydroxychloroquine plus azithromycin on cardiac outcomes: a pharmacoepidemiological study to inform use during the COVID19 pandemic. Res. Social Adm. Pharm. https://doi.org/10.1016/j.sapharm.2020.04.031. [e‐pub ahead of print]. [DOI] [PMC free article] [PubMed] [Google Scholar]
- 6. Smith, T.B.J. , LeClaire, A. & Prosser, T. Elsevier clinical solutions: COVID‐19 drug therapy. Elsevier website Updated April 30, 2020 <https://www.elsevier.com/__data/assets/pdf_file/0007/988648/COVID‐988619‐Drug‐Therapy_March‐982020.pdf> (2020).
- 7. Saleh, M. et al The effect of chloroquine, hydroxychloroquine and azithromycin on the corrected QT interval in patients with SARS‐CoV‐2 infection. Circ. Arrhythm. Electrophysiol. 13, e008662 (2020). [DOI] [PMC free article] [PubMed] [Google Scholar]
- 8. Zhang, Y. , Xu, Q. , Sun, Z. & Zhou, L. Current targeted therapeutics against COVID‐19: based on first‐line experience in China. Pharmacol. Res. 157, 104854 (2020). [DOI] [PMC free article] [PubMed] [Google Scholar]
- 9. Cui, C. et al Dose selection of chloroquine phosphate for treatment of COVID‐19 based on a physiologically based pharmacokinetic model. Acta Pharmaceutica Sinica B 10, 1216–1227 (2020). [DOI] [PMC free article] [PubMed] [Google Scholar]
- 10. Wang, K. et al Integrated population pharmacokinetic/viral dynamic modelling of lopinavir/ritonavir in HIV‐1 treatment‐naive patients. Clin. Pharmacokinet. 53, 361–371 (2014). [DOI] [PMC free article] [PubMed] [Google Scholar]
- 11. Zheng, S. , Matzneller, P. , Zeitlinger, M. & Schmidt, S. Development of a population pharmacokinetic model characterizing the tissue distribution of azithromycin in healthy subjects. Antimicrob. Agents Chemother. 58, 6675–6684 (2014). [DOI] [PMC free article] [PubMed] [Google Scholar]
- 12. Abd‐Rahman, A.N. et al Population pharmacokinetics and pharmacodynamics of chloroquine in a plasmodium vivax volunteer infection study. Clin. Pharmacol. Ther. 108, 1055–1066 (2020). [DOI] [PMC free article] [PubMed] [Google Scholar]
- 13. Lancaster, M.C. & Sobie, E.A. Improved prediction of drug‐induced torsades de pointes through simulations of dynamics and machine learning algorithms. Clin. Pharmacol. Ther. 100, 371–379 (2016). [DOI] [PMC free article] [PubMed] [Google Scholar]
- 14. Li, Z. et al Assessment of an in silico mechanistic model for proarrhythmia risk prediction under the CiPA initiative. Clin. Pharmacol. Ther. 105, 466–475 (2019). [DOI] [PMC free article] [PubMed] [Google Scholar]
- 15. Passini, E. et al Human in silico drug trials demonstrate higher accuracy than animal models in predicting clinical pro‐arrhythmic cardiotoxicity. Front. Physiol. 8, 668 (2017). [DOI] [PMC free article] [PubMed] [Google Scholar]
- 16. Crumb, W.J. Jr , Vicente, J. , Johannesen, L. & Strauss, D.G. An evaluation of 30 clinical drugs against the comprehensive in vitro proarrhythmia assay (CiPA) proposed ion channel panel. J. Pharmacol. Toxicol. Methods 81, 251–262 (2016). [DOI] [PubMed] [Google Scholar]
- 17. O'Hara, T. , Virag, L. , Varro, A. & Rudy, Y. Simulation of the undiseased human cardiac ventricular action potential: model formulation and experimental validation. PLoS Comput. Biol. 7, e1002061 (2011). [DOI] [PMC free article] [PubMed] [Google Scholar]
- 18. Patterson, K.B. et al Protein binding of lopinavir and ritonavir during 4 phases of pregnancy: implications for treatment guidelines. J. Acquir. Immune Defic. Syndr. 63, 51–58 (2013). [DOI] [PMC free article] [PubMed] [Google Scholar]
- 19. Walker, O. , Birkett, D.J. , Alvan, G. , Gustafsson, L.L. & Sjoqvist, F. Characterization of chloroquine plasma protein binding in man. Br. J. Clin. Pharmacol. 15, 375–377 (1983). [DOI] [PMC free article] [PubMed] [Google Scholar]
- 20. Regitz‐Zagrosek, V. & Kararigas, G. Mechanistic pathways of sex differences in cardiovascular disease. Physiol. Rev. 97, 1–37 (2017). [DOI] [PubMed] [Google Scholar]
- 21. Kannankeril, P. , Roden, D.M. & Darbar, D. Drug‐induced long QT syndrome. Pharmacol. Rev. 62, 760–781 (2010). [DOI] [PMC free article] [PubMed] [Google Scholar]
- 22. Yang, P.C. et al A multiscale computational modelling approach predicts mechanisms of female sex risk in the setting of arousal‐induced arrhythmias. J. Physiol. 595, 4695–4723 (2017). [DOI] [PMC free article] [PubMed] [Google Scholar]
- 23. Gomez, J.F. , Cardona, K. , Romero, L. , Ferrero, J.M. Jr & Trenor, B. Electrophysiological and structural remodeling in heart failure modulate arrhythmogenesis. 1D simulation study. PLoS One 9, e106602 (2014). [DOI] [PMC free article] [PubMed] [Google Scholar]
- 24. Devenyi, R.A. & Sobie, E.A. There and back again: Iterating between population‐based modeling and experiments reveals surprising regulation of calcium transients in rat cardiac myocytes. J. Mol. Cell Cardiol. 96, 38–48 (2016). [DOI] [PMC free article] [PubMed] [Google Scholar]
- 25. Varshneya, M. , Devenyi, R.A. & Sobie, E.A. Slow delayed rectifier current protects ventricular myocytes from arrhythmic dynamics across multiple species. Circ. Arrhythm. Electrophysiol. 11, e006558 (2018). [DOI] [PMC free article] [PubMed] [Google Scholar]
- 26. Gong, J.Q.X. & Sobie, E.A. Population‐based mechanistic modeling allows for quantitative predictions of drug responses across cell types. NPJ Syst. Biol. Appl. 4, 11 (2018). [DOI] [PMC free article] [PubMed] [Google Scholar]
- 27. Lee, Y.S. , Liu, O.Z. , Hwang, H.S. , Knollmann, B.C. & Sobie, E.A. Parameter sensitivity analysis of stochastic models provides insights into cardiac calcium sparks. Biophys. J. 104, 1142–1150 (2013). [DOI] [PMC free article] [PubMed] [Google Scholar]
- 28. Morotti, S. & Grandi, E. Logistic regression analysis of populations of electrophysiological models to assess proarrythmic risk. MethodsX 4, 25–34 (2017). [DOI] [PMC free article] [PubMed] [Google Scholar]
- 29. Ducharme, J. & Farinotti, R. Clinical pharmacokinetics and metabolism of chloroquine. Clin. Pharmacokinet. 31, 257–274 (1996). [DOI] [PubMed] [Google Scholar]
- 30. Gautret, P. et al Hydroxychloroquine and azithromycin as a treatment of COVID‐19: results of an open‐label non‐randomized clinical trial. Int. J. Antimicrob. Agents 56, 105949 (2020). [DOI] [PMC free article] [PubMed] [Google Scholar]
- 31. Giudicessi, J.R. , Noseworthy, P.A. , Friedman, P.A. & Ackerman, M.J. Urgent guidance for navigating and circumventing the QTc‐prolonging and torsadogenic potential of possible pharmacotherapies for coronavirus disease 19 (COVID‐19). Mayo Clin. Proc. 95, 1213–1221 (2020). [DOI] [PMC free article] [PubMed] [Google Scholar]
- 32. Al Rihani, S.B. et al Risk of adverse drug events following the virtual addition of COVID‐19 repurposed drugs to drug regimens of frail older adults with polypharmacy. J. Clin. Med. 9, 2591 (2020). [DOI] [PMC free article] [PubMed] [Google Scholar]
- 33. Sutanto, H. & Heijman, J. Beta‐adrenergic receptor stimulation limits the cellular proarrhythmic effects of chloroquine and azithromycin. Front. Physiol. 11, 587709 (2020). [DOI] [PMC free article] [PubMed] [Google Scholar]
- 34. Helmy, Y.A. et al The COVID‐19 pandemic: a comprehensive review of taxonomy, genetics, epidemiology, diagnosis, treatment, and control. J. Clin. Med. 9, 1225 (2020). [DOI] [PMC free article] [PubMed] [Google Scholar]
Associated Data
This section collects any data citations, data availability statements, or supplementary materials included in this article.
Supplementary Materials
Supplementary Material