

Abstract
By analysing the evolution of the COVID‐19 epidemic in the state of Minas Gerais, Brazil, we showed the importance of considering the sub‐notification not only of deaths but also of infected cases. It was shown that the largely used criteria of a historical all‐deaths baseline are not approachable in this case, where most of the deaths are associated with causes that should decrease due to social distancing and reduction of economic activities. A quite simple and intuitive model based on the Gompertz function was applied to estimate excess deaths and excess of infected cases. It fits well the data and predicts the evolution of the epidemic adequately. Based on these analyses, an excess of 21.638 deaths and 557.216 infected cases is predicted until the end of 2020, with an upper bound of the case fatality rate of around 2.4% and a prevalence of 2.6%. The geographical distribution of cases and deaths and its ethnic correlation are also presented. This study points out the necessity of governmental and private organizations working together to improve public awareness and stimulate social distancing to curb the viral infection, especially in critical places with high poverty.
Keywords: COVID‐19, ethnic distribution, Gompertz function, Minas Gerais, sub‐notification
COVID‐19 in Minas Gerais State.
1. INTRODUCTION
Since China began communicating deaths due to an unknown pneumonia in late December 2019, an outbreak of a new virus identified as SARS‐CoV‐2 has been in course. On March 16th, the first death by COVID‐19 was reported in Brazil. Currently (October 26th), 157.226 official deaths and 5.395.920 confirmed SARS‐CoV‐2 infections have been reported (Worldometer, 2020). Brazil has 211 million inhabitants, corresponding to 2.7% of the world population. However, more than 13% of worldwide COVID‐19 cases and deaths are concentrated in Brazil. Almost half (45%) of the officially reported COVID‐19 deaths are concentrated in the southeast region of Brazil, mainly in the states of São Paulo and Rio de Janeiro (Oliveira et al., 2020; SUS, 2020; Xavier et al., 2020). Minas Gerais is the largest southeast state, located in the richest Brazilian region, with high connectivity by roads to other states and a large flux of goods and persons. It has an extension of 586,528 km2 and 21 million people on average, similar to Ukraine, France and Spain. Nevertheless, according to official sources, it accumulates less than 8.800 deaths (SUS, 2020). The aforementioned state plays an important role due to its agribusiness and mining industry impacting strongly on the national economy under a pandemic scenario, leading to cost lives and business decrease. Test coverage is 5.45 tests per 1.000 inhabitants (considering serological and PCR tests), the second smallest among Brazilian states (Ariadne, 2020). The social distancing percentage in Minas Gerais dropped from about 53% in the last week of March to around 38% in the last week of October (InLoco, 2020). In a scenario of a large population, intense human fluxes, and decrease in social distancing, the low coverage of COVID‐19 testing represents the jeopardy of such striking underestimated deaths reported by governmental sources.
As the number of COVID‐19 patients is increasing dramatically (Han et al., 2020), it is crucial to triage and evaluate confirmed infected/death cases. There is evidence suggesting that infected but asymptomatic people are still able to infect others (Day, 2020) and SARS‐CoV‐2 transmission from these cases has already been observed (Rothe et al., 2020; Tong et al., 2020). Likewise, superspreading events (SSEs), which are associated with both explosive growths early in an outbreak and sustained transmission in later stages, have been reported (Frieden & Lee, 2020), leading to higher mortality. Simulation makes available rapid estimation of the infections course, providing quantification and understanding of the spatiotemporal outbreak spreading (Siettos & Russo, 2013). In this context, correct assessments of cases in a target population, as well as the trend of infections/deaths, provide important insights which might guide authorities when making decisions (Nishiura et al., 2020).
Public data from the Registry Office (RO) (Cartorio, 2020) have pointed out 1.654 excess deaths due to severe acute respiratory syndrome (SARS) and COVID‐19 in 2020 in Minas Gerais compared to the same period in 2019 (January 1st to July 1st). It represents 115% of the COVID‐19 official deaths informed by the State Surveillance Service, indicating potential excess deaths attributable to sub‐notified COVID‐19 deaths. The standard approach to calculate the expected number of deaths, in the absence of a given event of interest, uses the previous year's historical all‐deaths data for the same timeline as baseline reference (Nogueira et al., 2005). However, current social distancing and isolation are not comparable with any historical mortality rate reported so far, and therefore, this approach does not reflect the expected excess mortality presently observed. The aim of this study was to analyse and consider other criteria for better estimating deaths, infected cases and high mortality due to COVID‐19, comparing its geographic distribution as well as its impact in different ethnic groups in Minas Gerais.
2. MATERIAL AND METHODS
Our study collected and analysed Brazilian public datasets of COVID‐19, only. The use of anonymized public data dismissed the need of ethical committee approval. Data were evaluated from January 1st to July 17th of 2020, based on governmental cases and mortality reports (SUS, 2020), as well as daily mortality available in the RO Portal (Cartorio, 2020). We herein compared different mortality causes to obtain those not affected by social distancing and economic activity reduction. Excess mortality is calculated by the difference between COVID‐19 and other mortality causes in 2020 regarding the same timeline in 2019. To model the timeline of each data set and to predict future behaviour, a simple and very intuitive model based on the Gompertz function (Tjørve & Tjørve, 2017) was used. This model has been successfully used to model COVID‐19 mortality in China and other countries (Catala et al., 2020; Yang et al., 2020). It considers that the time evolution of the population (deaths and infected cases) can be simulated by re‐parametrized Gompertz functions (Tjørve & Tjørve, 2017) given by:
| (1) |
where N(t) is the cumulative number of deaths or infected cases at a given time t, Nmax is the maximum number of deaths or infected cases, r characterizes the growth rate, and Ti is the time at the inflection point of the curve. The daily deaths or infected cases toll corresponds to the first‐time derivative of N(t). In this case, the parameter Ti corresponds to the moment the curve peaks, and Nmax × r characterizes the curve maximum.
Depending on the characteristics of the data set, the sum of two Gompertz functions might be needed. This will be indicated by the analysis of each data set. The six tables that summarize the values and errors of the fitting parameters obtained from the fitting of the model to the data presented in each figure are described in Appendix S1 section.
3. RESULTS
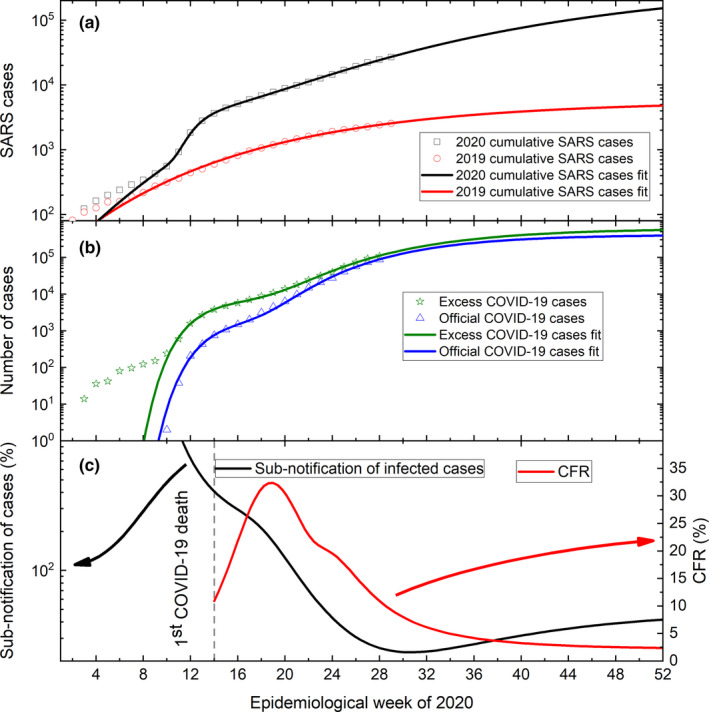
The officially reported COVID‐19 cases and deaths timeline are shown in Figure 1. Considering the total of inhabitants, the number of cases and deaths can be considered small. However, after saturation of daily cases in the third week of April, a new rise in the curve of infected cases at the end of April can be observed. The same behaviour was observed in the curve of deaths about 25 days later. Possibly, these growths could be attributed to the Social Distance Index, shown in Figure 1c. During this period, infections and deaths increased; meanwhile, a decline in social isolation was observed. A sum of two Gonpertz functions was necessary to appropriately fit both datasets over the whole timeline. The fitted curves have been extended to show the tendency to saturation of the number of infection cases and deaths by the end of the year. This model predicts a total number of 1.182.657 infected people and 15.703 deaths. The daily projected cases and death curves (first derivatives of the fit curves) clearly show the initial saturation of cases and deaths curves, followed by a strong and broad peak. The advantage of using the daily projected cases and death curves is to avoid strong oscillations (with approximately a 7‐day period) present in the daily reported new deaths and infected cases data. This model projects a peak of 102 daily deaths on September 8th, while the infected cases peak of 6.047 daily cases will be reached on September 30th. The case fatality rate (CFR) was calculated as the ratio between the cumulative number of deaths and the cumulative number of infected cases. The evolution of social distancing (InLoco, 2020) is shown in Figure 1(c). Our model describes well the pandemic evolution, nowcasts and forecasts. However, due to its simplicity, the total number of projected deaths and infected cases should be considered cautiously and depends on the evolution of social distancing. The values of the fitted parameters are shown in the Appendix S1.
Figure 1.

Time evolution of (a) the governmental infected cases reported (open black squares), (b) deaths (open red circles) and (c) social distancing (blue solid line) related to COVID‐19 in Minas Gerais, Brazil. The solid black and red lines in (a) and (b) correspond to the fit of the model to the reported data. Dash dot lines in (a) correspond to the projected daily number of infection cases (black line) and deaths (red line). The dash line in (b) corresponds to the projected case fatality rate (CFR) [Colour figure can be viewed at wileyonlinelibrary.com]
Another scenario arises when the excess of deaths during the COVID‐19 pandemic is considered. The standard approach to calculate excess mortality uses the previous year's historical all‐deaths data as reference (Nogueira et al., 2005). However, in the current pandemic, with social distancing and closing of non‐essential economic activities, the situation is not comparable with any previously historical mortality series reported so far. The total deaths in Minas Gerais between 2008 and 2014 increased 21% and then varied significantly between 2015 and 2018 (18% of variation), making the use of any kind of historical series unapproachable. In addition, transport accidents and deaths by assaults two of the most important mortality causes in Minas Gerais should heavily decrease during this period because of the reasons mentioned above.
Figure 2 shows a comparison between the different causes of death between 2019 (dashed lines) and 2020 (solid lines) in Minas Gerais (Cartorio, 2020). It is worthy to note that until the 14th epidemiologic week of 2020, when the epidemic of COVID‐19 started in Minas Gerais, the weekly number of deaths for all causes in 2020 oscillated similarly to the ones observed in 2019. However, beyond that week most of the 2020 causes of deaths, except for SARS, fall systematically below the values of 2019, probably as an effect of social distancing measurements. We interpret the sharp drop after week 25th, marked by a grey area, as a four to five weeks delay to update the RO database. Therefore, to calculate the excess deaths in 2020 regarding data from 2019, we should consider only until the 25th epidemiologic week of 2020 and only COVID‐19 and SARS death causes. This excess is calculated as follows: from the total number of deaths caused by COVID‐19 plus SARS in 2020, the number of deaths caused by SARS in 2019 is subtracted. We assumed that all other causes of death were affected by social distancing and decreased economic activities and were therefore not considered in the excess deaths’ calculation.
Figure 2.
Comparison between the weekly number of deaths from all causes during the first 29 epidemiologic weeks of 2020 (solid lines) regarding the same period in 2019 (dashed lines). The vertical dotted line marks the COVID‐19 epidemic starting in Minas Gerais. The grey area represents the time delay to update the RO database [Colour figure can be viewed at wileyonlinelibrary.com]
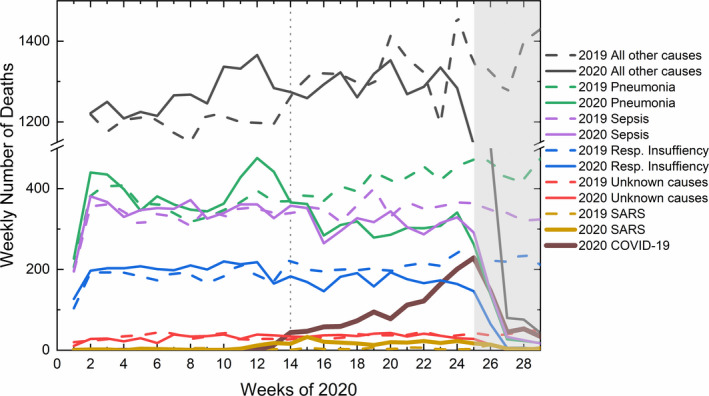
The excess deaths (open black squares) calculated according to the above developed methodology is presented in Figure 3. Since data have been harvested from 2 different public platforms (Cartorio, 2020; SUS, 2020), the reported deaths by COVID‐19 in both platforms have also been plotted. Both platforms use different approaches to compile the number of deaths caused by COVID‐19. Whereas the governmental data (open red circles) are collected by reports from health surveillance, RO collects the number of deaths (open blue triangles and open black squares) from registered death certificates. Therefore, not only the number of deaths attributed to COVID‐19 will be different, but also the time delay in updating both databases. The sum of two Gompertz functions was used to well fit all datasets. The values of the fitted parameters can be found in the Appendix S1. The excess deaths curve modelling predicts a peak of 135 daily deaths on September 22nd, two weeks later, and 32% higher than that predicted by the governmental data. The difference between the RO and the governmental data is due to COVID‐19 deaths sub‐notification. The upper bound of the sub‐notification can be estimated by the difference between excess deaths and the governmental reported deaths, while the lower bound of the sub‐notification can be estimated by the difference between RO and governmental reported deaths. The time evolution of the sub‐notification is shown in Figure 3(b).
Figure 3.
(a) Time evolution of excess of deaths (open black squares), RO COVID‐19 related deaths (open blue triangles) and governmental COVID‐19 deaths (open red circles). Solid lines correspond to the best fit of the model to the data sets (see text for details). (b) Calculated variation of the upper (red line) and lower (green line) bounds of the sub‐notification along 2020 [Colour figure can be viewed at wileyonlinelibrary.com]
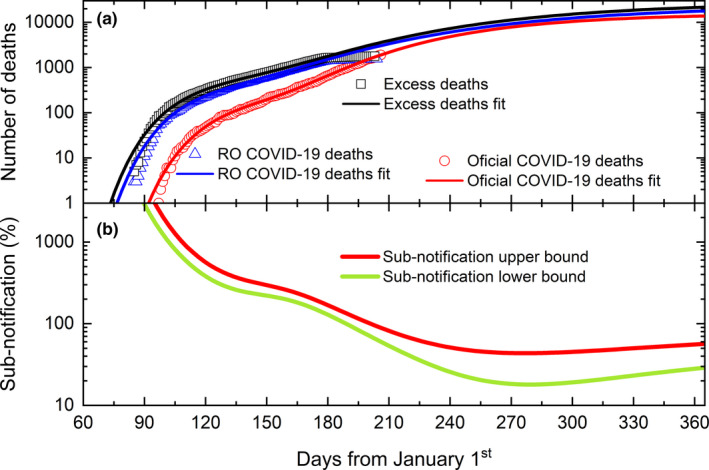
As shown above, untested COVID‐19 deaths can be erroneously diagnosed and reported as SARS deaths. We suppose the same problem is happening for the diagnosis of moderate infection cases. We consider as moderate infection cases those that were erroneously diagnosed as SARS cases but did not result in death. Therefore, the same methodology applied to estimate the sub‐notification of COVID‐19 deaths will be used to estimate the sub‐notification of COVID‐19 moderate cases. Figure 4 (a) shows the evolution of cumulative weekly SARS cases (Infogripe, 2020) in 2020 (black solid squares) and 2019 (red solid circles). Interestingly, during the first 9 weeks of the year, the number of cases reported in 2020 and 2019 were similar. However, as soon as the COVID‐19 epidemic started in Minas Gerais, end of week 9th, the number of SARS in 2020 cases heavily increased compared to 2019. Since there were no reported additional epidemics related to respiratory symptoms apart from COVID‐19 as well as those of every year, we interpret that difference as non‐diagnosed cases of COVID‐19.
Figure 4.
(a) Weekly evolution of the cumulative number of SARS cases in 2020 (open black squares) compared to 2019 (open red diamonds). Black and red lines correspond to the best fit of the model to the data sets (see text for details). (b) Calculated excess of COVID‐19 cases (open green stars) and COVID‐19 governmental reports (open blue triangles). Green and blue lines correspond to the best fit of the model to the data sets. (c) Calculated sub‐notification of COVID‐19 cases (black line) and CFR upper bound (red line) [Colour figure can be viewed at wileyonlinelibrary.com]
Figure 4(b) shows the evolution of COVID‐19 excess cases (green open stars), calculated as the difference between SARS and COVID‐19 cases in 2020 related to 2019 SARS cases. For comparison, the cumulative weekly number of reported COVID‐19 cases (blue open triangle) is also plotted. The excess COVID‐19 cases data set has been well fitted by the sum of two Gompertz functions (red solid line). The officially reported COVID‐19 cases data have also been well fitted by a sum of two Gompertz functions (blue solid line). The fitted parameter values are shown in the Appendix S1.
The sub‐notification of COVID‐19 cases upper bound can be calculated now as the difference between the excess cases and governmental reported cases and is shown in Figure 4(c). An estimation of CFR upper bound can now be obtained considering the excess of deaths and the excess of infected cases, as shown in Figure 4(c).
Ethnic discrepancies impact healthcare access in Minas Gerais where self‐declared black and brown‐skinned people have lower incomes and less access to health assistance than self‐declared white people (IBGE, 2020). Herein, we include the impact of COVID‐19 in both ethnics separating the data presented in Figure 1 by self‐declared skin colour or ethnicity of the patients. We have considered as black patients the sum of all self‐declared black and brown‐skinned patients, while white patients correspond to self‐declared white only. To calculate the percentage of cases and deaths from black persons, we have also considered patients that were not classified in both groups. In this case, the availability of data separated by self‐declared skin colour was restricted up to June 24th.
Figure 5(a) shows the cumulative number of infected cases evolution, separated by black (open black squares) and white patients (open blue circles). A small increase of cases of black patients can be observed. The modelling of the data sets (solid lines) predicts an increase of such difference towards the end of the year. The percentage progression of infected black patients (regarding the overall patients), as calculated from the modelling results, is shown by the dashed red line. This number oscillates between 60% and 55% from the beginning of the epidemic towards the end of 2020.
Figure 5.
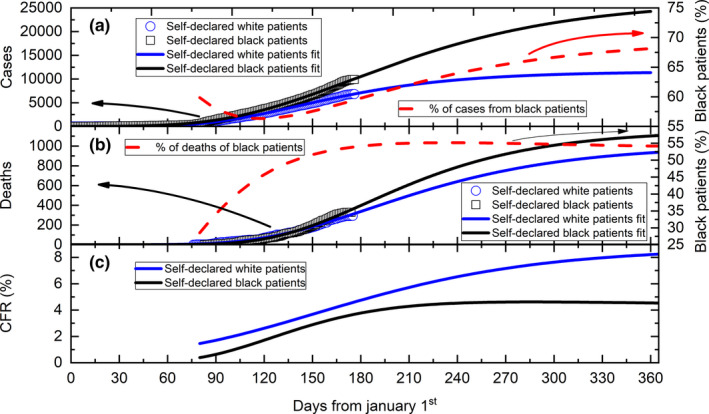
(a) Daily evolution of the cumulative number of COVID‐19 cases in black (open black squares) and white patients (open blue circles). The solid lines correspond to the best fit of the model to the data sets (see text for details). The dashed line corresponds to the percentage of cases in black patients. (b) Daily evolution of the cumulative number of deaths from COVID‐19 in black (open black squares) and white patients (open blue circles). The solid lines correspond to the best fit of the model to the datasets (see text for details). The dashed line corresponds to the percentage of deaths in black patients. (c) Calculated CFR values in black (black line) and white (blue line) patients, using the data presented in (a) and (b) [Colour figure can be viewed at wileyonlinelibrary.com]
The cumulative deaths progression is shown in Figure 5(b). A small increase of deaths among black patients (open black squares) can be observed in recent days. The modelling of the data sets (solid lines) also predicts an increase of such difference towards the end of the year. The percentage change in deaths in black patients (regarding the overall number of patients), as calculated from the modelling results, is shown by the dashed red line. This number rises from around 27% at the beginning of the epidemic to a saturation of about 54% at the end of 2020.
The CFR of both populations can be calculated from these modelled results. Figure 5(c) shows the timeline of CFR for each population. As can be seen, a saturation of about 4.5% for black patients was predicted while for white patients, an increase of 8.2% was calculated towards the end of 2020.
Demography has been also impacting COVID‐19 pandemic in Minas Gerais. Then, in Figure 6 we demonstrate the number of cases and deaths (same data as in Figure 5) per 100.000 inhabitants separated by municipality and self‐declared skin colour.
Figure 6.
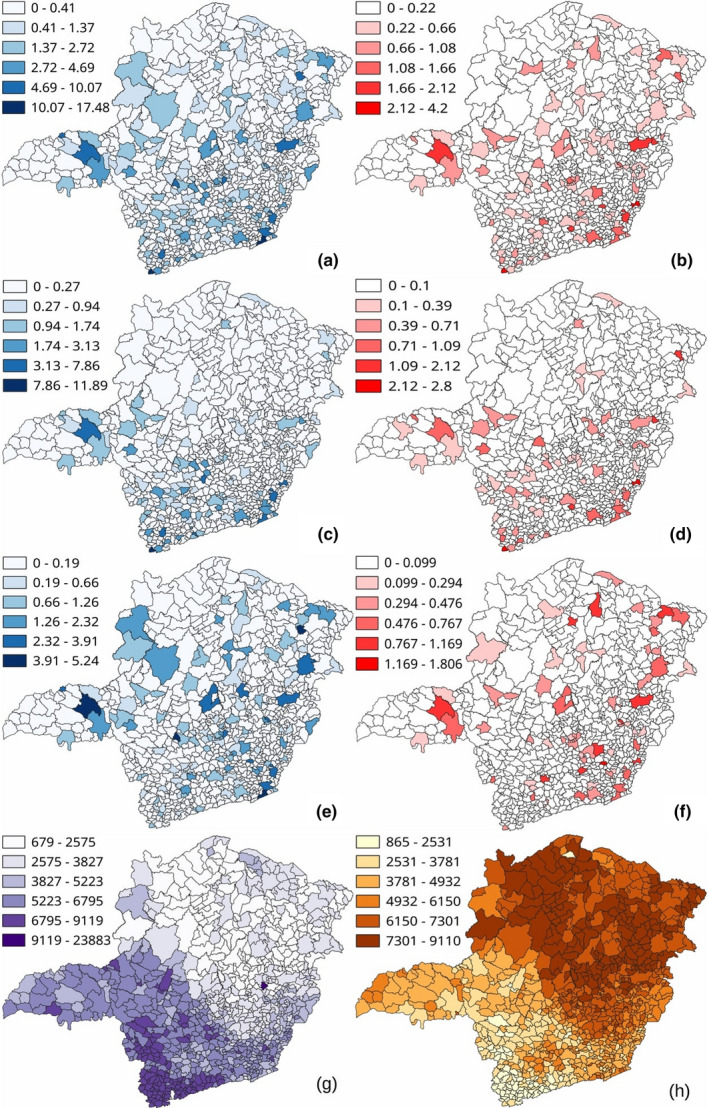
Geographic distribution of all municipalities of Minas Gerais informing (a) cases of COVID‐19, (b) deaths from COVID‐19, (c) cases white patients, (d) deaths of white patients, (e) cases of black patients, (f) deaths of black patients. Maps (g) and (h) show the distribution of white and black inhabitants, respectively. All data have been normalized per 100.000 inhabitants [Colour figure can be viewed at wileyonlinelibrary.com]
Interestingly, the distribution of cases and deaths is non‐uniform across the state. There are municipalities with a higher number of cases and a lower number of deaths. Most cases and deaths per 100.000 inhabitants are not only concentrated in the capital, but in cities closer to the state borders with interstate connexions. There are also strong differences in locations with more cases and deaths in black and white patients. The number of cases and deaths in black patients is somehow better distributed along the territory, with a large incidence in the northern half. However, the cases and deaths in white patients are concentrated in the southern half, which is economically more developed and populated.
4. DISCUSSION
Notably, the epidemiologic picture is changing daily. While Brazil is facing a challenging scenario, especially considering people under social vulnerability, mostly blacks, other countries in Africa are predicted to be significantly affected by the ongoing COVID‐19 outbreak (Lone & Ahmad, 2020). A pandemic status like the one we are experiencing brings lots of concerns. The clinical and laboratory characteristics of Covid‐19 are non‐specific and similar to other viral infections, particularly respiratory diseases (Prasitsirikul et al., 2020). As the number of COVID‐19 patients is increasing dramatically (Han et al., 2020), it is crucial to predict the number of infected cases and deaths considering local health assistance availability. The real number of COVID‐19 infected cases is difficult, if not impossible, to obtain since most of the patients presenting mild symptoms are not accounted for. However, the number of patients that present moderate or acute symptoms is particularly important and possible to be estimated. They are the ones that will need sustained medical attention in hospitals and will potentially overburden the health system.
Several diseases can vary from fully asymptomatic to severe symptoms until clinical intervention, demanding for hospitalization and leading to death, which demonstrates the importance of the measurements of the case fatality ratio (CFR) to understand epidemic dynamics and disease burden (Cauchemez et al., 2019).The initial saturation of the number of infected cases observed throughout the third week of April in Figure 1(a), particularly visible in the curves of daily projected cases and deaths, is due to the reduction of social distancing. The social distancing index was about 30% before the COVID‐19 epidemic started in the state, then, it rapidly peaked at about 53% just before the first reported death. However, the continuous social distancing decrease until now (~38%) has produced a new rise in infected cases and deaths, clearly observed in the curves of daily projected cases and deaths. The CFR calculated from governmental data and plotted in Figure 1 (b) increased from 1% to 4.2% at the end of April, when it slowly decreased to 2.1% in the second week of July. The model predicts a further decrease to about 1.5% until the end of the year. In comparison, in the second week of July, Brazil exhibited a CFR = 3.8% and that rate varied between 16.8% and 2.3% among the ten countries with the largest reported COVID‐19 disease (SUS, 2020). This rate is calculated considering the tested infection cases and deaths only, mainly of hospitalized patients. Therefore, it should be considered biased, non‐realistic, and not necessarily an upper limit.
COVID‐19 epidemic significantly increased the mortality rate in 2020. Nevertheless, the number of deaths by other causes should decrease due to social distancing and the closing of non‐essential economic activities. Deaths caused by transport accidents and assaults were responsible for 52% of all deaths in Minas Gerais in 2018 (DATASUS, 2020), percentage that should heavily decrease due to the cited reasons. Deaths related to complications in hospital interventions, which are now postponed due to the epidemic, are also expected to decrease. In the same way, the decrease in the economic activities should reduce the number of deaths related to work accidents. Those reductions are clearly visible from the start of the COVID‐19 epidemic in Figure 2, except for SARS‐ and COVID‐19‐related deaths.
We interpret the rise of SARS‐related deaths as an excess mortality not explained by the officially COVID‐19 deaths reported in 2020. The governmental number of deaths is even considerably lower than that reported by the registry office. The projected COVID‐19 sub‐notification of deaths shows stabilization until the end of the year with a lower bound of about 30% and upper bound of about 57%, regarding governmental data. These numbers can be affected by a reduction of the social distancing index which as shown in Figure 1(c), has been continuously decreasing since the epidemic started in Minas Gerais.
The same methodology applied to estimate a more realistic number of deaths can also be applied to retrieve a more realistic estimate of COVID‐19‐infected cases, as shown in Figure 4(a) and 4(b). Our methodology indicates that in the 28th epidemiological week of 2020, the excess of moderate and severe infection cases was approximately 25% higher than the officially reported number, with a prevalence of 2.6%, leading to a projected sub‐notification of around 42% by the end of the year. A recent survey of COVID‐19‐infected cases (Hallari et al., 2020) reported a prevalence of 0.4%, with 95% CI between 0.2% and 0.7%, in the southeast region of Brazil. This number is 13 times lower than the value found in our study. Once calculated the excess of deaths and cases, a more realistic CFR was also calculated. This rate increased from about 11% in week 13th to around 32% in week 18th and decreased to a saturation of around 2.4% at the end of 2020. It is important to note that this CFR, calculated with more realistic data (excess of deaths and excess cases data), actually represents an upper limit. Another work based on reported cases suggests that in Minas Gerais, the number of cases and deaths has been stated only in a subset of the overall population, while SARS‐CoV‐2 appears widely dispersed in other states in the southeast region (Xavier et al., 2020). A recent estimation of the total number of COVID‐19‐infected people in the state capital (city of Belo Horizonte) indicates a number 75 times larger than the official one (Aguas, 2020). Applying this factor to the whole state and considering the excess of deaths calculated by our methodology, we can estimate a CFR lower bound of 0.03% by the end of the year.
Social inequalities in Brazil are intrinsically associated with ethnicities where most black people are among the poorest. A considerable number amount of black people lives in crowded communities, with reduced access to health care. Noticeably, according to the Brazilian Institute of Geographic and Statistics (IBGE, 2020), Minas Gerais has 60% of the population self‐declared black, against 39.7% of self‐declared white persons and 72% of black persons are also in the group with 10% lower incomes. The data presented in Figure 5 show that 60% of COVID‐19 cases are in black patients, fitting the demographic profile. Nonetheless, in the second half of April, only 55% of deaths corresponded to black patients, which is 5% below the demographic profile. Therefore, we understand that SARS‐CoV‐2 does not affect differently black and white populations in Minas Gerais. For unknown reasons, deaths among black patients are 5% lower than expected. A recent study suggests that a certain degree of cross protection can exist from previous infection by another coronavirus (Grifoni et al., 2020). We speculate that the self‐declared black population can be partially protected, due to being previously infected by another coronavirus. However, further studies are necessary to understand this discrepancy.
The geographic distribution of cases and deaths in Minas Gerais is also notable. The distributions throughout the state are non‐uniform, demonstrating high incidence in large urban cores, with several municipalities showing a considerable number of cases and a reduced number of deaths. The large number of deaths seems to be concentrated not only in the capital, but also in cities closer to the state borders. The geographical distribution of cases and deaths in white and black patients follows the geographical distribution of both populations in the state, where the white population is concentrate in the southwest and richer region of the state, while the black population is more concentrated in the northeast and poorer portion of the state. Comparing the geographical distribution of cases and deaths, Figure S1 data suggest that there were more infected persons among black men than white men and more deaths among black men than among black women. It is striking that even knowing that most of the black population lives in the lowest Human Development Index (HDI) regions of the state, our calculated CRF for black patients was 3.7% points lower than for white patients.
Mathematical modelling is necessary to predict the behaviour of epidemic variables and to assist authorities in appropriate policies. Several mathematical models have been used to assess deaths and infected cases such as outbreak analytics (Polonsky et al., 2019), data‐driven (Ranjan, 2020), stochastic simulations of early outbreak trajectories (Riou & Althaus, 2020), susceptible (S), asymptomatic infected (A), symptomatic infected (I), or recovered (R) individuals (SAIR) (Monteiro, 2020) and the spatiotemporal dynamics of a spread applying machine learning (Science et al., 2020; Siettos & Russo, 2013). We applied the Gompertz function and showed how this simple technique can considerably contribute to the analyses of epidemiological data collected during COVID‐19 pandemic. Herein, we used a proved, simpler and intuitive mathematical model that successfully demonstrated our results. This model well reproduced the time evolution data, however, has been reported to have systematically overestimated the COVID‐19‐related prediction in China (Yang et al., 2020). Uncertainties are also present in the used data from public resources, mainly due to collection efficiency and update delays. Therefore, caution is required in the consideration of the absolute predicted number of deaths and cases.
COVID‐19 cases increase several folds every 24 hr. The increasing number of patients and victims makes it even difficult to maintain a real‐time track of the numbers, also due to notification delays and updates of the public databases. In countries with severe inequalities, such as Brazil, a considerable part of patients receives suboptimal attention in the public health system (Villela, 2020). Between the Influenza virus subtype (H1N1) pandemic (2009) and COVID‐19, Brazil lost about 34.500 hospital beds (Marson & Ortega, 2020) impairing access of the more vulnerable populations to health assistance.
Notwithstanding, national and regional priorities need to be identified considering the rational use of limited healthcare resources. The resume of non‐essential economic activities as well as changes in social distancing drastically alters the epidemic evolution. The social distancing index has dropped below the 40% level since June in Minas Gerais, approaching the pre‐epidemic baseline, accompanied by an increase of 163% in the number of infected cases and 172% in the number of deaths, reported by governmental agencies, just in the first half of July. Of course, it is expected that, with improved testing coverage, more cases of COVID‐19 will be detected and the clearest picture of the disease burden in Minas Gerais will become evident.
5. CONCLUSIONS
By analysing the evolution of the COVID‐19 epidemic in Minas Gerais, Brazil, we showed the importance of considering sub‐notification not only of deaths but also of infection cases. It was shown that the largely used criteria of a historical all‐deaths series did not work in this case, where most of the deaths are associated with causes that should decrease under social distancing and reduction of economic activities. Other criteria for better estimating deaths, infected cases and high mortality rate during the pandemic in Minas Gerais, discussing possible contributions and their implications, were then presented. It is shown that the excess deaths and infected cases are related to the strong increase of SARS deaths and cases reported in 2020 compared to 2019. A new methodology to estimate excess deaths and cases was developed. A quite simple and intuitive model based on the Gompertz function was also used to well fit the data and to predict the evolution of the epidemic. Based on these analyses, an excess of 21.638 deaths and 557.216 infected cases is predicted until the end of 2020, with an upper bound of the case fatality rate of around 2.4% and a prevalence of 2.6%. The importance of ethnic and geographical distribution of cases and deaths is demonstrated, and the discrepancies between cases and deaths in black and white patients are discussed. Government and private organizations need to work together to increase public awareness, stimulate social distancing and keep a surface disinfection routine to curb the viral infection, especially in critical places. Particular attention should be given to people under social vulnerability, living in underdeveloped regions.
CONFLICT OF INTEREST
The authors declare that they have no known competing financial interests or personal relationships nor competing interests that could have appeared to influence the work reported in this paper.
Supporting information
Supplementary Material
ACKNOWLEDGEMENTS
We thank all Brazilian public datasets for the use of their databank, as well as funding agencies CAPES‐PNPD scholarship programme, CNPq and FAPEMIG.
Amaral PHR, Andrade LM, da Fonseca FG, Perez JCG. Impact of COVID‐19 in Minas Gerais, Brazil: Excess deaths, sub‐notified cases, geographic and ethnic distribution. Transbound Emerg Dis.2021;68:2521–2530. 10.1111/tbed.13922
DATA AVAILABILITY STATEMENT
The data that support the findings of this study are available in the supplemental material of this article, as well as the data obtained from public sources cited in the references section.
REFERENCES
- Ariadne, Q. (2020). Covid‐19: Segunda fase dos testes em massa em BH começa na próxima semana (p. 2). Belo Horizonte. [Google Scholar]
- Cartorio (2020). Registro Civil [Online] Available at https://transparencia.registrocivil.org.br/especial‐covid [Google Scholar]
- Catala, M. , Alonso, S. , Lacalle, E. A. , Lopez, D. , Cardona, P.‐J. , & Prats, C. (2020). Empiric model for short‐time prediction of COVID‐19 spreading. medRxive. 1–23. 10.1101/2020.05.13.20101329 [DOI] [PMC free article] [PubMed] [Google Scholar]
- Cauchemez, S. , Hoze, N. , Cousien, A. , Nikolay, B. , & Q. ten bosch (2019). How modelling can enhance the analysis of imperfect epidemic data. Trends in Parasitology, 35, 369–379. 10.1016/j.pt.2019.01.009 [DOI] [PMC free article] [PubMed] [Google Scholar]
- DATASUS (2020). Deaths caused by transport accidents and assaults in Minas Gerais, OBITOS. DATASUS [Internet]. 2020. [Online] Available at http://tabnet.datasus.gov.br/cgi/deftohtm.exe?sim/cnv/obt10uf.def [Google Scholar]
- Day, M. (2020). Covid‐19: Identifying and isolating asymptomatic people helped eliminate virus in Italian village. BMJ, 368, m1165. 10.1136/bmj.m1165 [DOI] [PubMed] [Google Scholar]
- de Aguas, A. N. (2020). Monitoramento COVID Esgotos constata presença do coronavírus em primeiras coletas [Online] Available at https://www.ana.gov.br/noticias/monitoramento‐covid‐esgotos‐constata‐presenca‐do‐coronavirus‐em‐primeiras‐coletas [Google Scholar]
- Frieden, T. R. , & Lee, C. T. (2020). Identifying and interrupting superspreading events‐implications for control of severe acute respiratory syndrome coronavirus 2. Emerging Infectious Diseases, 26, 1061–1066. 10.3201/eid2606.200495 [DOI] [PMC free article] [PubMed] [Google Scholar]
- Grifoni, A. , Weiskopf, D. , Ramirez, S. I. , Mateus, J. , Dan, J. M. , Moderbacher, C. R. , Rawlings, S. A. , Sutherland, A. , Premkumar, L. , Jadi, R. S. , Marrama, D. , de Silva, A. M. , Frazier, A. , Carlin, A. F. , Greenbaum, J. A. , Peters, B. , Krammer, F. , Smith, D. M. , Crotty, S. , & Sette, A. (2020). Targets of T Cell Responses to SARS‐CoV‐2 Coronavirus in Humans with COVID‐19 Disease and Unexposed Individuals. Cell, 181, 1489–1501.e15. 10.1016/j.cell.2020.05.015 [DOI] [PMC free article] [PubMed] [Google Scholar]
- Hallari, P. , Hartwig, F. , Horta, B. , Victora, G. D. , Silveria, M. , Struchiner, C. , Vidaletti, L. P. , Neumann, N. , Pellanda, L. C. , Dellagostin, O. A. , Burattini, M. N. , Menezes, A. M. , Barros, F. C. , Barros, A. J. , & Victora, C. G. (2020). Remarkable variability in SARS‐CoV‐2 antibodies across Brazilian regions: nationwide serological household survey in 27 states. medRxive. 10.1101/2020.05.30.20117531 [DOI] [Google Scholar]
- Han, H. , Ma, Q. , Li, C. , Liu, R. , Zhao, L. , Wang, W. , Zhang, P. , Liu, X. , Gao, G. , Liu, F. , Jiang, Y. , Cheng, X. , Zhu, C. , & Xia, Y. (2020). Profiling serum cytokines in COVID‐19 patients reveals IL‐6 and IL‐10 are disease severity predictors. Emerging Microbes & Infections, 9, 1123–1130. 10.1080/22221751.2020.1770129 [DOI] [PMC free article] [PubMed] [Google Scholar]
- IBGE (2020). Instituto Brasileiro de Geografia e Estatistica, Social Inequalities due to Color or Race in Brazil [Online] Available at https://www.ibge.gov.br/en/statistics/social/population/26017‐social‐inequalities‐due‐to‐color‐or‐race‐in‐brazil.html?=&t=sobre (accessed July 7, 2020) [Google Scholar]
- Infogripe (2020). Monitoramento de casos reportados de síndrome respiratória aguda grave (SRAG) hospitalizados [Online] Available at http://info.gripe.fiocruz.br/ [Google Scholar]
- InLoco (2020). InLoco, Mapa brasileiro da COVID‐19 [Online] Available at https://mapabrasileirodacovid.inloco.com.br/pt/ (accessed July 5, 2020). [Google Scholar]
- Lone, S. A. , & Ahmad, A. (2020). COVID‐19 pandemic ‐ An African perspective. Emerging Microbes & Infections, 1–28. 10.1080/22221751.2020.1775132 [DOI] [PMC free article] [PubMed] [Google Scholar]
- Marson, F. A. L. , & Ortega, M. M. (2020). COVID‐19 in Brazil. Pulmonology, 26(4), 241–244. 10.1016/j.pulmoe.2020.04.008 [DOI] [PMC free article] [PubMed] [Google Scholar]
- Monteiro, L. H. (2020). An epidemiological model for SARS‐CoV‐2. [Google Scholar]
- Nishiura, H. , Kobayashi, T. , Miyama, T. , Suzuki, A. , mok Jung, S. , Hayashi, K. , Kinoshita, R. , Yang, Y. , Yuan, B. , Akhmetzhanov, A. R. , & Linton, N. M. (2020). Estimation of the asymptomatic ratio of novel coronavirus infections (COVID‐19). International Journal of Infectious Diseases, 94, 154–155. 10.1016/j.ijid.2020.03.020 [DOI] [PMC free article] [PubMed] [Google Scholar]
- Nogueira, P. , Falcão, J. , Contreiras, M. , Paixão, E. , Brandão, J. , & Batista, I. (2005). Mortality in Portugal associated with the heat wave of August 2003: Early estimation of effect, using a rapid method. Eurosurveillance Weekly, 10, 5–6. 10.2807/esm.10.07.00553-en [DOI] [PubMed] [Google Scholar]
- Oliveira, R. G. , De, C. G. C. , & De Oliveira, R. B. (2020). Racial Inequalities and Death on the Horizon: COVID‐19 and Structural Racism Desigualdades Raciais E a Morte Como Horizonte : Considerações Sobre a COVID‐19 E O Racismo Estrutural Desigualdades Raciales Y La Muerte Como Horizonte : Consideraciones Sobre., 36, 1–14. 10.1590/0102-311X00150120 [DOI] [PubMed] [Google Scholar]
- Polonsky, J. A. , Baidjoe, A. , Kamvar, Z. N. , Cori, A. , Durski, K. , John Edmunds, W. , Eggo, R. M. , Funk, S. , Kaiser, L. , Keating, P. , Le Polain De, O. , Waroux, M. , Marks, P. , Moraga, O. , Morgan, P. , Nouvellet, R. , Ratnayake, C. H. , Roberts, J. W. , & Jombart, T. (2019). Outbreak analytics: A developing data science for informing the response to emerging pathogens. Philosophical Transactions of the Royal Society B: Biological Sciences, 374, 10.1098/rstb.2018.0276 [DOI] [PMC free article] [PubMed] [Google Scholar]
- Prasitsirikul, W. , Pongpirul, K. , Pongpirul, W. A. , Panitantum, N. , Ratnarathon, A. C. , & Hemachudha, T. (2020). Nurse Infected with Covid‐19 from a Provisional Dengue Patient. Emerging Microbes & Infections, 1–5. 10.1080/22221751.2020.1775131 [DOI] [PMC free article] [PubMed] [Google Scholar]
- Ranjan, R. (2020). Temporal Dynamics of COVID‐19 Outbreak and Future Projections: A Data‐Driven Approach. Transactions of the Indian National Academy of Engineering, 5(2), 109–115. 10.1007/s41403-020-00112-y [DOI] [PMC free article] [PubMed] [Google Scholar]
- Riou, J. , & Althaus, C. L. (2020). Pattern of early human‐to‐human transmission of Wuhan 2019 novel coronavirus (2019‐nCoV), December 2019 to January 2020. Eurosurveillance, 25, 1–5. 10.2807/1560-7917.ES.2020.25.4.2000058 [DOI] [PMC free article] [PubMed] [Google Scholar]
- Rothe, C. , Schunk, M. , Sothmann, P. , Bretzel, G. , Froeschl, G. , Wallrauch, C. , Zimmer, T. , Thiel, V. , Janke, C. , Guggemos, W. , Seilmaier, M. , Drosten, C. , Vollmar, P. , Zwirglmaier, K. , Zange, S. , Wölfel, R. , & Hoelscher, M. (2020). Transmission of 2019‐NCOV infection from an asymptomatic contact in Germany. New England Journal of Medicine, 382, 970–971. 10.1056/NEJMc2001468 [DOI] [PMC free article] [PubMed] [Google Scholar]
- Science, N. , Phenomena, C. , Bekiros, S. , & Kouloumpou, D. (2020). SBDiEM: A new mathematical model of infectious disease dynamics. Chaos, Solitons and Fractals, 136, 10.1016/j.chaos.2020.109828 [DOI] [PMC free article] [PubMed] [Google Scholar]
- Siettos, C. I. , & Russo, L. (2013). Mathematical modeling of infectious disease dynamics. Virulence, 4, 295–306. 10.4161/viru.24041 [DOI] [PMC free article] [PubMed] [Google Scholar]
- SUS (2020). Coronavirus Brasil [Online] Available at https://covid.saude.gov.br/ [Google Scholar]
- Tjørve, K. M. C. , & Tjørve, E. (2017). The use of Gompertz models in growth analyses, and new Gompertz‐model approach: An addition to the Unified‐Richards family. PLoS One, 12, 1–17. 10.1371/journal.pone.0178691 [DOI] [PMC free article] [PubMed] [Google Scholar]
- Tong, Z. D. , Tang, A. , Li, K. F. , Li, P. , Wang, H. L. , Yi, J. P. , Zhang, Y. L. , & Yan, J. B. (2020). Potential presymptomatic transmission of SARS‐CoV‐2, Zhejiang Province, China, 2020. Emerging Infectious Diseases, 26, 1052–1054. 10.3201/eid2605.200198 [DOI] [PMC free article] [PubMed] [Google Scholar]
- Villela, D. A. M. (2020). The value of mitigating epidemic peaks of COVID‐19 for more effective public health responses. Revista Da Sociedade Brasileira De Medicina Tropical, 53, 18–19. 10.1590/0037-8682-0135-2020 [DOI] [PMC free article] [PubMed] [Google Scholar]
- Worldometer (2020). Total Coronavirus Cases in Brazil [Online] Available at https://www.worldometers.info/coronavirus/country/brazil/ [Google Scholar]
- Xavier, J. , Giovanetti, M. , Adelino, T. , Fonseca, V. , & Vitor, A. (2020). The ongoing COVID‐19 epidemic in Minas Gerais, Brazil: Insights from epidemiological data and SARS‐CoV‐2 whole genome sequencing. Emerg. Microbes Infect., 9, 1824–1834. 10.1080/22221751.2020.1803146 [DOI] [PMC free article] [PubMed] [Google Scholar]
- Yang, W. , Zang, D. , Peng, L. , Zhuge, C. , & Hong, L. (2020). Rational evaluation of various epidemic models based on the COVID‐19 data of China. medRxive. 1–18. 10.1101/2020.03.12.20034595 [DOI] [PMC free article] [PubMed] [Google Scholar]
Associated Data
This section collects any data citations, data availability statements, or supplementary materials included in this article.
Supplementary Materials
Supplementary Material
Data Availability Statement
The data that support the findings of this study are available in the supplemental material of this article, as well as the data obtained from public sources cited in the references section.