

Abstract
Background
Whilst the COVID‐19 diagnostic test has a high false‐negative rate, not everyone initially negative is re‐tested. Michigan Medicine, a primary regional centre, provided an ideal setting for studying testing patterns during the first wave of the pandemic.
Objectives
To identify the characteristics of patients who underwent repeated testing for COVID‐19 and determine if repeated testing was associated with downstream outcomes amongst positive cases.
Methods
Characteristics, test results, and health outcomes for patients presenting for a COVID‐19 diagnostic test were collected. We examined whether patient characteristics differed with repeated testing and estimated a false‐negative rate for the test. We then studied repeated testing patterns in patients with severe COVID‐19‐related outcomes.
Results
Patient age, sex, body mass index, neighbourhood poverty levels, pre‐existing type 2 diabetes, circulatory, kidney, and liver diseases, and cough, fever/chills, and pain symptoms 14 days prior to a first test were associated with repeated testing. Amongst patients with a positive result, age (OR: 1.17; 95% CI: (1.05, 1.34)) and pre‐existing kidney diseases (OR: 2.26; 95% CI: (1.41, 3.68)) remained significant. Hospitalization (OR: 7.88; 95% CI: (5.15, 12.26)) and ICU‐level care (OR: 6.93; 95% CI: (4.44, 10.92)) were associated with repeated testing. The estimated false‐negative rate was 23.8% (95% CI: (19.5%, 28.5%)).
Conclusions
Whilst most patients were tested once and received a negative result, a meaningful subset underwent multiple rounds of testing. These results shed light on testing patterns and have important implications for understanding the variation of repeated testing results within and between patients.
Keywords: COVID‐19, diagnostic testing, false‐negative rate

Introduction
On 10 March 2020, the first two positive novel coronavirus (COVID‐19) cases were identified in the state of Michigan [1]. A state of emergency was promptly declared on the same day, and a Gubernatorial stay‐at‐home order went into effect on 23 March [2]. In the ensuing months, state‐wide case counts would show a peak, followed by a steady decline [3]. However, such case reporting reflects a non‐probabilistic sample of truly infected individuals, as it depends on who underwent testing. Moreover, these COVID‐19 diagnostic tests are estimated to have poor sensitivity (70–85%) [4], and the availability of tests and the guidelines surrounding them also changed over time, with the gradual relaxation of testing criteria and a large‐scale expansion on 26 May prior to reopening the economy in the state of Michigan [5]. As such, it is important to understand who has been tested for COVID‐19 and, in particular, who has been tested multiple times. Michigan Medicine, being one of the primary regional health centres accepting COVID‐19 cases from throughout the state, provided an ideal setting for studying COVID‐19 testing patterns.
In this paper, we are particularly interested in characterizing who has been tested for active COVID‐19 infection more than once. There are five major clinical reasons that may prompt a repeated test. First, individuals have a high pre‐test probability of disease and an initial negative test result, prompting a re‐test. Second, individuals exhibited COVID‐19 symptoms, tested negative initially and then were tested again due to further developing symptoms. Third, individuals tested positive and then required repeat tests to demonstrate they are now negative (the CDC guidelines suggest two pathways for ending self‐isolation: (a) self‐isolation for 10 days after testing or (b) two negative tests separated by 24 h) [6]. Fourth, individuals tested positive and were hospitalized then require a repeat test at the end of their disease course to confirm they are now negative. Finally, frontline healthcare and essential workers are tested repeatedly. Thus, it is important to study the intervals between two tests, quantify the duration of time a patient stays positive, and whether the tests were done inpatient or outpatient to fully understand repeated testing patterns. This study helps us to compare and contrast what happened in practice with the recommended guidelines [7].
Reverse transcription polymerase chain reaction (RT‐PCR) is widely used for COVID‐19 diagnostic testing. However, the sensitivity of RT‐PCR has been shown to be 83.3% based on a study of 36 patients diagnosed with COVID‐19 at the Yichang Yiling Hospital [8]. This indicates that diagnostic tests may produce false‐negative results and should be repeated for improved accuracy. Peto also notes the importance of repeated testing and advocates for its use as UK’s COVID‐19 lockdown exit strategy [9]. Several studies have already included repeated testing in their analysis [10, 11, 12. To the best of our knowledge, this is one of the few studies that mention repeated testing in a patient cohort outside Wuhan, China, and the Hubei province, where the virus was first documented. Further, no prior studies have focused exclusively on repeated testing for COVID‐19 as an outcome with the goal of identifying factors associated with repeated testing. Specifically, the goals of this study were to (1) understand the pattern of repeated testing and the variation in test results for the same patient over time, (2) identify the characteristics of patients who underwent repeated testing for COVID‐19 and (3) determine if repeated testing was explained through COVID‐19 outcomes (say hospitalization) amongst positive cases. (4) Using these repeated testing results, we then estimated an empirical ‘real world’ false‐negative rate of the test and studied the associations of a false‐negative result with patient characteristics.
Materials and methods
Study sample
This cross‐sectional study was approved by the committee for research ethics and compliance at Michigan Medicine and followed the Strengthening the Reporting of Observational Studies in Epidemiology (STROBE) reporting guidelines. Study protocols were reviewed and approved by the University of Michigan Medical School Institutional Review Board (IRB ID HUM00180294). All COVID‐19‐susceptible patients presenting to Michigan Medicine and tested between 10 March and 4 June 2020 were included in our analysis. Patient demographic and clinical characteristics, testing rates, test results and health outcomes were collected from the electronic medical record (EMR) on 24 June 2020. Sequences of patient‐specific diagnostic test results were derived from patient laboratory records.
Statistical analyses
Frequency and pattern of testing
We described the pattern of repeated testing for COVID‐19 in our study population. We summarized the frequency of daily tests performed between 10 March and 4 June 2020, as well as the distribution of test results by increasing severity of patient outcomes. We then examined sequences of results for patients tested multiple times to characterize within‐subject variation in test results and the return time for results between two successive tests, both inpatient and outpatient.
Associations of repeated testing with patient characteristics and outcomes
We examined whether patient characteristics differed between those tested once and those tested multiple times. These characteristics included age (years), body mass index (BMI; kg m−2), sex (male, female, or other/unknown), race/ethnicity (non‐Hispanic white, non‐Hispanic black, or other/unknown), smoking status (current/former, never or unknown), indications of seven pre‐existing co‐morbidities: respiratory diseases, circulatory diseases, any cancers, type 2 diabetes, kidney diseases, liver diseases, and autoimmune diseases (1: yes or 0: no), and incidence of established COVID‐19 symptoms. Symptoms were established via a set of ICD‐10 codes, which we broadly classified into four symptom categories: cough, fever/chill, loss of smell/taste, and body pain (Table S1). Symptom categories were coded as ‘1: yes’ if any symptom in that category was reported within 14 days prior to initial presentation for a COVID‐19 diagnostic test or ‘0: no’, otherwise. Neighbourhood socio‐economic status (NSES) for each patient was also derived from the National Neighborhood Data Archive and included the proportion of the census tract population age 16+ in the civilian labour force who were unemployed, the proportion of the population with an annual income below the federal poverty level, and the proportion of adults with less than a high school diploma [13]. Differences in these characteristics were compared using chi‐squared tests for discrete and Wilcoxon rank‐sum tests for continuous variables. In a fully adjusted logistic regression model, we regressed repeated testing (1: tested more than once or 0: tested once) on the independent predictors above. As loss of smell/taste was a rare event, this indication was excluded from these models.
We then explored whether patient prognoses were associated with repeated testing. Indicators for prognoses were considered sequentially in terms of severity. We first examined the relationship between the odds of repeated testing and testing positive. For the patients with at least one positive result, we studied whether hospitalization (post‐COVID‐19 diagnosis), admission to the ICU, or mortality were associated with repeated testing. For this association analysis, we fit successive logistic regressions with various levels of confounder choices, namely (a) unadjusted; (b) adjusted for age, sex, race/ethnicity, BMI, smoking status, and neighbourhood population density; (c) adjusted for (b) and neighbourhood unemployment, poverty and education levels; (d) adjusted for (c) and a composite COVID‐19 symptom score, which was constructed by summing over the four broad symptom indicators (0: presenting with no indications of COVID‐19 symptoms to 4: presenting with symptoms in all four categories); and (e) adjusted for (d) and a composite co‐morbidity score, which was constructed by summing over the seven prevalent co‐morbidities indicators (0: no co‐morbidities to 7: all seven co‐morbidities). Odds ratios and Wald‐type 95% confidence intervals were reported for all logistic regression models. Associations were considered statistically significant at a significance level of 0.05.
We restricted our study sample to patients with a positive test result in their medical history (tested once and confirmed positive or at least one positive result in a sequence of tests). Unadjusted and adjusted comparisons were repeated for this sub‐sample. As part of our sensitivity analysis, we also considered an ordinal outcome for repeated testing (tested once, tested 2–4 times, tested 5+ times).
Estimation of a false‐negative rate in diagnostic tests for COVID‐19
We observed considerable variability in successive test results amongst patients with repeated testing. Under the assumption that all test results should remain positive between two given positive tests within the study period, the number of negative tests that should be positive can be extracted and thereby used to estimate a crude false‐negative rate in diagnostic tests for COVID‐19. This false‐negative rate was calculated as the proportion of negative tests between two positive tests amongst all patients with at least two positive tests and at least one other test between two positive tests. A large sample z‐confidence interval for this proportion was derived. As this false‐negative rate could only be defined using data from patients with at least three tests (e.g. the result sequence ‘positive → negative → positive’), we restricted our target sample to patients with at least three tests for further analysis. We examined whether patient characteristics differed between those patients with at least one false‐negative and patients with no false‐negative results. All analysis was performed using R Statistical Software, version 4.0.0 [14].
Results
Frequency and pattern of testing
Figure 1 displays the daily patterns of COVID‐19 testing (Panel A) and the proportion of patients who underwent repeated testing by patient outcome (Panel B). Between 10 March and 4 June, 15 920 COVID‐susceptible patients presented to Michigan Medicine, and 19 540 diagnostic tests were ordered. As expected, more tests were ordered on weekdays, and testing increased in April, commensurate with both increased community spread and test access. However, the proportion of positive results decreased substantially from April to June. It should be noted that testing policies changed during this time (e.g. an infectious disease consult was initially required).
Fig. 1.
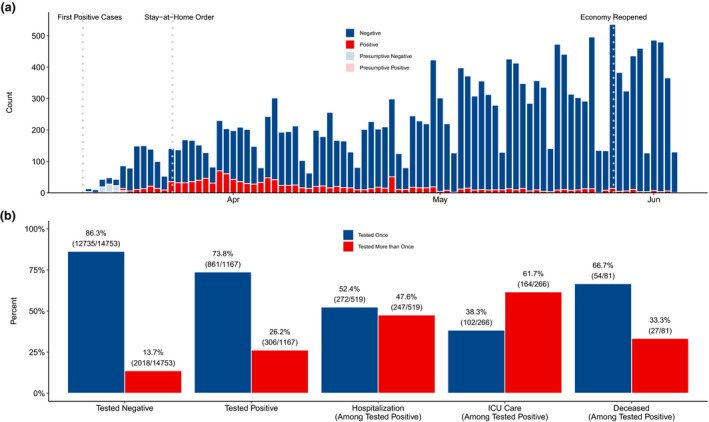
Patterns of COVID‐19 testing at Michigan Medicine. (a) Number of tests by day, stratified by test result for the 15 920 patients presenting to Michigan Medicine before 4 June 2020. Between 10 March and 4 June, 19 540 tests were administered. (b) Proportion of patients tested once versus more than once amongst for patient outcomes of increasing severity: negative test result, positive test result, hospitalization, intensive care unit admission, and death.
Most patients were tested once (13 596 patients; 85.4%) and never tested positive (14 753 patients; 92.7%). However, repeat testing occurred in a small, but meaningful, subset of patients (14.6%) with 10.2% tested twice, 2.5% tested thrice and up to five patients tested at least ten times (Fig. 2). For the 2324 patients with multiple tests, 5944 tests were ordered (mean: 2.6 tests). Amongst these patients, 13.2% had at least one positive result, but 94.3% had an ultimately negative result. A noteworthy subset had consistent negative results (314 patients with three successive negative tests, 129 with four, 35 with five, and 11 with six) and were likely essential workers, healthcare professionals or patients requiring multiple aerosol‐generating procedures. However, Fig. 2 also displays the five patients tested at least ten times, demonstrating a high degree of variability for the test. For example, two patients each had 12 tests. Denoting a positive test as + and a negative test as ‐, these patients had result sequences of ‐‐+‐‐‐+‐‐+‐‐ and ++++‐++++‐+‐, respectively. All five patients were admitted to the hospital. Testing for four patients ended with two consecutive negative tests, based on CDC guidelines. The fifth patient had not yet been discharged. Additional observations on the frequency and pattern of testing are provided in the supplemental material.
Fig. 2.
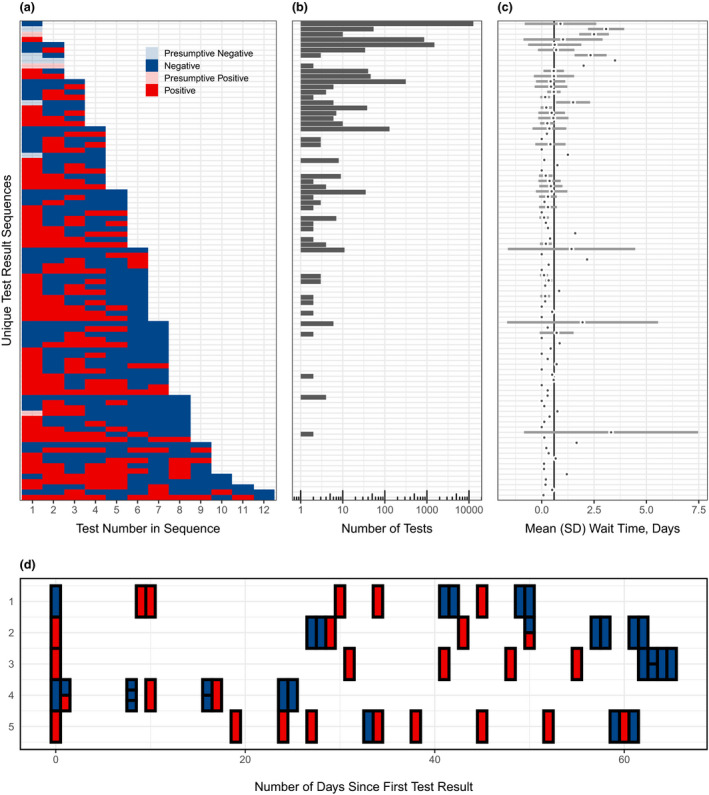
Characterization of repeated testing patterns. (a) Unique sequences of testing results for the 19,540 tests ordered between 10 March and 4 June, administered to the 15 920 patients presenting to Michigan Medicine before 4 June 2020. (b) Distribution of the number of tests administered and (c) average wait time for these tests, corresponding to each unique test result sequence in (a). The solid vertical line in (c) is the overall mean wait time in days. SD: standard deviation. (d) Test results for the five patients who underwent at least 10 tests. The horizontal axis represents the test date (first test was administered on ‘Day 0’ for each patient), and the vertical axis represents each patient ID.
Amongst patients with a positive result, the duration of positive disease status was defined as the period from the date that a patient was tested positive to the date that the patient was first tested negative and never tested positive afterwards. According to our data, 175 patients reported a trajectory of positive status to negative status. The duration of this positive disease status was left‐skewed with an average duration of 29 days, median duration of 28 days, and a range of 0–71 days (Figure S3). In a fully adjusted model, neighbourhood poverty levels were positively associated with the duration of positive disease status; education levels and population density, as well as indications of prevalent circulatory and kidney diseases, were negatively associated with the duration of positive disease status (Table S6).
Association of repeated testing with patient characteristics
Coefficients (log‐odds ratios) and Wald‐type 95% confidence intervals from our logistic regressions are presented in Fig. 3. Adjusting for all other patient characteristics, cough (OR: 1.56; 95% CI: (1.38 to 1.78)), fever/chills (OR: 1.60; 95% CI: (1.35 to 1.92)), and pain symptoms (OR: 1.22; 95% CI: (1.08 to 1.40)) within 14 days of presentation for an initial COVID‐19 diagnostic test were significantly associated with a higher odds of undergoing repeated testing. Additionally, those with prevalent circulatory diseases (OR: 1.47; 95% CI: (1.21 to 1.81)), type 2 diabetes (OR: 1.26; 95% CI: (1.11 to 1.45)), kidney diseases (OR: 1.96; 95% CI: (1.73 to 2.25)) and liver diseases (OR: 1.27; 95% CI: (1.10 to 1.49)) had higher odds of additional testing. With respect to neighbourhood socio‐economic status, higher neighbourhood poverty levels were also associated with higher odds of repeated testing (OR: 2.40; 95% CI: (1.15 to 5.04)). In contrast, females had lower odds (OR: 0.86; 95% CI: (0.78 to 0.98)) of repeated testing than males. Lastly, age (per ten years; OR: 1.07; 95% CI: (1.05 to 1.12) and BMI (OR: 0.99; 95% CI: (0.98 to 0.99)) had weak, but significant associations with repeated testing. For COVID‐19‐positive patients, repeated testing was associated with age (OR: 1.17; 95% CI: (1.05 to 1.34)) and indication of kidney diseases (OR: 2.26; 95% CI: (1.41 to 3.68)). Patient characteristics further differed across repeated testing groups (tested 2–4 times or 5+ times versus once) in a multinomial logistic regression model and when restricting to patients with a positive test (Table S4).
Fig. 3.
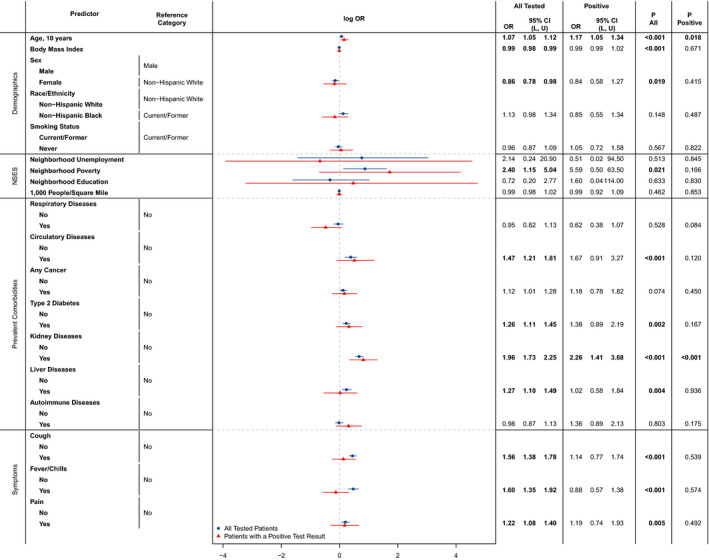
Associations between repeated testing and patient characteristics. Odds ratios and 95% confidence intervals are reported for each characteristic, fully adjusting for all other demographic and clinical characteristics in a logistic regression model. OR: odds ratio; CI: confidence interval; L: lower confidence limit; U: upper confidence limit; NSES: neighbourhood socio‐economic status. ‘All Tested’ and ‘P All’ refer to the full study cohort of n = 15 920 patients, whilst ‘Positive’ and ‘P Positive’ refer to the 1167 patients with a positive COVID‐19 test in their medical history.
Association of repeated testing with COVID‐19 outcomes
Amongst 2324 patients who underwent repeated testing, 812 out of 5944 tests (13.7%) were done during inpatient stays. Thus, most repeated tests were done outpatient. Focusing on COVID‐19‐positive patients who underwent repeated testing (N = 306), 49 out of 1118 tests (4.38%) were done before admission and 810 out of 1118 tests (72.5%) were done once admitted, substantiating that most repeated tests for COVID‐19‐positive patients were ordered during hospitalization or ICU stay. Table 1 reports the odds for repeated testing for four successive patient outcomes: positive test, hospitalization, ICU stay or death. In unadjusted models, testing positive, being hospitalized, and requiring ICU‐level care were significantly associated with repeated testing. After four sets of adjustments for both patient and neighbourhood characteristics, the odds of undergoing repeated testing remained significantly higher for patients who tested positive (OR: 1.77; 95% CI: (1.46, 2.12)), were hospitalized (OR: 7.88; 95% CI: (5.15, 12.26)), and required ICU‐level care (OR: 6.93; 95% CI: (4.44, 10.92)). Our sensitivity analysis confirmed that the odds of patients testing 2–4 times versus once were significantly higher for patients who tested positive, were hospitalized, and required ICU‐level care. These odds were higher for patients who underwent 5+ tests versus one test than the odds for 2–4 tests versus one test, as expected (Table S5).
Table 1.
Associations between repeated testing and patient outcomes. Statistics presented are odds ratios and 95% confidence intervals for the associations of each patient outcome with repeated testing from logistic regression models that are (a) unadjusted, (b) adjusted for age, sex at birth, race, ethnicity and neighbourhood population density; (c) adjusted for (b) and the proportion of adults with less than a high school education, in the labour force but unemployed, with income below the federal poverty level; (d) adjusted for (c) and the composite symptom score; and (e) adjusted for (d) and the composite co‐morbidity score. All odds ratios correspond to the odds of repeated testing versus testing once
| Adjustment model | Tested positive (Amongst All Tested) | Hospitalization (Amongst Tested Positive) | ICU care (Amongst Tested Positive) | Deceased (Amongst Tested Positive) |
|---|---|---|---|---|
| (a) | 2.24 (1.95, 2.57) | 8.88 (6.51, 12.27) | 8.48 (6.27, 11.54) | 1.39 (0.84, 2.24) |
| (b) | 1.80 (1.51, 2.14) | 7.81 (5.23, 11.86) | 6.76 (4.44, 10.38) | 0.84 (0.40, 1.69) |
| (c) | 1.82 (1.52, 2.16) | 8.07 (5.38, 12.32) | 7.05 (4.59, 10.93) | 0.84 (0.40, 1.68) |
| (d) | 1.61 (1.35, 1.93) | 8.36 (5.52, 12.90) | 6.92 (4.51, 10.73) | 0.82 (0.39, 1.65) |
| (e) | 1.77 (1.46, 2.12) | 7.88 (5.15, 12.26) | 6.93 (4.44, 10.92) | 0.74 (0.34, 1.52) |
(a) Unadjusted Odds Ratios (95% CI) for repeated testing on each patient outcome.
(b) Odds Ratios (95% CI), adjusted for age, sex at birth, race, ethnicity and neighbourhood population density.
(c) Odds Ratios (95% CI), adjusted for (b) and the proportion of adults: with less than a high school education, in the labour force but unemployed, with income below the federal poverty level.
(d) Odds Ratios (95% CI), adjusted for (c) and the composite symptoms score.
(e) Odds Ratios (95% CI), adjusted for (c) and the composite co‐morbidity score.
Estimation of false‐negative rate in diagnostic tests for COVID‐19
As previously reported, a meaningful subset of patients (N = 2324) underwent multiple rounds of testing. Amongst these patients, most (N = 2073; 89.2%) received a consistent diagnosis (all negative or positive results). However, with repeated testing 177 (7.6%) patients experienced a conversion from a positive to negative or negative to positive result, and 74 (3.2%) patients experienced multiple conversions, demonstrating the potential for high variability in the diagnostic testing results. Using these patient‐specific sequences of test results, we estimated a false‐negative rate for the diagnostic test. Specifically, there were 693 patients who underwent three or more tests (total tests = 2682) and 85 patients with at least two positive tests and at least one test between them (total tests = 370). Due to low false‐positive rate of the RT‐PCR test (0.8–4%) [15], we assumed that all test results should remain positive between two positive tests. Under this assumption, there were 88 negative tests performed on 53 patients that are assumed to be false negatives, thus yielding an estimated false‐negative rate of 23.8% (88/370; 95% CI: (19.5% to 28.5%)). Comparing those 53 patients with at least one false‐negative result to the 640 patients without a false negative, BMI (OR: 1.07; 95% CI: (1.02, 1.13); P: 0.007), race/ethnicity (non‐Hispanic Black versus non‐Hispanic White; OR: 3.12; 95% CI: (1.10, 8.83); P: 0.031), and smoking status (never versus current/former smoking; OR: 3.14; 95% CI: (1.24, 8.58); P: 0.019) were significantly associated with higher odds of a false‐negative result (Table 2).
Table 2.
Associations between false negatives and patient characteristics. Odds ratios and 95% confidence intervals are reported for each characteristic, comparing the odds of a false‐negative result to no false‐negative results, fully adjusting for all other demographic and clinical characteristics in a logistic regression model
| Characteristic | OR | 95% CI | P‐value |
|---|---|---|---|
| Age, 10 years | 1.09 | 0.82, 1.46 | 0.6 |
| Body Mass Index | 1.07 | 1.02, 1.13 | 0.007 |
| Sex | |||
| Male | — | — | — |
| Female | 0.58 | 0.23, 1.39 | 0.2 |
| Race/Ethnicity | |||
| Non‐Hispanic White | — | — | — |
| Non‐Hispanic Black | 3.12 | 1.10, 8.83 | 0.031 |
| Smoking Status | |||
| Current/Former | — | — | |
| Never | 3.14 | 1.24, 8.58 | 0.019 |
| Neighbourhood Unemployment a | 1.1 | 0.96, 1.27 | 0.2 |
| Neighbourhood Poverty a | 0.99 | 0.94, 1.04 | 0.7 |
| Neighbourhood Education a | 0.95 | 0.86, 1.04 | 0.3 |
| Population Density, 1000 persons per square mile | 1.13 | 0.92, 1.39 | 0.2 |
| Respiratory diseases | |||
| No | — | — | — |
| Yes | 1.86 | 0.55, 7.66 | 0.3 |
| Circulatory diseases | |||
| No | — | — | — |
| Yes | 0.58 | 0.13, 3.00 | 0.5 |
| Any cancer | |||
| No | — | — | — |
| Yes | 0.85 | 0.32, 2.20 | 0.7 |
| Type 2 diabetes | |||
| No | — | — | — |
| Yes | 2.16 | 0.82, 5.90 | 0.12 |
| Kidney diseases | |||
| No | — | — | — |
| Yes | 0.45 | 0.17, 1.16 | 0.1 |
| Liver diseases | |||
| No | — | — | — |
| Yes | 0.52 | 0.11, 1.72 | 0.3 |
| Autoimmune diseases | |||
| No | — | — | — |
| Yes | 0.89 | 0.31, 2.40 | 0.8 |
| Cough | |||
| No | — | — | — |
| Yes | 1.2 | 0.48, 2.99 | 0.7 |
| Fever/Chills | |||
| No | — | — | — |
| Yes | 1.4 | 0.49, 3.74 | 0.5 |
| Pain | |||
| No | — | — | — |
| Yes | 0.39 | 0.10, 1.15 | 0.12 |
OR, Odds Ratio; CI, Confidence Interval.
Bold P‐values denote associations that were considered statistically significant at a significance level of 0.05.
The unit of neighbourhood unemployment is 1% proportion of population age 16+ in the civilian labour force who are unemployed; the unit of neighbourhood poverty is 1% proportion of population with annual income below the federal poverty level; and the unit of neighbourhood education is 1% proportion of adults with less than high school diploma in 2010.
Discussion
Understanding testing patterns for COVID‐19 is necessary to go beyond what is ascertainable from case counts alone. We have shown that, whilst most patients at Michigan Medicine were tested once and confirmed negative, a meaningful subset (14.6%) underwent repeated testing. Amongst these patients, 7.6% experienced a conversion from a positive to negative or negative to positive result and 3.2% experienced multiple conversions, demonstrating considerable variability for within‐patient test results over time. This is consistent with the known high false‐negative rate for current diagnostic tests. Ai et al. (2020), Li et al. (2020) and Long et al. (2020) all note this variability in diagnosis by reverse transcription polymerase chain reaction (RT‐PCR), as is the focus of our work [8, 10. These studies all draw comparisons with diagnosis by computed tomography (CT) in patients from the city of Wuhan, China, and the surrounding Hubei province. All three studies found higher false‐negative rates by RT‐PCR and similarly noted dynamic conversions of RT‐PCR results (negative to positive, positive to negative) for patients with multiple RT‐PCR assays. Specifically, Ai et al. (2020) found that 308 of 413 (75%) patients with negative RT‐PCR results had positive chest CT findings. Li et al. noted that amongst 384 patients with initial negative RT‐PCR results, 75 patients (19.5%) tested positive upon a second test and 12 patients (3.1%) were later confirmed positive after three or more tests. Similarly, Long et al. (2020) found that six out of 36 patients (16.7%) presenting with symptoms were initially tested negative, but later tested positive after second (three patients) and third (three patients) tests. Long et al. further noted that 35 of these 36 patients had abnormal CT findings. These studies all recommend repeating RT‐PCR to avoid misdiagnosis and the use of clinical indicators such as chest CT scans to supplement diagnostic and prognostic testing of COVID‐19‐susceptible patients, particularly when typical CT findings but negative RT‐PCR assays lead to conflicting results.
As supported by our findings, RT‐PCR is shown to produce false‐negative results. We estimated the false‐negative rate to be 23.8% (95% CI: (19.5% to 28.5%)). Kucirka et al. found that the median false‐negative rate on the day of symptom onset was 38% (95% CI: (18% to 65%)), which decreased to 21% (95% CI: (13% to 31%)) after three days [16]. These results are consistent with our current estimates. If repeated tests are assumed to be independent with a 23.8% false‐negative rate, then the probability of two false negatives is as low as 5.66%. We note, however, that based on our findings, patient characteristics such as BMI, race/ethnicity, and smoking status are associated with higher odds of receiving a false‐negative result. Thus, further considerations may surround a negative result in the presence of these risk factors and other clinical evidence. Whilst our independence assumption may be violated, as some patients may have a higher chance of receiving a false‐negative result, repeated diagnostic testing can mitigate problems with high false‐negative rates in current diagnostic testing, thus helping to reduce the spread of COVID‐19.
Experiencing COVID‐19 symptoms within 14 days of presentation for an initial COVID‐19 diagnostic test was significantly associated with higher odds of undergoing repeated testing. Specifically, patients with a cough had 1.56 times higher odds of a repeat test, and similarly for those with fever/chills (1.60 times higher odds) or pain (1.22 times higher odds). We further demonstrated that testing rates differed significantly with respect to patient age, BMI, sex, neighbourhood poverty levels and indications of circulatory diseases, type 2 diabetes, kidney and liver diseases. Amongst COVID‐19‐positive patients, differences in testing rates persisted with respect to age and prevalence of kidney diseases. Recent work by Gu et al. [17] details these risk factors and outcomes of COVID‐19 associated with race and other patient demographics. Considering patient prognosis being associated with repeated testing, or even leading to repeated testing, we found that the odds of repeated testing were significantly higher for patients that were hospitalized or required ICU‐level care, adjusting for patient characteristics and neighbourhood socio‐economic status. It is most likely that patients who were admitted to the hospital or who had an ICU requirement were tested before release if they were returning to homes/assisted living where they could not practice self‐isolation. The weak association of mortality with repeated testing may indicate that patients with extremely severe symptoms were less likely to undergo repeated testing. Inpatient stays lasted more than three weeks, on average, amongst those patients tested repeatedly. Therefore, unlike a normal flu, the expected recovery time from COVID‐19 was much longer in order to achieve a stable negative test result [18, 19, 20.
These results shed light on repeated testing for COVID‐19 and its associated factors at Michigan Medicine, a primary regional centre accepting COVID‐19 cases from throughout the state and, in particular, the city of Detroit (a ‘hot‐spot’ during the pandemic). They further inform how testing guidelines may have been actualized in an academic medical centre. Countries like South Korea, for example, have shown that random testing and contact tracing are crucial in understanding the true prevalence of this disease and managing its spread [21]. The United States was initially not prepared to roll out such aggressive testing strategies at the onset of the outbreak [22]. Initial testing guidelines called for the rationing of resources, whereby only the most critically ill patients or those at highest risk of presenting with severe symptoms were tested. At Michigan Medicine, more and more asymptomatic or mildly symptomatic individuals were tested in May and June as more tests became available. As of 23 July, 51 680 022 COVID‐19 tests have been reported in the United States (15.74 tests per 100 people) and 1 634 670 COVID‐19 tests have been reported in Michigan (16.37 tests per 100 people) [23, 24. As more individuals received a diagnostic test and the strict lockdowns extended by Michigan’s governor led to effective control of the virus, both daily new case rates and positive test rates continued to decrease in Michigan prior to experiencing the Fall surge. Thus, the study period from March–June gives us an optimal time window to characterize these results.
Limitations and future work
A potential limitation of our study is its generalizability to other regional testing centres, both in established ‘hot spots’ and rural areas, due to the patient mix at Michigan Medicine. There are inherent limitations to using electronic health records for research purposes due to the incomplete information. For example, tests done at drive‐thru testing stations or pharmacies are not captured. Additionally, more granular socio‐economic information such as individual‐level income, occupation or access to care was not available. The definition of symptoms, co‐morbidities and patient characteristics using ICD code can also be highly imperfect. Despite these limitations, the manuscript presents a holistic description of what happened with testing at an academic medical centre near a severely affected city (Detroit) during the first wave of the pandemic.
Conclusion
We sought to quantify patterns of repeated testing for COVID‐19 and its associated factors at Michigan Medicine. We further provide a real‐world estimate of the false‐negative rate for current diagnostic tests. These results shed light on testing patterns and have important implications in understanding what is happening in practice with COVID‐19 testing at an academic medical centre. As the pandemic continues, further analysis with updated data is necessary to verify the findings at hand and inform future testing guidelines.
Conflict of interests
All authors have declared no competing interest. All authors have completed the ICMJE uniform disclosure form at http://www.icmje.org/coi_disclosure.pdf and declare: no support from any organization for the submitted work; no financial relationships with any organizations that might have an interest in the submitted work in the previous three years; and no other relationships or activities that could appear to have influenced the submitted work.
Funding
This study was supported by the University of Michigan Precision Health Initiative, University of Michigan Rogel Cancer Center, Michigan Institute of Data Science, NSF DMS 1712933 and NIH NCI P30 CA 046592‐30‐S3.
Ethical approval
Study protocols were reviewed and approved by the University of Michigan Medical School Institutional Review Board (IRB ID HUM00180294).
Author contribution
Stephen Salerno: Conceptualization (equal); Data curation (equal); Formal analysis (lead); Investigation (equal); Methodology (equal); Validation (equal); Visualization (equal); Writing‐original draft (lead); Writing‐review & editing (lead). Bhramar Mukherjee: Conceptualization (equal); Data curation (equal); Formal analysis (lead); Investigation (equal); Methodology (equal); Validation (equal); Visualization (equal); Writing‐original draft (lead); Writing‐review & editing (lead).
Data Sharing
Data cannot be shared publicly due to patient confidentiality. The data underlying the results presented in the study are available from University of Michigan Data Office for Clinical & Translational Research for researchers who meet the criteria for access to confidential data.
Dissemination to participants and related patient and public communities
The authors have submitted the manuscript as a preprint on MedRxiv (doi.org/10.1101/2020.07.26.20162453) whilst being considered by the journal. Lay summaries of the article will be posted on Twitter and will be discussed with journalists as the opportunity arises.
The Corresponding Author has the right to grant on behalf of all authors and does grant on behalf of all authors, a worldwide license to the Publishers and its licensees in perpetuity, in all forms, formats and media (whether known now or created in the future), to (i) publish, reproduce, distribute, display and store the Contribution; (ii) translate the Contribution into other languages, create adaptations, reprints, include within collections and create summaries, extracts and/or, abstracts of the Contribution; (iii) create any other derivative work(s) based on the Contribution; (iv) exploit all subsidiary rights in the Contribution, (v) the inclusion of electronic links from the Contribution to third party material wherever it may be located; and (vi) license any third party to do any or all of the above.
Supporting information
Figure S1. Composition of 1230 tests conducted in 519 patients with ever inpatient stay. Among them, 1053 tests were done during their inpatient stay.
Figure S2. Distribution of time lag between successive tests among patients tested repeatedly.
Figure S3. Distribution of duration of positive disease status (n = 175).
Table S1. COVID‐19 symptoms, symptom categories, and relevant ICD‐10 codes.
Table S2. Sequences of testing results for the 19 540 tests ordered between March 10 and June 4, administered to the n = 15 920 patients presenting to Michigan Medicine, stratified by whether the tests were conducted during an inpatient stay.
Table S3. Characteristics of the 15 920 patients in our study sample and 1167 patients with a positive COVID‐19 test in their medical history, stratified by the number of tests underwent by the patient.
Table S4. Characteristics of the n = 15 920 patients in our study sample and n = 1167 patients with a positive COVID‐19 test in their medical history, stratified by the number of tests underwent by the patient.
Table S5. Associations between repeated testing and patient outcomes.
Table S6. Associations between duration of positive disease status and patient characteristics.
Salerno S, Zhao Z, Prabhu Sankar S, Salvatore M, Gu T, Fritsche LG, Lee S, Lisabeth LD, Valley TS, Mukherjee B (University of Michigan School of Public Health; University of Michigan Medicine; University of Michigan, Ann Arbor, MI, USA; Seoul National University, Seoul, South Korea). Patterns of repeated diagnostic testing for COVID‐19 in relation to patient characteristics and outcomes. J Intern Med 2021;289:726–737.
References
- 1. Office of the Governor of Michigan . Executive Order 2020–04 (COVID‐19) ‐ Declaration of State of Emergency. Published online March 10, 2020. https://www.michigan.gov/whitmer/0,9309,7‐387‐90499_90705‐521576–,00.html. [Google Scholar]
- 2. Office of the Governor of Michigan . Executive Order 2020–21 (COVID‐19). Published online March 23, 2020. https://www.michigan.gov/whitmer/0,9309,7‐387‐90499_90705‐522626–,00.html. [Google Scholar]
- 3. Dong E, Du H, Gardner L. An interactive web‐based dashboard to track COVID‐19 in real time. Lancet Infect Dis 2020; 20: 533–4. [DOI] [PMC free article] [PubMed] [Google Scholar]
- 4. Lisboa Bastos M, Tavaziva G, Abidi SK et al. Diagnostic accuracy of serological tests for COVID‐19: systematic review and meta‐analysis. BMJ. Published online July 1, 2020; 370 :m2516. [DOI] [PMC free article] [PubMed] [Google Scholar]
- 5. State of Michigan . Governor Whitmer Reopens Auto Dealerships and Retail Businesses by Appointment, Authorizes Nonessential Medical, Dental and Veterinary Procedures. Published online May 21, 2020. https://www.michigan.gov/coronavirus/0,9753,7‐406‐98158‐529861–,00.html. [Google Scholar]
- 6. Centers for Disease Control and Prevention . Discontinuation of Isolation for Persons with COVID‐19 Not in Healthcare Settings. Coronavirus Disease 2019 (COVID‐19). Published July 20, 2020. https://www.cdc.gov/coronavirus/2019‐ncov/hcp/disposition‐in‐home‐patients.html. [Google Scholar]
- 7. Michigan Medicine . Indications for COVID‐19 Diagnostic Testing for Adult Patients in all Clinical Settings. Published online April 20, 2020. http://www.med.umich.edu/asp/pdf/adult_guidelines/COVID‐19‐testing.pdf. [Google Scholar]
- 8. Long C, Xu H, Shen Q et al. Diagnosis of the Coronavirus disease (COVID‐19): rRT‐PCR or CT? Eur J Radiol 2020; 126: 108961. [DOI] [PMC free article] [PubMed] [Google Scholar]
- 9. Peto J, Alwan NA, Godfrey KM et al. Universal weekly testing as the UK COVID‐19 lockdown exit strategy. Lancet 2020; 395: 1420–1. [DOI] [PMC free article] [PubMed] [Google Scholar]
- 10. Ai T, Yang Z, Hou H et al. Correlation of chest CT and RT‐PCR testing for coronavirus disease 2019 (COVID‐19) in China: A report of 1014 cases. Radiology 2020; 296: E32–E40. [DOI] [PMC free article] [PubMed] [Google Scholar]
- 11. Li Y, Yao L, Li J et al. Stability issues of RT‐PCR testing of SARS‐CoV‐2 for hospitalized patients clinically diagnosed with COVID‐19. J Med Virol 2020; 92: 903–8. [DOI] [PMC free article] [PubMed] [Google Scholar]
- 12. Liu Y, Yan L‐M, Wan L et al. Viral dynamics in mild and severe cases of COVID‐19. Lancet Infect Dis 2020; 20: 656–7. [DOI] [PMC free article] [PubMed] [Google Scholar]
- 13. Clarke P, Melendez R. National Neighborhood Data Archive (NaNDA): Neighborhood Socioeconomic and Demographic Characteristics of Census Tracts, United States, 2000‐2010. Published online 2020. 10.3886/E111107V1. [DOI] [Google Scholar]
- 14. R Core Team . R: A Language and Environment for Statistical Computing. Vienna, Austria: R Foundation for Statistical Computing, 2020. https://www.R‐project.org/. [Google Scholar]
- 15. Cohen AN, Kessel B. False positives in reverse transcription PCR testing for SARS‐CoV‐2. medRxiv 2020. 10.1101/2020.04.26.20080911. [DOI] [Google Scholar]
- 16. Kucirka LM, Lauer SA, Laeyendecker O, Boon D, Lessler J. Variation in false‐negative rate of reverse transcriptase polymerase chain reaction‐based SARS‐CoV‐2 tests by time since exposure. Ann Intern Med Published online May 13, 2020; 173: 262–267. [DOI] [PMC free article] [PubMed] [Google Scholar]
- 17. Gu T, Mack JA, Salvatore M. Nallamothu et al. "COVID‐19 outcomes, risk factors and associations by race: a comprehensive analysis using electronic health records data in Michigan Medicine." medRxiv 2020. Available at: https://www.medrxiv.org/content/10.1101/2020.06.16.20133140v1. [Google Scholar]
- 18. Faust JS, del Rio C. Assessment of deaths from COVID‐19 and from seasonal influenza. JAMA Intern Med 2020; 180: 1045–6. 10.1001/jamainternmed.2020.2306 [DOI] [PubMed] [Google Scholar]
- 19. Zhou F, Yu T, Du R et al. Clinical course and risk factors for mortality of adult inpatients with COVID‐19 in Wuhan, China: a retrospective cohort study. Lancet 2020; 395: 1054–62. [DOI] [PMC free article] [PubMed] [Google Scholar]
- 20. Centers for Disease Control and Prevention . Similarities and Differences between Flu and COVID‐19. Influenza (Flu). https://www.cdc.gov/flu/symptoms/flu‐vs‐covid19.htm. [Google Scholar]
- 21. World Health Organization . Coronavirus disease (COVID‐2019) situation reports. World Health Organization. https://www.who.int/emergencies/diseases/novel‐coronavirus‐2019/situation‐reports. [Google Scholar]
- 22. Cho H, Ippolito D, Yu YW. Contact Tracing Mobile Apps for COVID‐19: Privacy Considerations and Related Trade‐offs. ArXiv200311511 Cs. Published online March 30, 2020. Accessed July 23, 2020. http://arxiv.org/abs/2003.11511. [Google Scholar]
- 23. Centers for Disease Control and Prevention . CDC COVID Data Tracker. Accessed July 23, 2020. https://www.cdc.gov/covid‐data‐tracker/index.html#testing. [Google Scholar]
- 24. United States Census Bureau . Census Quick Facts. (July 1, 2019 est.). Accessed July 23, 2020. https://www.census.gov. [Google Scholar]
Associated Data
This section collects any data citations, data availability statements, or supplementary materials included in this article.
Supplementary Materials
Figure S1. Composition of 1230 tests conducted in 519 patients with ever inpatient stay. Among them, 1053 tests were done during their inpatient stay.
Figure S2. Distribution of time lag between successive tests among patients tested repeatedly.
Figure S3. Distribution of duration of positive disease status (n = 175).
Table S1. COVID‐19 symptoms, symptom categories, and relevant ICD‐10 codes.
Table S2. Sequences of testing results for the 19 540 tests ordered between March 10 and June 4, administered to the n = 15 920 patients presenting to Michigan Medicine, stratified by whether the tests were conducted during an inpatient stay.
Table S3. Characteristics of the 15 920 patients in our study sample and 1167 patients with a positive COVID‐19 test in their medical history, stratified by the number of tests underwent by the patient.
Table S4. Characteristics of the n = 15 920 patients in our study sample and n = 1167 patients with a positive COVID‐19 test in their medical history, stratified by the number of tests underwent by the patient.
Table S5. Associations between repeated testing and patient outcomes.
Table S6. Associations between duration of positive disease status and patient characteristics.