

Abstract
We explore the effects of the COVID‐19 crisis and the associated restrictions to economic activity on paid and unpaid work for men and women in the United Kingdom. Using data from the COVID‐19 supplement of Understanding Society, we find evidence that labour market outcomes of men and women were roughly equally affected at the extensive margin, as measured by the incidence of job loss or furloughing. But, if anything, women suffered smaller losses at the intensive margin, experiencing slightly smaller changes in hours and earnings. Within the household, women provided on average a larger share of increased childcare needs, but in an important share of households fathers became the primary childcare providers. These distributional consequences of the pandemic may be important to understand its inequality legacy over the longer term.
Keywords: COVID‐19, gender gaps, childcare, time use
I. Introduction
COVID‐19 is hitting most economies as hard as the deepest recessions, but given the exceptional nature of this crisis, the distribution of jobs and workers affected is quite different from previous downturns. While sectors such as construction and manufacturing are typically most affected in regular recessions, including the Great Recession, the social distancing and lockdown measures implemented in response to the COVID‐19 crisis have naturally hit service sectors with frequent interactions among consumers or between consumers and providers, such as retail, hotels, restaurants and travel. But even among workers whose activities are or were not directly subject to lockdowns, many are or have been unable to work as normal, as their work would not comply with social distancing (e.g. in construction, repairs and home services), and can be hardly performed from home.
Another distinctive feature of the pandemic has been its impact on the volume of home production, reversing by decree a secular process of marketisation of childcare and home keeping. During lockdowns, virtually none of the typical components of home production could be outsourced to the market, and the closure of schools and nurseries meant that all education and childcare services were added to pre‐existing home production needs.
The impact of the pandemic on the labour market as well as the volume of home production is likely to have consequences for the gender distribution of work. On the one hand, women tend to be over‐represented in service industries that have been subject to lockdowns or social distancing measures. On the other hand, they are also over‐represented in sectors that have been defined as critical to the COVID‐19 response, as well as in occupations that can be performed from home. It is therefore ex‐ante unclear whether one should expect women's labour market prospects to be more severely affected than men's. Another key aspect is that women on average perform the best part of home production tasks, most notably childcare, and more in general they bear almost the entirety of the earning penalty associated with childbearing.1 Thus, increased care responsibilities while COVID‐19 restrictions last could negatively affect gender inequality in earnings in the longer run.
This paper contributes to a recent but growing economic literature investigating unequal socio‐economic effects of COVID‐19 across a number of dimensions.2 A strand of this literature has devoted special attention to unequal gender impacts. For the United States, Alon et al. (2020) document larger employment losses for women than for men and explore their consequences for macroeconomic adjustment and the household division of labour. For the United Kingdom, Andrew et al. (2020) find that, in households with dependent children, mothers are more likely than fathers to be out of work or furloughed during the crisis and that the substantial increase in childcare for both parents has on average enlarged fathers' share of total childcare. Sevilla and Smith (2020) detect a larger increase in the overall childcare burden for mothers, but, as for Andrew et al. (2020), this is associated with a slight increase in father's share of total childcare, simply because fathers' contribution to childcare was on average much lower before the crisis. Finally, Oreffice and Quintana‐Domeque (2020) find that poorer female employment outcomes during the crisis are also accompanied by a higher incidence of mental health issues. For other countries, Farré et al. (2020) and Del Boca et al. (2020) look into the effects on both paid and domestic work in Spain and Italy, respectively. In both countries, women take over most of the increased childcare burden, but evidence on their labour market outcomes is less clear‐cut.
The majority of papers in this literature draw on evidence from ad hoc, real‐time surveys carried out during the pandemic. These typically contain rich information on COVID‐19 related aspects of work and family life, but they may not be linked to pre‐pandemic outcomes. Only more recently have regular household and labour market surveys started to release waves of data that cover the pandemic period, with larger sample sizes and richer information on work and employment patterns at baseline.
Our work contributes to the literature on the effects of COVID‐19 on the gender division of work in the labour market and the household, using data from the COVID‐19 supplement to the Understanding Society (USoc) longitudinal study. In contrast to results from independent surveys, we find evidence of roughly equal furloughing (and job loss) incidence across genders, but women on average experience slightly smaller hours and earnings losses, whether unconditional or controlling for a rich set of individual and job characteristics. Within the household, women on average take over the majority of increased childcare hours during the pandemic, but in a sizeable share of households fathers become the primary providers of childcare. These distributional consequences of the pandemic are important to understand its inequality legacy over the longer term.
II. Work patterns at baseline
We start by showing a snapshot of male and female work patterns at baseline under the lens of the COVID‐19 incidence. This is done using data from the UK Quarterly Labour Force Survey (LFS) for April–June 2019, whose large sample size and detailed occupation and industry classifications allow us to precisely identify jobs subject to lockdown and those that have been defined as critical to the COVID‐19 response.3
We classify jobs into four categories. The first group includes jobs in critical industries (mostly health care, public services and security). The second group includes jobs in shut‐down industries (mostly non‐essential retail, hospitality, accommodation and food services).4 We categorise all remaining jobs into those that can be done from home and those that cannot, which is plausibly the relevant distinction to predict employment and earning losses outside critical and shut‐down sectors. This classification is done by matching the classification of teleworkable occupations by Dingel and Neiman (2020) – based on task descriptions in O*NET – with the UK classification of occupations in the LFS.5
The distribution of employment across these four categories is shown in Figure 1. More women than men are employed in critical sectors (about 46 and 39 per cent of working women and men, respectively). Offsetting this, more women than men are employed in shut‐down sectors (about 19 and 13 per cent, respectively). For the remaining 48 per cent of men and 35 per cent of women, the incidence of earnings losses is closely linked to their ability to work from home (WFH). WFH is largely possible in female‐dominated sectors such as education, where teachers support distance learning for many children and young people. In contrast, WFH is not possible in many male‐dominated sectors such as construction, repairs, and large parts of manufacturing. Indeed, about 24 per cent of women and 19 per cent of men are in jobs that can be done from home – having excluded critical and shut‐down sectors. Taking these factors into account, it is ex‐ante unclear whether women's employment and earning prospects should be more or less severely affected than men's.
FIGURE 1.
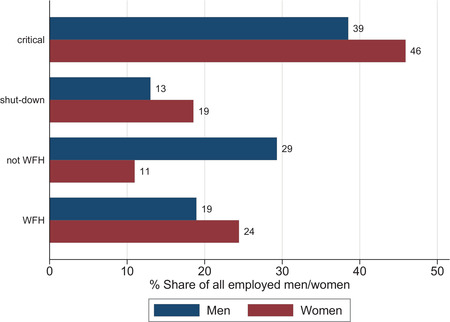
The composition of jobs according to COVID‐19 incidence
Note: The bars show the incidence of critical jobs and shut‐down jobs, as well as the incidence of working from home among those not in critical or shut‐down jobs. For completeness, the percentage of critical jobs that can be done from home is 44 per cent for men and 41 per cent for women, and the percentage of shut‐down jobs that can be done from home is 22 per cent for men and 24 per cent for women. The sample consists of employed men and women aged 16–64.
Source: UK LFS, April–June 2019.
The other relevant aspect of the pandemic regards the gender distribution of home production, including (most notably) childcare. One important factor behind changes in childcare needs is marital or cohabitation status. Women are more likely than men to raise children as single parents. Using LFS data, we estimate that 20.3 per cent of households with dependent children (aged 15 and younger) are headed by single mothers, against 3.3 per cent headed by single fathers. Hence, for single‐parent households, women are far more likely than men to be the sole providers of the sharp increase in childcare during the lockdown. Second, the distribution of home production depends on the working status of partners (if any), which is itself affected by the crisis. Figure 2 shows the distribution of partner status for women with dependent children. Around one‐third of all women with dependent children work in critical jobs (as opposed to 46 per cent of all working women). Of these, 57 per cent have either no partner or a partner who also works in a critical job, and are likely to rely on basic childcare services guaranteed by the education system to parents in critical jobs. The remaining 43 per cent has a partner who is staying at home – whether he is employed in a shut‐down sector (6 per cent), or cannot go to work due to social distancing (33 per cent), or does not work at all (4 per cent). In these households, we would expect a reversal of the home production gap, with men taking over the bulk of increased childcare and housekeeping needs. Among mothers who are not in critical jobs, and therefore stay at home during the lockdown, 21 per cent have no partner and 26 per cent have a partner in a critical job, and hence are likely fully in charge of home production. The other 53 per cent has a stay‐at‐home partner, and home production is somehow shared between spouses.
FIGURE 2.
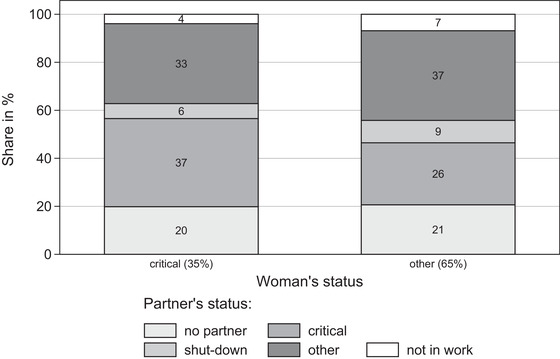
The distribution of partner's status, by women's status
Note: The ‘other’ status indicates women staying at home during the COVID‐19 pandemic (including: in shut‐down jobs, in non‐critical jobs, not employed). The sample does not include households with two or more family units or same‐sex couples with children (representing, respectively, 2.33 per cent and 0.23 per cent of households with children). The sample consists of women with dependent children aged 15 and younger.
Source: UK LFS, April–June 2019.
There is plenty of pre‐pandemic evidence on the contribution of men and women to home production from time use data. According to the 2014–15 UK Time Use Survey, women do 27 hours per week of home production on average, while men do 16 hours on average. Among households with dependent children, weekly home production hours are 40 for mothers and 20 for fathers, of which 17 and 8, respectively, represent childcare. The key question is therefore whether the additional home production falls on men and women according to baseline specialisation patterns, in which case women would be at the receiving end of the best part of increased home production requirements.
Below we address questions on the effects of COVID‐19 on the gender division of both paid and unpaid work using the COVID‐19 supplement of the USoc study. Relative to the UK LFS, the COVID‐19 study has the advantage of surveying participants at the monthly frequency, linking their answers to regular USoc waves, and providing detailed information on domestic work, including childcare and home schooling. The disadvantage of the COVID‐19 study, however, is that it does not contain fine‐grained information on occupation or industry at baseline, so we cannot identify jobs that are subject to shut‐downs or jobs that have been defined as critical. The next section will give details on this data set.
III. Data
With the introduction of the COVID‐19 study in April 2020,6 participants from the main USoc sample have been asked to complete a short web‐based survey each month, eliciting information on the impact of the pandemic on their work and family lives. These data have some clear strengths. First, they record retrospective information on outcomes of interest at baseline (i.e. before the onset of the pandemic, as of January–February 20207) as well as contemporaneous information from April onwards. Second, individual records can be linked to past and future waves of the annual USoc survey, facilitating long‐run analyses of COVID‐19 impacts. Third, selective non‐response can be tracked down to a rich set of individual characteristics (available from the earlier USoc annual waves) and accounted for using the weights provided.
We use information from the first two COVID‐19 monthly surveys, which were carried out between 24 and 30 April and between 27 May and 2 June, respectively, among all USoc participants who had responded in at least one of the two previous annual surveys (wave nine and ten, carried out in 2017–18 and 2018–19, respectively). The response rates are 46 per cent and 48.5 per cent in the April and May waves, respectively (slightly rising to 48.6 per cent and 49.1 per cent if one includes partial responses), among those who responded in wave nine. Compared with the 86 per cent response rate in wave nine, relative to wave eight participants, retention in the COVID‐19 study is considerably lower.8
To get a sense of selective attrition in the data, Table 1 compares descriptive statistics among USoc wave nine and COVID‐19 waves one and two respondents (data from wave ten will only be released in November 2020). COVID‐19 respondents are on average slightly older, more likely to be female, college educated, British, married, employed at wave nine and higher earners. To facilitate population inferences, the COVID‐19 study provides weights to account for differential selection probabilities and non‐response. These are based on information from wave nine, allowing us to estimate differential response conditional on a very rich set of individual and household characteristics. All descriptive evidence and regression results based on COVID‐19 data below are obtained using such weights.9
TABLE 1.
Characteristics of survey respondents
| (1) | (2) | (3) | (4) | |
|---|---|---|---|---|
| % share of respondents | Wave nine | COVID‐19 study | Difference | |
| respondents | respondents | (1) − (2) | (p‐value) | |
| Female | 55.71 | 57.96 | −2.25 | (0.00) |
| Aged 16–19 | 5.81 | 3.94 | 1.87 | (0.00) |
| Aged 20–29 | 12.13 | 10.26 | 1.87 | (0.00) |
| Aged 30–29 | 14.21 | 14.67 | −0.46 | (0.17) |
| Aged 40–49 | 17.57 | 19.02 | −1.45 | (0.00) |
| Aged 50–59 | 18.77 | 21.63 | −2.86 | (0.00) |
| Aged 60+ | 31.50 | 30.47 | 1.03 | (0.02) |
| College and above | 29.84 | 37.50 | −7.66 | (0.00) |
| Non‐British ethnicity | 22.50 | 16.49 | 6.01 | (0.00) |
| Married | 54.04 | 59.54 | −5.50 | (0.00) |
| Living as a couple | 9.85 | 10.96 | −1.11 | (0.00) |
| Never married | 22.42 | 18.02 | 4.40 | (0.00) |
| Working at wave nine | 57.91 | 63.71 | −5.79 | (0.00) |
| Human health and social work | 6.51 | 7.59 | −1.08 | (0.00) |
| Public administration and defence | 3.92 | 4.95 | −1.02 | (0.00) |
| Accommodation and food service | 2.84 | 2.44 | 0.40 | (0.01) |
| HH income quintile 1 | 13.36 | 9.48 | 3.87 | (0.00) |
| HH income quintile 2 | 16.73 | 15.01 | 1.72 | (0.00) |
| HH income quintile 3 | 20.06 | 20.75 | −0.68 | (0.07) |
| HH income quintile 4 | 22.66 | 24.54 | −1.87 | (0.00) |
| HH income quintile 5 | 24.76 | 28.20 | −3.43 | (0.00) |
| HH income quintile unknown | 2.43 | 2.03 | 0.40 | (0.01) |
| Children aged 15 and younger | 25.43 | 26.05 | −0.62 | (0.13) |
| Age of youngest child | 7.14 | 7.21 | −0.07 | (0.36) |
| N | 32,596 | 16,934 | ||
Note: The table compares the characteristics of individuals who gave a full adult interview in USoc wave nine with the subset who also gave a full or partial interview in waves one or two of the COVID‐19 study. All individual and household (HH) characteristics are measured in wave nine. The ‐value of the two‐sample t‐test for equal means is given in parentheses (column 4).
Source: USoc (wave nine) and the COVID‐19 study (waves one and two).
This article is being made freely available through PubMed Central as part of the COVID-19 public health emergency response. It can be used for unrestricted research re-use and analysis in any form or by any means with acknowledgement of the original source, for the duration of the public health emergency.
For validation, we compare retrospective information on labour market outcomes in the COVID‐19 study with information from the January–March 2020 UK LFS. Table 2 reports descriptive statistics on employment rates and working hours for the overall population, and for men and women separately. Figures on employment rates are remarkably close across the two data sources, but there are some slight differences in working hours. A potential reason for small divergences is that the weighted COVID‐19 data provide estimates that are representative of the UK adult population as of the USoc wave nine, which was conducted during 2017 and 2018. This implies that the weights provided might not be exactly representative of the adult population in 2020.
TABLE 2.
Employment statistics validation
| (1) | (2) | (3) | |
|---|---|---|---|
| LFS | USoc | Difference | |
| Jan–Mar 2020 | Jan–Feb 2020 | (1) − (2) | |
| All | |||
| Employment rate (%) | 76.60 | 77.38 | −0.78 |
| [42.34] | [41.84] | (0.06) | |
| Weekly working hours | 31.77 | 34.44 | −2.67 |
| [17.09] | [12.51] | (0.00) | |
| Men | |||
| Employment rate (%) | 79.87 | 80.80 | −0.92 |
| [40.09] | [39.39] | (0.14) | |
| Weekly working hours | 35.95 | 38.22 | −2.27 |
| [16.54] | [11.20] | (0.00) | |
| Women | |||
| Employment rate (%) | 73.35 | 74.17 | −0.82 |
| [44.21] | [43.77] | (0.14) | |
| Weekly working hours | 27.36 | 30.56 | −3.20 |
| [16.54] | [12.60] | (0.00) |
Note: Standard deviations in brackets. All figures are obtained using weights. The ‐value of the two‐sample t‐test for equal means is given in parentheses (column 3). Weekly hours in the LFS correspond to total actual hours worked in the reference week. Weekly hours in the COVID‐19 study correspond to usual hours worked in January and February 2020. All samples include individuals aged 16–64.
Source: UK LFS January–March 2020 for column 1; USoc COVID‐19 study (waves one and two) for column 2.
This article is being made freely available through PubMed Central as part of the COVID-19 public health emergency response. It can be used for unrestricted research re-use and analysis in any form or by any means with acknowledgement of the original source, for the duration of the public health emergency.
To describe COVID‐19 impacts on labour market outcomes, we select all individuals aged 16–64 who participated in at least one of the COVID‐19 waves and who had previously participated in USoc wave nine ( = 10,703). We restrict further to those who report being employed as of January 2020 ( = 8,362), and we drop individuals with missing information on age, education, region, or basic employment characteristics, leaving us with a sample of 8,073 individuals. Descriptive statistics for this sample are reported in Table 3.
TABLE 3.
Summary statistics: market work
| (1) | (2) | (3) | |
|---|---|---|---|
| All | Male | Female | |
| Age (years) | 42.06 | 42.47 | 41.64 |
| College and above (%) | 37.99 | 36.86 | 39.14 |
| Female (%) | 49.55 | 0.00 | 100.00 |
| Children aged 0–15 (%) | 37.49 | 37.71 | 37.28 |
| Labour market characteristics Jan–Feb 2020 | |||
| Working (%) | 100.00 | 100.00 | 100.00 |
| Weekly working hours | 34.57 | 38.44 | 30.63 |
| Weekly earnings (£) | 418.38 | 489.48 | 344.85 |
| Type of employment: | |||
| Employed (%) | 85.94 | 83.24 | 88.69 |
| Self‐employed (%) | 11.09 | 13.58 | 8.55 |
| Both employed and self‐employed (%) | 2.97 | 3.18 | 2.76 |
| Worked from home: | |||
| Always (%) | 5.18 | 4.75 | 5.63 |
| Often (%) | 5.88 | 6.49 | 5.26 |
| Sometimes (%) | 17.54 | 18.05 | 17.01 |
| Never (%) | 71.40 | 70.71 | 72.10 |
| Contract type: | |||
| Fixed hours (%) | 67.69 | 63.50 | 71.95 |
| Fixed salary (%) | 60.14 | 59.34 | 60.95 |
| Paid by hours worked (%) | 24.44 | 22.01 | 26.90 |
| Labour market outcomes April–May 2020 | |||
| Ever job loss since baseline (%) | 4.27 | 4.41 | 4.13 |
| Ever furloughed since baseline (%) | 28.59 | 30.14 | 27.10 |
| Reduced hours (%) | 49.62 | 48.87 | 50.35 |
| Reduced earnings (%) | 36.40 | 38.60 | 34.24 |
| Weekly working hours | 23.25 | 25.82 | 20.76 |
| Change in working hours | −11.20 | −12.62 | −9.83 |
| Weekly earnings (£) | 382.54 | 443.23 | 323.45 |
| Change in weekly earnings (£) | −36.35 | −50.31 | −22.67 |
| Number of individuals | 8,073 | 3,389 | 4,684 |
Note: The sample includes individuals aged 16–64 who were employed in January–February 2020 and have no missing control variables. Summary statistics are derived using cross‐sectional weights.
Source: USoc (wave nine) and the COVID‐19 study (waves one and two).
This article is being made freely available through PubMed Central as part of the COVID-19 public health emergency response. It can be used for unrestricted research re-use and analysis in any form or by any means with acknowledgement of the original source, for the duration of the public health emergency.
The analysis of outcomes relating to domestic work and childcare combines the COVID‐19 study with pre‐pandemic data sources. For information on hours of housework, we select individuals living as a couple, who participated in at least one of the COVID‐19 waves. Having dropped individuals with missing information on basic individual or employment controls, or missing information on household composition, we are left with a sample of 10,643 individuals (17,614 observations). Pre‐pandemic information on housework is obtained from USoc wave eight (2016–17, = 17,610).
For the analysis of childcare, we further select individuals with children aged 15 and younger, leaving us with a sample of 3,384 individuals and 5,384 observations across the two waves of the COVID‐19 study. For the pre‐pandemic period, we only have limited information on childcare provision, as individuals are only asked in USoc wave eight about the person mainly in charge of childcare in their household ( = 5,892), and no information on childcare hours is provided. We therefore compare descriptive statistics on childcare hours during the COVID‐19 pandemic to the latest corresponding statistics from the 2014–15 UK Time Use Survey. Table 4 provides detailed summary statistics for variables regarding non‐labour‐market work.
TABLE 4.
Summary statistics: non‐market work
| (1) | (2) | (3) | (4) | (5) | (6) | |
|---|---|---|---|---|---|---|
| All couples | Couples with children | |||||
| aged 0–15 | ||||||
| All | Male | Female | All | Male | Female | |
| Household work: | ||||||
| Weekly hours (COVID‐19) | 12.77 | 9.78 | 15.83 | 13.83 | 10.89 | 16.80 |
| N | 17,614 | 7,939 | 9,675 | 5,402 | 2,266 | 3,136 |
| Weekly hours (USoc wave eight) | 10.25 | 6.46 | 14.11 | 10.90 | 6.63 | 15.14 |
| N | 17,610 | 8,365 | 9,245 | 5,821 | 2,681 | 3,140 |
| Childcare hours: | ||||||
| Weekly hours (COVID‐19) | 20.58 | 14.76 | 26.50 | |||
| N | 5,384 | 2,262 | 3,122 | |||
| Weekly hours (UK TUS 2014–15) | 12.43 | 7.81 | 16.99 | |||
| Mainly responsible for childcare | ||||||
| (COVID‐19): | ||||||
| Mainly self | 34.85 | 18.60 | 57.49 | |||
| Mainly partner | 39.44 | 55.41 | 17.20 | |||
| Shared | 20.82 | 21.03 | 20.54 | |||
| Couple reports 0 hours childcare in total | 4.88 | 4.96 | 4.77 | |||
| N | 3,147 | 1,557 | 1,590 | |||
| Mainly responsible for childcare | ||||||
| (USoc wave eight): | ||||||
| Mainly self | 29.70 | 2.60 | 56.81 | |||
| Mainly partner | 22.10 | 41.34 | 2.86 | |||
| Shared | 47.94 | 55.68 | 40.20 | |||
| Someone else | 0.26 | 0.39 | 0.13 | |||
| N | 5,892 | 2,718 | 3,174 | |||
Note: Columns 1–3 refer to the sample of individuals who are living in a couple, and columns 4–6 refer to the subsample of those with children aged 15 and younger. Summary statistics are derived using cross‐sectional weights.
Source: USoc (waves eight and nine), the COVID‐19 study (waves one and two) and the 2014–15 UK Time Use Survey.
This article is being made freely available through PubMed Central as part of the COVID-19 public health emergency response. It can be used for unrestricted research re-use and analysis in any form or by any means with acknowledgement of the original source, for the duration of the public health emergency.
IV. Labour market outcomes
The (short‐run) impact of the pandemic on the labour market can be assessed by comparing information on outcomes as of the April and May 2020 survey dates with retrospective information referring to January 2020. Among individuals who report being employed in January 2020 (including employees and the self‐employed), about 4.3 per cent report being out of work by May 2020, including involuntary separations and quits.10 Most of the adjustment in working hours during the downturn has taken place via furloughing under the Coronavirus Job Retention Scheme introduced on 20 March 202011 and, according to government guidance, those on furlough are classified as being employed. By the end of May, about 29 per cent of employees report having ever been furloughed in the COVID‐19 study, in line with evidence collected by ONS (2020a) in a survey of businesses.12 Over the same period, working hours among those employed in January 2020 fell by 11.2 hours weekly on average and earnings fell by 9.5 per cent on average (or £36).
Table 5 shows results from linear probability models for the incidence of job loss. The dependent variable is equal to one for all individuals who report being out of work in either April or May 2020, having reported to be in work in January. We treat job loss as an absorbing state, and the sample contains one observation per individual. Regressions control for a set of individual and job‐related characteristics. Most characteristics are recorded in the COVID‐19 study and refer to January 2020. Whenever relevant controls are not available in the COVID‐19 study, as is the case for education, industry and occupation, we use information recorded in wave nine.
TABLE 5.
Job loss during the COVID‐19 pandemic
| (1) | (2) | (3) | (4) | (5) | (6) | |
|---|---|---|---|---|---|---|
| All | All | All | All | Males | Females | |
| Female | −0.00355 | −0.00525 | −0.00457 | −0.00528 | ||
| (0.0100) | (0.00946) | (0.00887) | (0.0101) | |||
| Living as a couple | −0.0165 | −0.0124 | −0.0151 | −0.0141 | −0.0155 | |
| (0.0110) | (0.0108) | (0.00905) | (0.0159) | (0.0109) | ||
| Has children aged 0–4 | −0.00106 | −0.000859 | 0.00506 | −0.00139 | 0.0129 | |
| (0.0124) | (0.0122) | (0.0116) | (0.0166) | (0.0174) | ||
| Has children aged 5–15 | 0.0120 | 0.0112 | 0.00753 | 0.00779 | 0.00507 | |
| (0.0142) | (0.0137) | (0.0119) | (0.0118) | (0.0196) | ||
| Always WFH | −0.00106 | −0.00164 | 0.00891 | −0.00788 | ||
| (0.0190) | (0.0150) | (0.0298) | (0.0134) | |||
| Often WFH | −0.00886 | −0.00629 | 0.00303 | −0.00985 | ||
| (0.0125) | (0.0131) | (0.0214) | (0.0136) | |||
| Sometimes WFH | −0.0136* | −0.0109 | −0.00837 | −0.00653 | ||
| (0.00629) | (0.00682) | (0.00957) | (0.00976) | |||
| Constant | 0.0473*** | 0.108* | 0.130* | 0.0508 | 0.101 | 0.0354 |
| (0.00860) | (0.0463) | (0.0572) | (0.0524) | (0.122) | (0.0602) | |
| Observations | 8,073 | 8,073 | 8,073 | 8,073 | 3,389 | 4,684 |
| Age and education | No | Yes | Yes | Yes | Yes | Yes |
| Region FE | No | Yes | Yes | Yes | Yes | Yes |
| Job characteristics | No | No | Yes | Yes | Yes | Yes |
| Occupation FE | No | No | No | Yes | Yes | Yes |
| Industry FE | No | No | No | Yes | Yes | Yes |
Note: The dependent variable is equal to one if the individual reports to be non‐employed in April or May 2020, and zero otherwise. Non‐employment in April is treated as an absorbing state. Age controls are dummy variables for ages 20–29, 30–39, 40–49, 50–59, 60+ (16–19 is the excluded category); education controls are dummy variables for GCSEs or equiv., A‐levels or equiv., and college education or higher; job characteristics are indicators for self employment, fixed hours, fixed salary and paid by the hour; occupation and industry fixed‐effects are at the two‐digit level. All covariates refer to January 2020, except education, occupation and industry, which are imported from USoc wave nine (2017–18). All specifications control for an April wave dummy and use cross‐sectional weights. * , ** , *** . The sample consists of all employed individuals in January 2020, aged 16–64.
Source: USoc (wave nine) and the COVID‐19 study (waves one and two).
This article is being made freely available through PubMed Central as part of the COVID-19 public health emergency response. It can be used for unrestricted research re-use and analysis in any form or by any means with acknowledgement of the original source, for the duration of the public health emergency.
The specification in column 1 only controls for a female dummy (and a dummy for survey wave), and shows evidence of virtually no gender differences in the likelihood of job loss. In column 2, we control for household composition (as well as age, education and region dummies), in column 3 we introduce job controls, including WFH habits, and in column 4 we additionally control for two‐digit industry and occupation, the finest classification available in USoc.13 While there is some indication that WFH at baseline reduces the probability of job loss (from column 3), the incidence of job loss is very similar across genders. This result is in contrast with evidence for the US reported by Alon et al. (2020), who find much larger (and unprecedented) unemployment increases among women than men. It also somewhat differs from evidence based on real‐time data for the United Kingdom analysed by Adams‐Prassl et al. (2020), who find that women are about 2–3 percentage points more likely to report job losses than men, having controlled for individual and job characteristics. Columns 5 and 6 report results from separate regressions for men and women, respectively, and show no evidence of gender differences in the effects of household and job characteristics.
Table 6 reports corresponding evidence for the incidence of furloughing among employees. The dependent variable is equal to one for individuals who report having ever been furloughed by May 2020. The raw gender differential reported in column 1 implies that women are nearly 3 percentage points less likely to be furloughed than men, but this effect is imprecisely estimated. The gender differential turns positive when including occupation and industry controls in column 4, consistent with lower furlough incidence in female‐dominated jobs, but again the associated coefficient does not reach standard significance levels. As one would expect, the likelihood of furloughing is negatively and strongly correlated with the incidence of WFH before COVID‐19, both in the whole sample (columns 3 and 4) and for each gender taken separately (columns 5 and 6).
TABLE 6.
Ever furloughed during the COVID‐19 pandemic
| (1) | (2) | (3) | (4) | (5) | (6) | |
|---|---|---|---|---|---|---|
| All | All | All | All | Males | Females | |
| Female | −0.0291 | −0.0283 | −0.0277 | 0.0174 | ||
| (0.0168) | (0.0164) | (0.0164) | (0.0163) | |||
| Living as a couple | −0.0252 | −0.00844 | −0.0103 | −0.0224 | 0.00259 | |
| (0.0197) | (0.0199) | (0.0176) | (0.0289) | (0.0219) | ||
| Has children aged 0–4 | 0.00236 | 0.00231 | 0.0216 | 0.0435 | −0.00154 | |
| (0.0298) | (0.0288) | (0.0256) | (0.0342) | (0.0362) | ||
| Has children aged 5–15 | 0.0209 | 0.0226 | 0.0265 | 0.0176 | 0.0362 | |
| (0.0198) | (0.0200) | (0.0172) | (0.0253) | (0.0220) | ||
| Always WFH | −0.121*** | −0.118*** | −0.137** | −0.0930* | ||
| (0.0310) | (0.0315) | (0.0428) | (0.0433) | |||
| Often WFH | −0.0790* | −0.0586* | −0.0303 | −0.0760* | ||
| (0.0309) | (0.0271) | (0.0424) | (0.0319) | |||
| Sometimes WFH | −0.107*** | −0.0923*** | −0.0676* | −0.109*** | ||
| (0.0175) | (0.0169) | (0.0272) | (0.0203) | |||
| Constant | 0.295*** | 0.577*** | 0.663*** | 0.182 | 0.167 | 0.540* |
| (0.0142) | (0.0833) | (0.0922) | (0.114) | (0.192) | (0.230) | |
| Observations | 7,118 | 7,118 | 7,118 | 7,118 | 2,878 | 4,240 |
| Age and education | No | Yes | Yes | Yes | Yes | Yes |
| Region FE | No | Yes | Yes | Yes | Yes | Yes |
| Job characteristics | No | No | Yes | Yes | Yes | Yes |
| Occupation FE | No | No | No | Yes | Yes | Yes |
| Industry FE | No | No | No | Yes | Yes | Yes |
Note: The dependent variable is equal to one if the individual reports to be furloughed in April or May 2020, and zero otherwise. Furloughing in April is treated as an absorbing state. Age controls are dummy variables for ages 20–29, 30–39, 40–49, 50–59, 60+; education controls are dummy variables for GCSEs or equiv., A‐levels or equiv., and college education or higher; job characteristics are indicators for self employment, fixed hours, fixed salary and paid by the hour; occupation and industry fixed‐effects are at the two‐digit level. All covariates refer to January 2020, except education, occupation and industry, which are imported from USoc wave nine (2017–18). All specifications control for an April wave dummy and use cross‐sectional weights. * , ** , *** . The sample consists of all employees in January 2020, aged 16–64.
Source: USoc (wave nine) and the COVID‐19 study (waves one and two).
This article is being made freely available through PubMed Central as part of the COVID-19 public health emergency response. It can be used for unrestricted research re-use and analysis in any form or by any means with acknowledgement of the original source, for the duration of the public health emergency.
We next present evidence on working hours in Table 7. As changes in hours may not be absorbing states, we exploit information on hours contained in each COVID‐19 wave, and the sample includes repeated observations for individuals who responded in both waves. Panel A estimates a linear probability model for reduced working hours among those employed in January 2020, whether they are fully employed, furloughed or non‐employed. In May 2020, about 51 per cent of men and 52 per cent of women report reduced weekly hours (from column 1), but the gender differential is not statistically significant. Only when controlling for job characteristics in columns 3 and 4 does the gender differential become significant (and larger in magnitude). As expected, the likelihood of working shorter hours increases with the presence of young children in the household, and decreases with WFH habits. While women are more likely to experience losses in hours, their average reduction in hours is smaller than for men, as shown in panel B. The raw differential is about 2.8 weekly hours (column 1) and shrinks by about a half when controlling for the full set of job characteristics (column 4).
TABLE 7.
Working hours during the COVID‐19 pandemic
| (1) | (2) | (3) | (4) | (5) | (6) | |
|---|---|---|---|---|---|---|
| All | All | All | All | Males | Females | |
| Panel A: incidence of reduced weekly hours | ||||||
| Female | 0.0148 | 0.0168 | 0.0367* | 0.0310* | ||
| (0.0153) | (0.0150) | (0.0146) | (0.0157) | |||
| Living as a couple | −0.0319 | −0.0219 | −0.0194 | −0.0261 | −0.0108 | |
| (0.0190) | (0.0180) | (0.0158) | (0.0257) | (0.0194) | ||
| Has children aged 0–4 | 0.0605* | 0.0615** | 0.0705** | 0.0767* | 0.0607* | |
| (0.0254) | (0.0236) | (0.0216) | (0.0306) | (0.0301) | ||
| Has children aged 5–15 | 0.0280 | 0.0228 | 0.00963 | −0.0166 | 0.0378 | |
| (0.0177) | (0.0166) | (0.0153) | (0.0224) | (0.0204) | ||
| Always WFH | −0.0836** | −0.0730** | −0.0678 | −0.0593 | ||
| (0.0267) | (0.0270) | (0.0427) | (0.0350) | |||
| Often WFH | −0.0784** | −0.0531* | −0.0395 | −0.0618 | ||
| (0.0260) | (0.0246) | (0.0359) | (0.0333) | |||
| Sometimes WFH | −0.0595*** | −0.0380* | −0.0290 | −0.0444* | ||
| (0.0172) | (0.0165) | (0.0247) | (0.0214) | |||
| Constant | 0.507*** | 0.605*** | 0.711*** | 0.100 | 0.133 | 0.0729 |
| (0.0133) | (0.0712) | (0.0806) | (0.147) | (0.230) | (0.195) | |
| Panel B: change in weekly hours | ||||||
| Female | 2.782*** | 2.643*** | 2.108*** | 1.371* | ||
| (0.594) | (0.583) | (0.584) | (0.613) | |||
| Living as a couple | 1.375 | 0.985 | 1.147 | 1.300 | 0.672 | |
| (0.740) | (0.723) | (0.633) | (1.095) | (0.737) | ||
| Has children aged 0–4 | −0.583 | −0.594 | −0.970 | −1.189 | −0.537 | |
| (0.957) | (0.933) | (0.814) | (1.345) | (0.871) | ||
| Has children aged 5–15 | −0.570 | −0.467 | 0.189 | 0.484 | −0.254 | |
| (0.669) | (0.633) | (0.576) | (0.921) | (0.667) | ||
| Always WFH | 5.648*** | 4.927*** | 5.204** | 4.215** | ||
| (1.131) | (1.119) | (1.894) | (1.355) | |||
| Often WFH | 2.896** | 1.944* | 0.730 | 2.948** | ||
| (1.046) | (0.970) | (1.534) | (1.118) | |||
| Sometimes WFH | 3.279*** | 2.524*** | 2.318* | 2.460*** | ||
| (0.633) | (0.597) | (0.929) | (0.716) | |||
| Constant | −11.89*** | −12.06*** | −16.42*** | −1.020 | 2.880 | 4.514 |
| (0.535) | (2.981) | (3.306) | (6.273) | (9.833) | (7.416) | |
| Observations | 14,133 | 14,133 | 14,133 | 14,133 | 5,860 | 8,273 |
| Age and education | No | Yes | Yes | Yes | Yes | Yes |
| Region FE | No | Yes | Yes | Yes | Yes | Yes |
| Job characteristics | No | No | Yes | Yes | Yes | Yes |
| Occupation FE | No | No | No | Yes | Yes | Yes |
| Industry FE | No | No | No | Yes | Yes | Yes |
Note: The dependent variable in panel A is equal to one if the individual reports fewer working hours in April–May than in January 2020 and zero otherwise; in panel B, it is equal to the change in weekly hours between January and April–May 2020. Each individual contributes a number of observations equal to the number of COVID‐19 study waves in which they participated. Age controls are dummy variables for ages 20–29, 30–39, 40–49, 50–59, 60+; education controls are dummy variables for GCSEs or equiv., A‐levels or equiv., and college education or higher; job characteristics are indicators for self employment, fixed hours, fixed salary and paid by the hour; occupation and industry fixed‐effects are at the two‐digit level. All covariates refer to January 2020, except education, occupation and industry, which are imported from USoc wave nine (2017–18). All specifications control for an April wave dummy and use cross‐sectional weights. Standard errors are clustered at the individual level. * , ** , *** . The sample consists of all employed individuals in January 2020, aged 16–64.
Source: USoc (wave nine) and the COVID‐19 study (waves one and two).
This article is being made freely available through PubMed Central as part of the COVID-19 public health emergency response. It can be used for unrestricted research re-use and analysis in any form or by any means with acknowledgement of the original source, for the duration of the public health emergency.
Evidence on changes in earnings is shown in Table 8. Differently from hours losses, raw earnings losses are less frequent among women (panel A, column 1), but this differential is fully explained by job characteristics (columns 3 and 4). Moreover, earnings losses for women are on average smaller than for men (panel B). Using estimates for raw differences in column 1 of panel B, men lose on average about £38 per week, corresponding to a 7.7 per cent fall with respect to their January 2020 earnings. Women lose on average £10 per week, corresponding to about 3 per cent of their January 2020 earnings. More than 40 per cent of this differential is explained by job characteristics (column 4).
TABLE 8.
Earnings losses during the COVID‐19 pandemic
| (1) | (2) | (3) | (4) | (5) | (6) | |
|---|---|---|---|---|---|---|
| All | All | All | All | Males | Females | |
| Panel A: incidence of earnings losses | ||||||
| Female | −0.0437** | −0.0387** | −0.0188 | 0.00677 | ||
| (0.0156) | (0.0149) | (0.0142) | (0.0152) | |||
| Living as a couple | −0.0119 | −0.00107 | −0.0110 | 0.00474 | −0.0135 | |
| (0.0195) | (0.0177) | (0.0159) | (0.0259) | (0.0196) | ||
| Has children aged 0–4 | 0.0448 | 0.0441 | 0.0478* | 0.0478 | 0.0435 | |
| (0.0276) | (0.0248) | (0.0224) | (0.0327) | (0.0281) | ||
| Has children aged 5–15 | 0.0194 | 0.0119 | 0.00969 | 0.00658 | 0.0166 | |
| (0.0184) | (0.0175) | (0.0163) | (0.0234) | (0.0216) | ||
| Always WFH | −0.0524 | −0.0417 | −0.0509 | −0.0197 | ||
| (0.0295) | (0.0291) | (0.0462) | (0.0340) | |||
| Often WFH | −0.0212 | −0.00886 | 0.0316 | −0.0363 | ||
| (0.0257) | (0.0254) | (0.0372) | (0.0333) | |||
| Sometimes WFH | −0.0295 | −0.0197 | −0.0286 | −0.00310 | ||
| (0.0166) | (0.0160) | (0.0241) | (0.0210) | |||
| Constant | 0.417*** | 0.466*** | 0.669*** | 0.246 | 0.253 | 0.173 |
| (0.0137) | (0.0734) | (0.0839) | (0.178) | (0.289) | (0.150) | |
| Panel B: change in weekly earnings | ||||||
| Female | 27.62** | 27.79** | 21.97* | 16.05* | ||
| (8.552) | (8.666) | (8.590) | (7.337) | |||
| Living as a couple | 13.16 | 13.38 | 14.56 | 20.16 | 9.879 | |
| (11.79) | (11.61) | (10.40) | (21.95) | (9.509) | ||
| Has children aged 0–4 | −4.685 | −5.270 | −11.27 | −2.700 | −22.81* | |
| (13.89) | (13.77) | (12.07) | (21.85) | (9.589) | ||
| Has children aged 5–15 | −11.19 | −8.053 | −6.640 | −12.95 | −3.377 | |
| (10.14) | (9.445) | (8.002) | (12.66) | (8.597) | ||
| Always WFH | 11.54 | 16.54 | 36.21 | −8.794 | ||
| (17.13) | (19.29) | (31.04) | (23.29) | |||
| Often WFH | −14.13 | −0.693 | −12.51 | 12.85 | ||
| (14.39) | (20.14) | (37.77) | (12.11) | |||
| Sometimes WFH | 0.187 | 7.982 | 0.795 | 6.740 | ||
| (10.55) | (13.00) | (24.32) | (8.307) | |||
| Constant | −37.63*** | −24.88 | −86.61* | 238.2 | 167.4 | 86.66 |
| (10.77) | (30.79) | (34.80) | (219.8) | (280.9) | (45.56) | |
| Observations | 12,813 | 12,813 | 12,813 | 12,813 | 5,337 | 7,476 |
| Age and education | No | Yes | Yes | Yes | Yes | Yes |
| Region FE | No | Yes | Yes | Yes | Yes | Yes |
| Job characteristics | No | No | Yes | Yes | Yes | Yes |
| Occupation FE | No | No | No | Yes | Yes | Yes |
| Industry FE | No | No | No | Yes | Yes | Yes |
Note: The dependent variable in panel A is equal to one if the individual reports lower weekly earnings in April–May than in January 2020 and zero otherwise; in panel B, it is equal to the change in weekly earnings between January and April–May 2020. Each individual contributes a number of observations equal to the number of COVID‐19 study waves in which they participated. Age controls are dummy variables for ages 20–29, 30–39, 40–49, 50–59, 60+; education controls are dummy variables for GCSEs or equiv., A‐levels or equiv., and college education or higher; job characteristics are indicators for self employment, fixed hours, fixed salary and paid by the hour; occupation and industry fixed‐effects are at the two‐digit level. All covariates refer to January 2020, except education, occupation and industry, which are imported from USoc wave nine (2017–18). All specifications control for an April wave dummy and use cross‐sectional weights. Standard errors are clustered at the individual level. * , ** , *** . The sample consists of all employed individuals in January 2020, aged 16–64.
Source: USoc (wave nine) and the COVID‐19 study (waves one and two).
This article is being made freely available through PubMed Central as part of the COVID-19 public health emergency response. It can be used for unrestricted research re-use and analysis in any form or by any means with acknowledgement of the original source, for the duration of the public health emergency.
In summary, we find evidence that labour market outcomes of men and women were roughly equally affected at the extensive margin, as measured by the incidence of job loss or furloughing, but if anything, women suffered smaller losses at the intensive margin, experiencing slightly smaller changes in both working hours and earnings. This finding is broadly in line with evidence from administrative data on the claimant count, which includes both those out of work and those working on low earnings or hours, and thus represents an indicator of overall economic disadvantage for those who participate in the labour force. Between March and May 2020, the proportion of the male labour force in the claimant count rose from 3.9 per cent to 8.6 per cent, while the corresponding figure for women rose from 3.1 per cent to 6.1 per cent, thus showing a slightly higher increase for men than for women, both in absolute and relative terms. These gender differentials are also echoed by information on welfare receipt from the COVID‐19 study: 4.5 per cent and 3.3 per cent of men and women, respectively, report to have applied for Universal Credit since January 2020, with 3.5 per cent and 2.5 per cent, respectively, already in receipt by May 2020.
V. Home production
Measuring changes in home production (and childcare in particular) during the pandemic is complicated by the fact that the COVID‐19 study does not contain retrospective information on these variables. We thus benchmark information provided in the COVID‐19 study to comparable information from previous USoc surveys and the 2014–15 UK Time Use Survey. As we are primarily interested in the gender division of work within the household, we restrict our working sample to heterosexual couples, whether married or cohabiting.
The COVID‐19 questionnaire covers several aspects of domestic work, including hours spent on housework (cooking, cleaning and doing the laundry) and hours spent on childcare (including home schooling). Figure 3 gives a snapshot of the gender division of housework before and during the COVID‐19 pandemic. Information on housework for the earlier period is available from USoc wave eight. This shows that, in 2016–17, women were doing just over 14 hours of housework weekly, while men were doing about 6.5 hours. The corresponding figures for the COVID‐19 period have risen to about 16 and 10 hours for women and men, respectively. The overall amount of housework for the average two‐adult household has thus increased by about 25 per cent, with a higher absolute and proportional increase for men, and a reduction of the corresponding gender gap from 7.6 to 6 hours.
FIGURE 3.
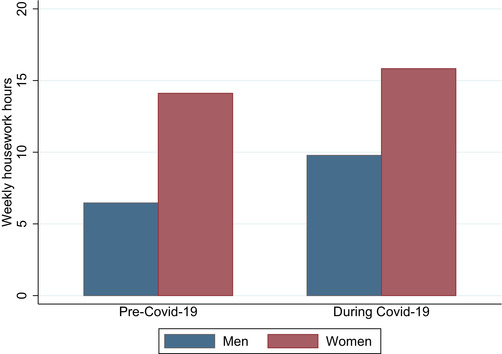
Gender gaps in housework hours, before and during the COVID‐19 pandemic
Note: The bars show usual weekly hours spent on housework before (2016–17) and during (April–May 2020) the COVID‐19 pandemic. The sample consists of men and women living in a couple.
Source: USoc (wave nine) and the COVID‐19 study (waves one and two).
Regression results reported in Table 9 show that the gender gap in housework hours is only slightly affected by individual and job characteristics, whether before or during the COVID‐19 pandemic (see columns 1–3 in panels A and B, respectively). While the overall gender gap in housework hours has fallen during the COVID‐19 pandemic, it remains more sensitive to the presence of children, own employment status and partner's employment status for women than for men, as shown in columns 4 and 5.
TABLE 9.
Hours spent on housework before and during the COVID‐19 pandemic
| (1) | (2) | (3) | (4) | (5) | |
|---|---|---|---|---|---|
| All | All | All | Males | Females | |
| Panel A: 2016–17 | |||||
| Female | 7.651*** (0.131) | 7.808*** (0.130) | 7.320*** (0.135) | ||
| Has children aged 0–4 | 1.981*** (0.241) | 1.828*** (0.241) | 0.854** (0.267) | 2.836*** (0.411) | |
| Has children aged 5–15 | 2.418*** (0.181) | 2.255*** (0.182) | 0.755*** (0.193) | 3.962*** (0.318) | |
| Not working (wave eight) | 4.049*** (0.227) | 2.727*** (0.273) | 4.849*** (0.343) | ||
| Not working (wave eight) (partner) | −1.099*** (0.189) | −0.846*** (0.203) | −1.293*** (0.351) | ||
| Constant | 6.461*** (0.0730) | 0.564 (1.196) | 0.440 (1.379) | 2.589 (2.018) | 6.468*** (1.609) |
| Observations | 17,610 | 17,610 | 16,035 | 7,829 | 8,206 |
| Panel B: April–May 2020 | |||||
| Female | 6.057*** (0.258) | 6.226*** (0.253) | 6.531*** (0.287) | ||
| Has children aged 0–4 | 2.626*** (0.500) | 2.351*** (0.582) | 1.727* (0.747) | 3.221*** (0.893) | |
| Has children aged 5–15 | 2.239*** (0.349) | 2.275*** (0.389) | 1.715*** (0.496) | 2.889*** (0.617) | |
| Furloughed | 1.864*** (0.521) | 1.112 (0.689) | 3.004*** (0.766) | ||
| Not working (Jan 2020) | 2.807*** (0.445) | 2.079** (0.648) | 3.477*** (0.594) | ||
| Furloughed (partner) | −1.392** (0.499) | −1.315* (0.602) | −1.417 (0.764) | ||
| Not working (Jan 2020) (partner) | −0.820 (0.444) | −0.821 (0.588) | −1.271* (0.607) | ||
| Constant | 9.986*** (0.205) | 0.385 (1.339) | 6.357*** (0.920) | 8.162*** (1.314) | 11.23*** (1.201) |
| Observations | 17,614 | 17,614 | 11,628 | 5,712 | 5,916 |
| Individual controls | No | Yes | Yes | Yes | Yes |
| Own job characteristics | No | No | Yes | Yes | Yes |
| Partner job characteristics | No | No | Yes | Yes | Yes |
Note: The dependent variable is the number of weekly hours spent on housework, measured in USoc wave eight (panel A) and in the COVID‐19 study waves one and two (panel B). In panel B, each individual contributes a number of observations equal to the number of COVID‐19 waves in which they participated. Individual controls include dummy variables for ages 20–29, 30–39, 40–49, 50–59, 60+ (16–19 is the excluded category) and dummy variables for no qualifications, GCSEs or equiv., A‐levels or equiv., and college education or higher. Own job characteristics include indicators for being employed, frequency of working from home dummies, two‐digit industry and occupation dummies. All job‐related dummies have an extra category for non‐employed individuals. Partner's job characteristics are only available for those whose partners gave a full interview. In panel B, all covariates refer to January 2020, except education, occupation and industry, which are imported from USoc wave nine (2017–18). All specifications control for an April wave dummy and use cross‐sectional weights. Standard errors are clustered at the individual level. * , ** , *** . The sample consists of all individuals living in a couple.
Source: USoc (wave nine) and the COVID‐19 study (waves one and two).
This article is being made freely available through PubMed Central as part of the COVID-19 public health emergency response. It can be used for unrestricted research re-use and analysis in any form or by any means with acknowledgement of the original source, for the duration of the public health emergency.
To show evidence on changes in childcare hours (including home schooling), we combine information in the COVID‐19 study with comparable information from the 2014–15 UK Time Use Data. Figure 4 shows average weekly childcare hours by gender, before and during the COVID‐19 pandemic. The sample refers to couples with children aged 15 and younger. The first salient fact is the sharp increase in total childcare time, from nearly 25 to over 41 hours weekly. In 2014–15, mothers were doing on average 17 hours of childcare, while fathers were doing just under 8 hours. In 2020, mothers' hours have risen to 26.5, and fathers' hours have risen to 14.8. Women take on board a higher share of increased childcare needs than men (9.5 extra hours as opposed to 6.9 extra hours), with a corresponding increase in the gender differential from 9.2 hours in 2014–15 to 11.7 hours in 2020 (more than offsetting the fall in the gender differential in housework time).
FIGURE 4.
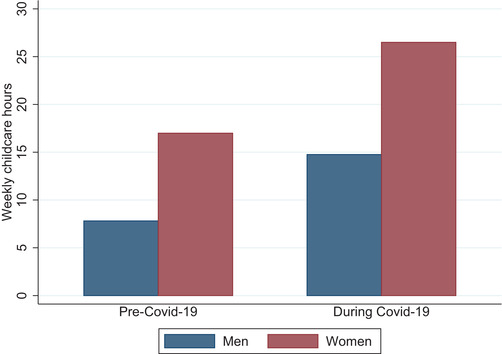
Gender gaps in childcare hours, before and during the COVID‐19 pandemic
Note: The bars show usual weekly hours spent on childcare and home schooling before (2014–15) and during (April–May 2020) the COVID‐19 pandemic. The sample consists of men and women living in a couple, with children aged 15 and younger.
Source: 2014–15 UK Time Use Survey and the COVID‐19 study (waves one and two).
Table 10 shows evidence on the determinants of the childcare differential. Controlling for individual characteristics and own job characteristics in column 2 explains about one hour of the overall differential, and controlling for own and partner's employment status in column 3 explains nearly another hour.
TABLE 10.
Hours spent on childcare and home schooling during the COVID‐19 pandemic
| (1) | (2) | (3) | (4) | (5) | |
|---|---|---|---|---|---|
| All | All | All | Males | Females | |
| Female | 11.72*** | 10.73*** | 9.978*** | ||
| (1.118) | (1.101) | (1.438) | |||
| Has children age 0‐4 | 13.89*** | 12.48*** | 9.199*** | 16.77*** | |
| (1.265) | (1.498) | (1.838) | (2.485) | ||
| Furloughed | 4.357* | 7.665** | −0.557 | ||
| (1.860) | (2.473) | (2.467) | |||
| Not working (Jan 2020) | 6.225* | 7.727 | 6.082* | ||
| (2.580) | (5.387) | (3.066) | |||
| Furloughed (partner) | 0.778 | −1.361 | 3.781 | ||
| (2.048) | (1.969) | (3.703) | |||
| Not working (Jan 2020) (partner) | −2.397 | −2.559 | −8.095* | ||
| (2.185) | (2.418) | (3.380) | |||
| Constant | 14.08*** | 1.400 | 9.054 | 18.19* | 4.341 |
| (0.940) | (14.25) | (5.077) | (7.113) | (5.867) | |
| Observations | 5,384 | 5,384 | 3,348 | 1,647 | 1,701 |
| Individual controls | No | Yes | Yes | Yes | Yes |
| Own job characteristics | No | No | Yes | Yes | Yes |
| Partner job characteristics | No | No | Yes | Yes | Yes |
Note: The dependent variable is the number of weekly hours spent on childcare and home schooling, measured in April–May 2020. Each individual contributes a number of observations equal to the number of COVID‐19 study waves in which they participated. Individual controls include dummy variables for ages 20–29, 30–39, 40–49, 50–59, 60+ (16–19 is the excluded category) and dummy variables for no qualifications, GCSEs or equiv., A‐levels or equiv., and college education or higher. Own job characteristics include indicators for being employed, frequency of working from home dummies, two‐digit industry and occupation dummies. All job‐related dummies have an extra category for non‐employed individuals. Partner's job characteristics are only available for those whose partners gave a full interview. All covariates refer to January 2020, except education, occupation and industry, which are imported from USoc wave nine (2017–18). All specifications control for an April wave dummy and use cross‐sectional weights. Standard errors are clustered at the individual level. * , ** , *** . The sample consists of individuals living in a couple, with children aged 15 and younger.
Source: USoc (wave nine) and the COVID‐19 study (waves one and two).
This article is being made freely available through PubMed Central as part of the COVID-19 public health emergency response. It can be used for unrestricted research re-use and analysis in any form or by any means with acknowledgement of the original source, for the duration of the public health emergency.
While there is no earlier information on childcare hours in the USoc, wave eight respondents are asked about the main provider of childcare in their household – with possible answers being (a) mainly self, (b) mainly partner, (c) shared and (d) someone else. We create comparable information in the COVID‐19 survey for households in which both partners answer the question on total childcare time. We define the main provider of childcare in April 2020 as: (a) mainly self, if the respondent does 60 per cent or more of the total reported childcare hours for the couple; (b) mainly partner, if the respondent does less than 40 per cent of the total; (c) shared, if the respondent does between 40 per cent and 60 per cent of the total.
Column 1 in panel A of Table 11 shows that about 57 per cent of women were the main providers of childcare in 2016–17, against about 2.6 per cent of men. Just over 10 per cent of this differential is explained by differences in the employment status of parents (column 3), while individual characteristics hardly make a difference (column 2). The change brought about by the pandemic is striking, with about one‐fifth of fathers mainly in charge of childcare in May 2020, against a roughly unchanged proportion of mothers (column 1, panel B). With the adjustment to the lockdown, fathers seem to have taken over some of the childcare previously outsourced to the market or to extended family members, without directly biting into mothers' exclusive share of childcare.
TABLE 11.
Parent mainly in charge of childcare before and during the COVID‐19 pandemic
| (1) | (2) | (3) | (4) | (5) | |
|---|---|---|---|---|---|
| All | All | All | Males | Females | |
| Panel A: 2016–17 | |||||
| Female | 0.542*** (0.011) | 0.540*** (0.011) | 0.484*** (0.012) | ||
| Has children aged 0–4 | 0.052*** (0.013) | 0.053*** (0.013) | 0.008 (0.010) | 0.097*** (0.027) | |
| Not working (wave eight) | 0.189*** (0.018) | 0.114*** (0.027) | 0.217*** (0.025) | ||
| Not working (wave eight) (partner) | −0.104*** (0.013) | −0.025** (0.008) | −0.261*** (0.039) | ||
| Constant | 0.026*** (0.003) | 0.373*** (0.028) | 0.223*** (0.033) | 0.003 (0.015) | 0.574*** (0.054) |
| Observations | 5,892 | 5,892 | 5,397 | 2,596 | 2,801 |
| Panel B: April–May 2020 | |||||
| Female | 0.389*** (0.024) | 0.390*** (0.023) | 0.345*** (0.025) | ||
| Has children aged 0–4 | 0.011 (0.026) | −0.000 (0.026) | −0.004 (0.031) | 0.023 (0.040) | |
| Furloughed | 0.105*** (0.031) | 0.101* (0.040) | 0.120** (0.043) | ||
| Not working (Jan 2020) | 0.155*** (0.043) | 0.297** (0.090) | 0.120* (0.047) | ||
| Furloughed (partner) | −0.139*** (0.030) | −0.061 (0.038) | −0.226*** (0.046) | ||
| Not working (Jan 2020) (partner) | −0.133*** (0.034) | −0.105** (0.039) | −0.208* (0.088) | ||
| Constant | 0.198*** (0.021) | 0.177 (0.091) | 0.232** (0.087) | 0.293** (0.100) | 0.487*** (0.118) |
| Observations | 3,147 | 3,147 | 3,147 | 1,557 | 1,590 |
| Individual controls | No | Yes | Yes | Yes | Yes |
| Own job characteristics | No | No | Yes | Yes | Yes |
| Partner job characteristics | No | No | Yes | Yes | Yes |
Note: The dependent variable is equal to one if the respondent is the main childcare provider and zero otherwise, measured in USoc wave eight (panel A) and in the COVID‐19 study waves one and two (panel B). This information is elicited directly in USoc wave eight, while it is obtained from reported hours of childcare and home schooling in the COVID‐19 study. We define the main provider as: (a) mainly self, if the respondent does 60 per cent or more of the total reported childcare hours for the couple; (b) mainly partner, if the respondent does less than 40 per cent. In panel B, each individual contributes a number of observations equal to the number of COVID‐19 waves in which they participated. Individual controls include dummy variables for ages 20–29, 30–39, 40–49, 50–59, 60+ (16–19 is the excluded category) and dummy variables for GCSEs or equiv., A‐levels or equiv., and college education or higher. Own job characteristics include indicators for being employed, frequency of working from home dummies, two‐digit industry and occupation dummies. All job‐related dummies have an extra category for non‐employed individuals. Partner's job characteristics are only available for those whose partners gave a full interview. In panel B, all covariates refer to January 2020, except education, occupation and industry, which are imported from USoc wave nine (2017–18). All specifications control for an April wave dummy and use cross‐sectional weights. Standard errors are clustered at the individual level. * , ** , *** . The sample consists of individuals living in a couple, with children aged 15 and younger.
Source: USoc (waves eight and nine) and the COVID‐19 study (waves one and two).
This article is being made freely available through PubMed Central as part of the COVID-19 public health emergency response. It can be used for unrestricted research re-use and analysis in any form or by any means with acknowledgement of the original source, for the duration of the public health emergency.
While the best part of the additional childcare load has on average been taken over by mothers – largely according to pre‐existing specialisation patterns of spouses – the share of households in which the father is the main childcare provider has risen by nearly eight times from 2.6 per cent in 2016–17 to about 20 per cent in May 2020. Distributional aspects of increased childcare needs are thus important to understand changes in gender roles during the COVID‐19 pandemic. Gender differences in the role played by observable characteristics are also noteworthy. At baseline, both the presence of young children and the employment status of spouses has a much stronger impact on the likelihood that mothers are mainly in charge of childcare, as opposed to fathers. Such gender differences are milder during the COVID‐19 period and, in particular, being out of work is nudging fathers to be in charge of childcare more than mothers.
VI. Conclusion
The recession caused by the pandemic has produced unprecedented economic losses and it has become clear that its effects have exacerbated existing inequalities along a number of dimensions, most notably socio‐economic status and ethnicity, and have created new divides, for example between those who can work from home and those who cannot. Evidence on the gender dimension is somehow mixed. We find that, in what concerns the labour market, men and women experience similar employment losses or furloughing in the United Kingdom, although women suffer slightly smaller hour and earning losses overall. In the household, however, women provide on average about 60 per cent of increased childcare needs, implying a widening of pre‐existing inequalities of parental roles. As school and nursery closures are ongoing in a number of countries around the world, including the United States, women's increased care burden may build into longer‐lasting inequalities via reduced labour market involvement. In this respect, prioritising school openings over other sectors, subject to restrictions, and introducing subsidies for individuals with care responsibilities could help alleviate some of the gendered effects of COVID‐19.
Several of the effects discussed are temporary in nature and can in principle be reversed with the end of the restrictions and the restart of usual economic activity. However, given the recent radical changes to the organisation of work and family life, it is natural to reflect on the potential legacies of the crisis, via learning, habit formation and the evolution of social norms. First, the massive increase in the incidence of WFH has suddenly accelerated a pre‐existing but slowly evolving tendency towards smart working and flexible work arrangements. The number of people working from home in the United Kingdom has risen from 2.9 million in 1998 to 4.2 million in 2014, representing 14 per cent of employment, and an additional 1.8 million people report they would prefer to work from home if they were given the chance. According to a recent survey,14 86 per cent of UK managers foresee organisational barriers to the adoption of flexible working in their workplaces. But it is possible that some of the perceived barriers will be eventually cracked by actual remote work patterns implemented during the COVID‐19 pandemic. The demand for remote work varies across genders, with 48 per cent of women employed in jobs that can be done from home in the United Kingdom, compared with 39 per cent of men. Due to heavier household responsibilities, women also value flexible work schedules and shorter commutes more than men,15 and thus may be more beneficially affected by remote work opportunities. But while WFH may provide women with the flexibility to combine market work and family commitments, it may also dilute employee presence and attachment to the workplace, with possibly detrimental effects on career progression.
Second, the COVID‐19 crisis has witnessed the reversal of traditional gender roles in a sizeable share of UK households, in which fathers have taken the role of primary childcare providers. There is evidence that the spousal allocation of childcare is shaped in large part by social norms on gender roles, and that gender identity norms are only slowly evolving.16 But evidence has also shown that ‘forced’ changes in gender roles may have permanent consequences beyond short‐term circumstances, by accelerating the evolution of norms and eroding gender comparative advantages. For example, the mobilisation of men during the Second World War in the United States induced more women to enter the labour market, and thereby shaped the norms and preferences of younger generations who were exposed to those early labour market entrants.17 Relatedly, there is evidence that the introduction of fathers' quotas of parental leave has induced them to spend more time with their children in the longer run in some (though not all) contexts.18 One may therefore expect that the substantial redistribution of childcare involvement in nearly a fifth of UK households during the crisis may ease the breakdown of traditional gender roles come the recovery. We leave this analysis to future research.
Submitted September 2020.
The authors thank Abi Adams‐Prassl and Monica Costa Dias for helpful comments. This work has been supported by the Nuffield Foundation via the IFS Deaton Review, ‘Inequality in the Twenty‐First Century’ (reference WEL/43603).
Footnotes
Kleven, Landais and Sogaard, 2019.
This evidence was previously shown in Hupkau and Petrongolo (2020).
We classify industries as critical if they are mentioned in Cabinet Office and Department for Education (2020) and as shut‐down if they are mentioned in Cabinet Office and Ministry of Housing, Communities and Local Government (2020).
Dingel and Neiman (2020) use responses to O*NET surveys on work context and activities to classify six‐digit occupations into those that can be performed from home and those that cannot (binary classification). We map the resulting six‐digit O‐NET‐SOC2010 classification into the four‐digit UK SOC2010 classification available in the UK LFS based on a cross‐walk from six‐digit O‐NET‐SOC2010 to four‐digit US‐SOC2010 and finally to four‐digit UK‐SOC2010 occupations (369 categories). When a few six‐digit occupations feed into one four‐digit occupation, we classify the four‐digit occupation as doable from home if the majority of six‐digit occupations associated with it are classified as such. We manually re‐classify as doable from home a handful of managerial and technical four‐digit occupations (e.g. elected officers and representatives, financial administrative occupations); and we manually re‐classify as not doable from home about 30 miscellaneous occupations (a few occupations in public transport, a few care and service occupations, and a few technician occupations associated with workplaces, e.g. lab technicians). Overall, we estimate that 43 per cent of jobs in the United Kingdom can be done from home (based on LFS data for April–June 2019). Dingel and Neiman (2020) perform a similar exercise and obtain an estimate of 43.5 per cent for the United Kingdom, based on ILO data from 2018.
Institute for Social and Economic Research, 2020a, 2020b. This is available through the UK Data Service (SN8644).
For simplicity, we refer to the baseline period as January 2020.
Because the COVID‐19 study is treated as an instrument of the wave nine annual interview, respondents who did not complete a wave nine interview are assigned a zero weight. More information on how weights were developed can be found in Institute for Social and Economic Research (2020b).
Indeed, we found some of the results on gender differences to be sensitive to the use of weights (unweighted estimates not reported).
For comparison, ONS (2020b) estimates of UK employment based on the Quarterly Labour Force Survey show only slight variations in employment and unemployment rates between the first and second quarters of the year. Despite relatively flat unemployment figures, the number of people claiming benefits roughly doubled from 1.3 to 2.7 million between March and May 2020, corresponding to 3.5 and 7.4 of the workforce, respectively, in large part due to enhancements to Universal Credit coverage, which made a higher share of workers eligible for unemployment‐related benefits while still in work.
This provides grants to employers to pay 80 per cent wages to furloughed employees, up to a cap of £2,500 per person per month.
This overall picture is in contrast with corresponding evidence for the United States, where furloughing was much less prevalent and the overall employment rate fell by about 11 percentage points according to the Current Population Survey and by 19 percentage points according to the Real‐Time Population Survey (Bick and Blandin, 2020), where the difference between the two figures in large part accounts for the number of individuals who are employed but not at work in the reference week, and hence akin to being furloughed.
WFH variables refer to how often an individual was working from home in January 2020. While the frequency of WFH is directly related to the share of job tasks that can be performed remotely, it is also affected by other personal and workplace factors, so it is not directly comparable to the WFH definition that we have used to classify jobs in Figure 1. Unfortunately, the coarser occupational classification available in the USoc COVID‐19 study does not allow us to implement the Dingel and Neiman (2020) classification of jobs that can be performed from home.
CIPD, 2019.
Bertrand, 2018.
Fernández et al., 2004.
Contributor Information
Claudia Hupkau, Email: claudia.hupkau@cunef.edu.
Barbara Petrongolo, Email: barbara.petrongolo@economics.ox.ac.uk.
References
- Adams‐Prassl, A. , Boneva, T. , Golin, M. and Rauh, C. (2020), ‘Inequality in the impact of the coronavirus shock: evidence from real‐time surveys’, Journal of Public Economics, vol. 189, 104245. [Google Scholar]
- Alon, T. , Doepke, M. , Olmstead‐Rumsey, J. and Tertilt, M. (2020), ‘This time it's difference: the role of women's employment in a pandemic recession’, CEPR Discussion Paper No. 15149.
- Andrew, A. , Cattan, S. , Costa Dias, M. , Farquharson, C. and Krutikova, S. (2020), ‘The gendered division of paid and domestic work under lockdown’, IZA Discussion Paper No. 13500.
- Bertrand, M. (2018), ‘The glass ceiling’, Economica, vol. 85, pp. 205–31. [Google Scholar]
- Bick, A. and Blandin, A. (2020), ‘Real‐time labor market estimates during the 2020 coronavirus outbreak’, https://voxeu.org/article/real-time-labour-market-estimates-during-2020-coronavirus-outbreak.
- Blundell, R. , Costa‐Dias, M. , Joyce, R. and Xu, X. (2020), ‘COVID‐19 and inequalities’, Fiscal Studies, vol. 41, pp. 291–319. [DOI] [PMC free article] [PubMed] [Google Scholar]
- Cabinet Office and Department for Education (19 March 2020), ‘Critical workers who can access schools or educational settings’, https://www.gov.uk/government/publications/coronavirus-covid-19-maintaining-educational-provision.
- Cabinet Office and Ministry of Housing , Communities and Local Government (9 April 2020), ‘Closing certain businesses and venues’, https://www.gov.uk/government/publications/further-businesses-and-premises-to-close.
- CIPD (2019), ‘Megatrends: flexible working’, Technical report.
- Del Boca, D. , Oggero, N. , Profeta, P. and Rossi, M. (2020), ‘Women's work, housework and childcare, before and during COVID‐19’, Review of Economics of the Household. forthcoming. [DOI] [PMC free article] [PubMed] [Google Scholar]
- Dingel, J. and Neiman, B. (2020), ‘How many jobs can be done at home?’, Journal of Public Economics, vol. 189, 104235. [DOI] [PMC free article] [PubMed] [Google Scholar]
- Farré, L. , Fawaz, Y. , González, L. and Graves, J. (2020), ‘How the COVID‐19 lockdown affected gender inequality in paid and unpaid work in Spain’, IZA Discussion Paper No. 13434.
- Farré, L. and González, L. (2019), ‘Does paternity leave reduce fertility?’, Journal of Public Economics, vol. 172, pp. 52–66. [Google Scholar]
- Fernández, R. , Fogli, A. and Olivetti, C. (2004), Mothers and sons: preference formation and female labor force dynamics, Quarterly Journal of Economics, vol. 119, pp. 1249–99. [Google Scholar]
- Hupkau, C. and Petrongolo, B. (2020), ‘Work, care and gender during the Covid‐19 crisis’, CEP Covid‐19 analysis No. 002. [DOI] [PMC free article] [PubMed]
- Institute for Social and Economic Research (2020a), Understanding Society: COVID‐19 Study, SN: 8644, 10.5255/UKDA‐SN‐8644‐1 (1st edition), Essex: ISER, University of Essex. [Google Scholar]
- Institute for Social and Economic Research (2020b), Understanding Society COVID‐19 user guide, Technical report, Essex: ISER, University of Essex. [Google Scholar]
- Kleven, H. , Landais, C. and Sogaard, J. E. (2019), ‘Children and gender inequality: evidence from Denmark’, American Economic Journal: Applied Economics, vol. 37, pp. 181–209. [Google Scholar]
- LeBarbanchon, T. , Rathelot, R. and Roulet, A. (2020), ‘Gender differences in job search: trading off commute against wage’, CEPR Discussion Paper no. 15181.
- Mas, A. and Pallais, A. (2017), ‘Valuing alternative work arrangements’, American Economic Review, vol. 107, no. 12, pp. 3722–59. [Google Scholar]
- ONS (2020a), Coronavirus and the economic impacts on the UK: 18 june 2020, Technical report.
- ONS (2020b), Labour market overview, UK: August 2020, Technical report.
- Oreffice, S. and Quintana‐Domeque, C. (2020), ‘Gender inequality in COVID‐19 times: evidence from UK prolific participants, IZA Discussion Paper No. 13463.
- Patnaik, A. (2019), ‘Reserving time for daddy: the consequences of fathers’ quotas’, Journal of Labor Economics, vol. 11, pp. 1009–59. [Google Scholar]
- Sevilla, A. and Smith, S. (2020), ‘Baby steps: the gender division of childcare during the COVID‐19 pandemic’, IZA Discussion Paper No. 13302.