

Abstract
Introduction
Early diagnosis and identification of potential critical cases for timely treatment are crucial for COVID‐19 patients. The aim of this study was to analyze the diagnostic and prognostic implications of WBC and cell population data (CPD) abnormalities related to COVID‐19 at disease onset.
Methods
Baseline WBC counts and CPD data were analyzed in one hundred COVID‐19 patients presenting to emergency department and subsequently discharged (n=49), admitted (n=51) or deceased (n=22), and in 47 healthy subjects.
Results
Lymphopenia and eosinopenia were observed in all COVID‐19 patients, with more intensity in the admitted and deceased groups, that also presented increased WBC and neutrophil counts. On CPD analysis, COVID‐19 was associated with increased volume of neutrophils, lymphocytes, and monocytes, whereas conductivity was decreased for neutrophils and increased for lymphocytes. The ROC curve analysis showed good performance for lymphocyte counts in predicting COVID‐19 diagnosis (AUC=0.858), for neutrophil counts in predicting admission for COVID‐19 (AUC=0.744) and for monocytes volume in predicting COVID‐19 diagnosis (AUC=0.837).
Conclusion
WBC counts and CPD parameters at disease onset in COVID‐19 patients can improve diagnostic characterization and aid in the discrimination between severe and nonsevere presentations.
1. INTRODUCTION
Coronavirus disease 2019 (COVID‐19) is an ongoing global pandemic caused by severe acute respiratory syndrome coronavirus 2 (SARS‐CoV‐2) with a high mortality rate. The clinical spectrum ranges from asymptomatic or paucisymptomatic patients with flu‐like symptoms to a severe and rapidly progressive viral pneumonia with acute respiratory distress and multi‐organ failure. 1 , 2
Early diagnosis and identification of potential critical cases for timely treatment are crucial for COVID‐19 patients. However, at disease onset, the clinical picture may overlap with those of conventional viral and bacterial infections. 1 Moreover, not all suspected patients will have access to RT‐PCR for COVID‐19 or to readily accessible results.
Novel and easily obtainable parameters are needed to reinforce the likelihood of COVID‐19 diagnosis and identify patients who will suffer rapid disease progression and death. In this context, increased neutrophil counts and lymphopenia have been described in COVID‐19 patients, with implications toward a worse prognosis. However, these hematological abnormalities are rather imprecise as they may appear in other conventional infections. 3
Comprehensive cell population data (CPD) for subpopulations of WBC are possible with the automatic blood cell analyzer DxH800 (Coulter Inc), and this has been applied, for instance, to study WBC changes due to acute bacterial infections, G‐CSF administration, presence of CD34‐positive cells in peripheral blood, degeneration induced by storage and, recently, for COVID‐19 diagnostic workup. 4 , 5 , 6 , 7 , 8
The aim of this study was to analyze COVID‐19‐related abnormalities of WBC and CPD at disease onset, and identify parameters capable of discriminating between severe and nonsevere forms, as well as those with high or low risk of mortality.
2. METHODS
In this retrospective study, a total of 100 baseline samples from adult patients with COVID‐19 were analyzed. All patients presented to the emergency department (ED) mainly with fever and respiratory symptoms and the diagnosis was confirmed by RT‐PCR. After initial evaluation at ED, 49 patients were discharged as outpatients and 51 admitted. Seventy‐seven patients eventually recovered and 22 died from the disease. The control group consisted of 47 samples of healthy subjects with a normal CBC.
All samples were anticoagulated with K2EDTA (Sarstedt, S‐Monovette® 2.6mL K3E tubes). The CBC analysis was performed by the Unicel® DxH800 automated hematology analyzer (Beckman Coulter) to obtain WBC differential and leukocyte CPD with measurements of volume (VOL), conductivity (COND), and median angle light scatter laser (MALS) by the flow cytometry methodology.
WBC and CPD data were compared among four groups: control, COVID outpatient, COVID admitted, COVID deceased. Statistical analyses were conducted using Mann–Whitney's U test for differences. The receiver operator characteristic (ROC) curve on WBC and CPD parameters was used to predict both likelihood of COVID‐19 and severity of the disease in terms of area under the curve (AUC) along with the 95% confidence interval. All statistics were performed using SPSS software (version 11.5), and two‐tailed P values ≤ 0.05 were considered significant. The protocols of this study were performed in accordance with the ethical standards of the local institutional review board.
3. RESULTS
Baseline WBC and neutrophil counts were increased in patients subsequently admitted or deceased with COVID‐19. All COVID‐19 groups presented lower baseline counts of lymphocytes and eosinophils as compared to control group, but these counts were even lower in severe and fatal COVID‐19 groups (Table1).
Table 1.
WBC counts in control and COVID‐19 groups
| Control (n=47) | COVID outpatients (n=49) | COVID admitted (n=51) | COVID deceased (n=22) | |
|---|---|---|---|---|
| WBC (×109/L) | 6.96±1.65 | 7.06±3.36 | 10.21±5.62 * , ** | 10.78±6.9 * , ** |
| Neutrophils (×109/L) | 4.36±1.23 | 5.12±3.10 | 8.71±5.24 * , ** | 9.35±6.4 * , ** |
| Lymphocytes (×109/L) | 1.90±0.43 | 1.34±0.70* | 0.91±0.47 * , ** | 0.90±0.62 * , ** |
| Monocytes (×109/L) | 0.57±0.18 | 0.57±0.30 | 0.55±0.35 | 0.48±0.33 |
| Eosinophils (×109/L) | 0.18±0.16 | 0.05±0.07* | 0.22±0.37 * , ** | 0.13±0.24 * , ** |
| Basophils (×109/L) | 0.32±0.47 | 0.03±0.02 | 0.30±0.28 | 0.25±0.23 |
P<.01 vs control.
P<.05 vs COVID outpatients.
Cell population data analysis of WBC detected changes in volume and conductivity of neutrophils and lymphocytes, and in volume of monocytes of COVID‐19 patients. Among COVID‐19 groups, neutrophils volume was higher in deceased patients (Figure1).
Figure 1.
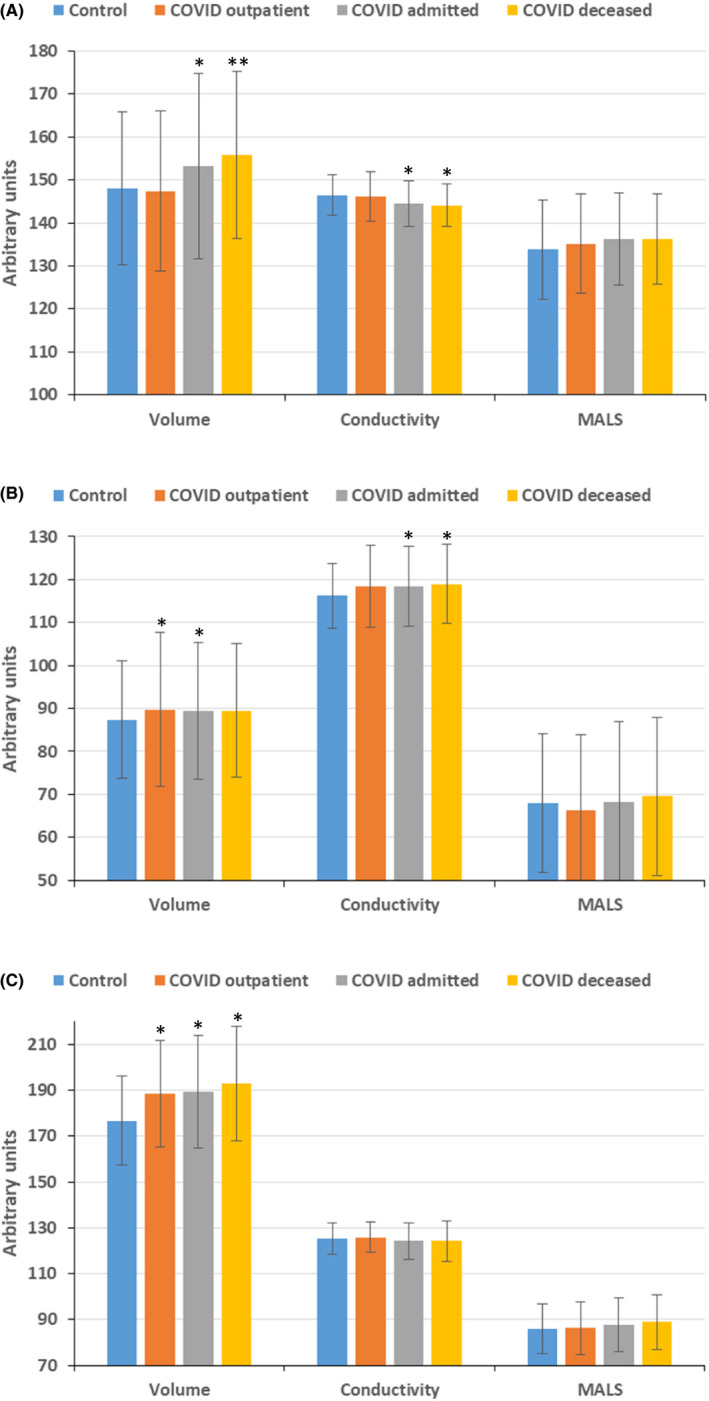
Cell population data of neutrophils (A), lymphocytes (B) and monocytes (C) in control and COVID groups. MALS, median angle light scatter. *P<.05 vs control group; **P<.05 vs control, COVID outpatient and COVID admitted groups [Colour figure can be viewed at wileyonlinelibrary.com]
The ROC curve analysis showed that the AUC for lymphocyte counts in predicting COVID‐19 diagnosis was 0.858 (P<.001), with a sensitivity of 81% and specificity of 80% for counts below 1.6×10⁹/dL (Figure2A). The AUC for neutrophil counts in predicting admission for COVID‐19 was 0.744 (P<.001), with a sensitivity of 69% and specificity of 71% for counts above 5.6×10⁹/dL (Figure2B). Among CPD parameters, monocytes volume showed good performance in predicting COVID‐19 diagnosis with an AUC of 0.837 (P<.001) and sensitivity of 70% and specificity of 90% for counts above 183 arbitrary units (Figure2C).
Figure 2.
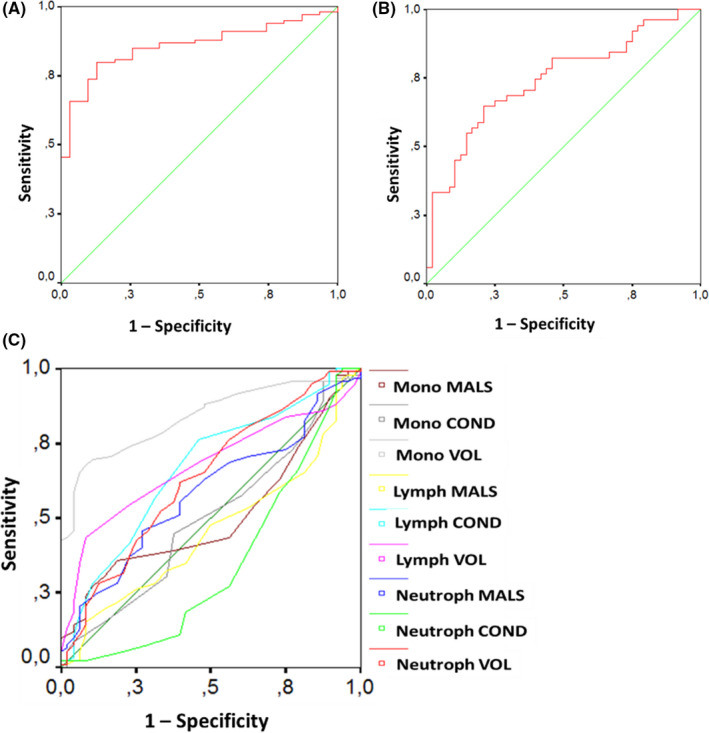
ROC curve analysis comparing performance of: (A) lymphocyte counts in discriminating COVID‐19 from non‐COVID‐19 subjects, (B) neutrophil counts in predicting admission of COVID‐19 patients, and (C) cell population data (CPD) data in discriminating COVID‐19 from non‐COVID‐19 subjects [Colour figure can be viewed at wileyonlinelibrary.com]
4. DISCUSSION
On practical grounds, the need for reliable and readily accessible biomarkers of COVID‐19 is warranted to decide whether to promptly isolate a patient and initiate specific therapies while waiting for confirmatory test results. In this study, we identified easily accessible WBC and CPD parameters that could be used both as diagnostic and prognostic markers at onset of COVID‐19.
In regard to WBC counts, lymphopenia and eosinopenia were consistently observed in COVID‐19 patients, with an intensity that paralleled disease severity. This aids in distinguishing this condition from conventional viral infections, where the proportion of lymphocytes is usually increased, and eosinopenia is uncommon. 9 Similar to COVID‐19, patients with pneumonia due to influenza A/H1N1 virus infection often present with absolute lymphopenia, but monocyte counts are usually increased. 10 , 11 The underlying mechanisms of lymphopenia in COVID‐19 are not well known. Possible explanations rely on abnormal hematopoiesis following direct infection of bone marrow precursors, infection of CD4 and CD8 cells, or an auto‐immune response against blood cells. 12 It has been further hypothesized that survival may be dependent on ability to replenish lymphocytes, mainly CD4, which are killed by the virus. 13
Patients with COVID‐19 have lower WBC and neutrophil levels than those with community‐acquired pneumonia. However, in our study and others, a mild increase in baseline neutrophil counts, from 5.6×10⁹/dL, could predict an increased risk of admission. 13 , 14 This may build up with currently reported biomarkers of disease severity such as WBC and lymphocyte counts, IL‐6 and IL‐10. 15 , 16
Changes in CPD parameters, such as increased neutrophils, monocytes, and lymphocytes volumes, have been described in sepsis and bacteremic patients, alluding to the fact that volumetric changes are an early manifestation of immune cell responses to severe infections.. 4 , 17 , 18 Increased monocyte distribution width (MDW)—previously deployed for early detection of sepsis—also showed high sensitivity (AUC of 0.91) to detect COVID‐19. 19 Recently, Vasse et al 8 built a discriminating protocol based on four monocyte CPD parameters, provided by the DxH800 analyzer, to identify possible SARS‐CoV‐2 infection with a specificity of 89% and sensitivity of 60%, which was comparable to RT‐PCR. Here, we showed that increased monocytes volume was a reliable diagnostic marker of COVID‐19, regardless of disease severity. The satisfactory performance of this CPD parameter might be related to an acute increase in circulating monocytes size, as these cells are first responders to infections after initial exposure to pathogens. 17
One study showed that CPD parameters for neutrophils were similar among healthy subjects and suspected patients that tested negative or positive for COVID‐19. 8 Accordingly, in our study, CPD parameters for neutrophils were similar between controls and COVID‐19 outpatients at disease onset. However, the subset of patients with severe and fatal disease presented with increased volume and decreased conductivity of neutrophils as well as increased conductivity of lymphocytes. These simple and novel parameters could be used for early recognition and proper clinical management of potentially severe cases.
According to recent reports, the CPD changes observed at disease onset in severe as compared to mild forms of COVID‐19 can be explained by dysregulated expression of cytokines, mainly IL‐6 and IL‐10, and aberrant increase of pathological low‐density neutrophils and the upregulation of genes involved in lymphocyte cell death pathway, caused by the mechanism of SARS‐CoV2 infection. 12 , 20 Increased neutrophils conductivity, in particular, favors COVID‐19 in comparison with conventional viral infections, where the levels are usually reduced.
In conclusion, baseline WBC counts and CPD parameters in COVID‐19 patients can improve diagnostic characterization and aid in the discrimination between severe and nonsevere presentations. Our results emphasize the need of further efforts to develop accurate admission algorithms to better assist COVID‐19 patients.
CONFLICT OF INTEREST
The authors have no competing interests.
AUTHOR CONTRIBUTIONS
FAN and MGLO conceived and designed the research; ALZR, FHOM, THGB and VH collected and analyzed research data; FAN performed statistical analyses; FAN wrote and edited the manuscript; and all authors reviewed the final version of the manuscript.
Naoum FA, Ruiz ALZ, Martin FHDO, Brito THG, Hassem V, Oliveira MGDL. Diagnostic and prognostic utility of WBC counts and cell population data in patients with COVID‐19. Int J Lab Hematol.2021;43:124–128. 10.1111/ijlh.13395
DATA AVAILABILITY STATEMENT
The data that support the findings of this study are available from the corresponding author upon reasonable request.
References
- 1. World Health Organization . Clinical management of COVID‐19: interim guidance. 27 May 2020.
- 2. Wu Z, McGoogan JM. Characteristics of and important lessons from the coronavirus disease 2019 (COVID‐19) outbreak in China: summary of a report of 72314 cases from the Chinese center for disease control and prevention. JAMA. 2020;323:1239. [DOI] [PubMed] [Google Scholar]
- 3. Jung YJ, Kim JOHN, Park YJ, et al. Evaluation of cell population data on the UniCel DxH 800 coulter cellular analysis system as a screening for viral infection in children. Int J Lab Hematol. 2012;34(3):283-289. [DOI] [PubMed] [Google Scholar]
- 4. Chaves F, Tierno B, Xu D. Quantitative determination of neutrophil VCS parameters by the Coulter automated hematology analyzer: new and reliable indicators for acute bacterial infection. Am J Clin Pathol. 2005;124(3):440-444. [DOI] [PubMed] [Google Scholar]
- 5. Lee SE, Lim J, Kim Y, Min WS, Han K. Leukocyte cell population analysis from the coulter automatic blood cell analyzer DxH800 to monitor the effect of G-CSF. J Clin Lab Anal. 2012;26(3):194-199. [DOI] [PMC free article] [PubMed] [Google Scholar]
- 6. Shin S, Cho SR, Kim S, Choi JR, Lee KA. Identification of cell morphology parameters from automatic hematology analyzers to predict the peripheral blood CD34-positive cell count after mobilization. PLoS One. 2017;12:e0174286. [DOI] [PMC free article] [PubMed] [Google Scholar]
- 7. Naoum FA, Martin FHO, Valejo MR, Oliveira MGL. Assessment of time-dependent white blood cells degeneration induced by blood storage on automated parameters and morphology examination. Int J Lab Hematol. 2020;42(4):e185-e188. [DOI] [PubMed] [Google Scholar]
- 8. Sukhachev D, Delcominette F, Habarou F, Jolly E, Sukhacheva E, Pascreau T, Farfour E. Interest of the cellular population data analysis as an aid in the early diagnosis of SARS-CoV-2 infection. International Journal of Laboratory Hematology. 2020. 10.1111/ijlh.13312 [DOI] [PMC free article] [PubMed] [Google Scholar]
- 9. Tanni F, Akker E, Zaman MM, Figueroa N, Tharian B, Hupart KH. Eosinopenia and COVID‐19. J Am Osteopath Assoc. 2020;120(8):504–508. [DOI] [PubMed] [Google Scholar]
- 10. Cheng Y, Zhao H, Song P, Zhang Z, Chen J, Zhou YH. Dynamic changes of lymphocyte counts in adult patients with severe pandemic H1N1 influenza A. J Infect Public Health. 2019;12(6):878-883. [DOI] [PMC free article] [PubMed] [Google Scholar]
- 11. Merekoulias G, Alexopoulos EC, Belezos T, Panagiotopoulou E, Jelastopulu DM. Lymphocyte to monocyte ratio as a screening tool for influenza. PLoS Curr. 2010;2:RRN1154. [DOI] [PMC free article] [PubMed] [Google Scholar]
- 12. Ponti G, Maccaferri M, Ruini C, Tomasi A, Ozben T. Biomarkers associated with COVID‐19 disease progression. Crit Rev Clin Lab Sci. 2020;57(6):389-399. [DOI] [PMC free article] [PubMed] [Google Scholar]
- 13. Henry BM. COVID‐19, ECMO, and lymphopenia: a word of caution. Lancet Respir Med. 2020;8(4):e24. [DOI] [PMC free article] [PubMed] [Google Scholar]
- 14. Zheng Y, Xu H, Yang M, et al. Epidemiological characteristics and clinical features of 32 critical and 67 noncritical cases of COVID‐19 in Chengdu. J Clin Virol. 2020;127:104366. [DOI] [PMC free article] [PubMed] [Google Scholar]
- 15. Ruan Q, Yang K, Wang W, Jiang L, Song J. Clinical predictors of mortality due to COVID‐19 based on an analysis of data of 150 patients from Wuhan, China. Intensive Care Med. 2020;46(5):846-848. [DOI] [PMC free article] [PubMed] [Google Scholar]
- 16. Liu J, Li S, Liu J, et al. Longitudinal characteristics of lymphocyte responses and cytokine profiles in the peripheral blood of SARS-CoV-2 infected patients. EBioMedicine. 2020;55:102763. [DOI] [PMC free article] [PubMed] [Google Scholar]
- 17. Crouser ED, Parrillo JE, Seymour C, et al. Improved early detection of sepsis in the ED with a novel monocyte distribution width biomarker. Chest. 2017;152(3):518-526. [DOI] [PMC free article] [PubMed] [Google Scholar]
- 18. Chaves F, Tierno B, Xu D. Neutrophil volume distribution width: a new automated hematologic parameter for acute infection. Arch Pathol Lab Med. 2006;130(3):378-380. [DOI] [PubMed] [Google Scholar]
- 19. Ognibene A, Lorubbio M, Magliocca P, et al. Elevated monocyte distribution width in COVID‐19 patients: the contribution of the novel sepsis indicator. Clin Chim Acta. 2020;509:22-24. [DOI] [PMC free article] [PubMed] [Google Scholar]
- 20. Yan Q, Li P, Ye X, et al. Longitudinal peripheral blood transcriptional analysis of COVID‐19 patients captures disease progression and reveals potential biomarkers. medRxiv. 2020. [Google Scholar]
Associated Data
This section collects any data citations, data availability statements, or supplementary materials included in this article.
Data Availability Statement
The data that support the findings of this study are available from the corresponding author upon reasonable request.