

Abstract
Large in‐person gatherings of travelers who do not socially distance are classified as the “highest risk” for COVID‐19 spread by the Centers for Disease Control and Prevention (CDC). From August 7–16, 2020, nearly 500,000 motorcycle enthusiasts converged on Sturgis, South Dakota for its annual rally in an environment without mask‐wearing requirements or other mitigating policies. This study is the first to explore this event's public health impacts. First, using anonymized cell phone data, we document that foot traffic at restaurants/bars, retail establishments, and entertainment venues rose substantially at event locations. Stay‐at‐home behavior among local residents fell. Second, using a synthetic control approach, we find that the COVID‐19 case rate increased substantially in Meade County and in the state of South Dakota in the month following the Rally. Finally, using a difference‐in‐differences model to assess nationwide spread, we find that following the Sturgis event, counties outside of South Dakota that contributed the highest inflows of rally attendees experienced a 6.4–12.5% increase in COVID‐19 cases relative to counties without inflows. Our findings highlight that local policy decisions assessing the tradeoff between local economic benefits and COVID‐19 health costs will not be socially optimal in the presence of large contagion externalities.
Keywords: COVID‐19, large outdoor gathering, social distancing, Sturgis Motorcycle Rally
1. INTRODUCTION
“Now we're all here together tonight. And we're being human once again. F*ck that Covid sh*t.”
Smash Mouth Lead Vocalist Steve Harwell, 2020 Sturgis Concert
Restrictions on large gatherings were a near universal policy adopted by U.S. states following the initial U.S. coronavirus outbreak (McKinley and Gold, 2020). As of August 29, 2020, when all states that had forced businesses closed had at least partially reopened (Lee et al., 2020), 29 states continued to ban gatherings of groups of over 50 individuals (North Star Meeting Group, 2020), a reflection, in part, of the resurgence of COVID‐19 in the United States beginning in June 2020.
Restrictions on large gatherings during a pandemic are a form of government regulation of quantity within a market to curb a negative externality. In that way, gathering restrictions are similar to public smoking bans, chemical emission standards, or vaccination mandates. 1 In this case, the negative externality is due to infection risk, so the blanket nature of a gathering restriction is a key part of the containment strategy as a single mass gathering has the potential to generate a large number of cases, a phenomenon referred to as a “superspreading event.”
Indeed, the Centers for Disease Control and Prevention (CDC) deems “large in‐person gatherings where it is difficult for individuals to remain spaced at least 6 feet apart and attendees travel from outside the local area” among the highest risk activities for the spread of COVID‐19 (CDC, 2020). The risk of contagion of COVID‐19 is exacerbated at such events if (a) there are high frequency, prolonged interactions between individuals, and (b) pre‐event COVID‐19 case growth in the county hosting the event is elevated (CDC, 2020).
Even though large gathering restrictions have become ubiquitous, with high profile events such as the 2020 Olympics postponed and the 2020 Umrah Pilgrimage suspended (Ebrahim and Memish, 2020), there is little empirical evidence on the contagion dangers of large events with “superspreader” potential. Most evidence in support of gathering restrictions has centered around theoretical models of the spread of disease. 2 Studies that have empirically examined the impact of state and local bans on large gatherings have found no evidence that they impact COVID‐19 case growth (Courtemanche et al., 2020a; 2020b). However, it is unclear whether this result is due to the voluntary canceling of large events, making these legal restrictions largely nonbinding, or if large gatherings were not as risky as feared by public health experts.
A small literature has emerged showing rises in local COVID‐19 infections from events such as college students returning from spring break (Mangrum and Niekamp, 2020), in‐person primary voting (Cotti et al., 2020), and indoor sporting events (Ahammer et al., 2020; Wing et al., 2020). Other work has shown that certain high‐profile mass gatherings did not exhibit noticeable increases in COVID‐19 cases when avoidance behavior was detected in the local population (Dave et al., 2020a; 2020b).
In this study we examine the 80th Annual Sturgis Motorcycle Rally, a 10‐day event with dozens of concerts, live performances, races, and bike shows that drew over 460,000 individuals to a city with a population of approximately 7,000 located in a county with a population of approximately 26,000 (Maxouris, 2020; South Dakota Department of Transportation, 2020; Yost, 2020). COVID‐19 mitigation efforts at the Sturgis Rally were largely left to the “personal responsibility” of attendees (Knowles and Lati, 2020), and postopening day media reports suggest that social distancing and mask‐wearing were quite rare in Sturgis (Orecchio‐Egresitz, 2020; Porterfield, 2020; Groves, 2020a; 2020b; 2020c; Walker, 2020a; 2020b; 2020c). 3
The Sturgis Motorcycle Rally represents a situation where many of the “worst case scenarios” for superspreading occurred simultaneously: the event was prolonged, included individuals packed closely together, involved a large out‐of‐town population (a population that was orders of magnitude larger than the local population), and had low compliance with recommended infection countermeasures such as the use of masks. The only large factors working to prevent the spread of infection were the outdoor venue and low population density in the state of South Dakota.
We document three key results. First, using anonymized smartphone data from SafeGraph, Inc., we demonstrate that nonresident cell phone pings rose in the census block groups where the Sturgis events look place over the 10‐day period of the rally relative to other census block groups within South Dakota and in border states to South Dakota. Furthermore, we find that foot traffic at restaurants and bars, hotels, entertainment venues, and retail establishments in CBGs hosting Sturgis Rally events rose by up to 90% during the event, relative to nearby CBGs. Second, we find that stay‐at‐home behavior declined among residents of Meade County We find that the Sturgis Rally event was associated with a 9.4 to 10.9% decline in median hours spent at home. Finally, turning to COVID‐19 case data from the CDC, we find that the Sturgis Rally caused spread of COVID‐19 cases both locally and in the home counties of those who traveled to the Sturgis Rally and returned home.
Using a synthetic control approach, we find that the Sturgis event increased COVID‐19 cases in Meade County by 6.3 to 6.9 cases per 1,000 population as of September 2, 2020, a month following the onset of events at the Sturgis Rally. For the state of South Dakota as a whole we find that the Sturgis event increased COVID‐19 cases by 3.6 to 3.9 cases per 1,000 population as of September 2, 2020. This represents an increase of over 35% relative to the 9.7 cases per 1,000 population in South Dakota on July 31, 2020 (South Dakota Department of Health, 2020).
Then, using a dose response difference‐in‐differences model, we find that counties that contributed the highest inflows of Sturgis attendees saw COVID‐19 cases rise by 6.4 to 12.5% following the Sturgis event relative to counties without any detected attendees. Descriptive evidence suggests some evidence of variation in local COVID‐19 spread depending on the stringency of local contagion mitigation policies. We conclude that the Sturgis Motorcycle Rally generated substantial public health costs, which may range from $3.8 and $8.7 billion using the statistical value of a median COVID‐19 case estimated by Kniesner and Sullivan (2020). While we note that this ballpark estimate captures the full costs of infections due to the Sturgis rally—and is an overestimate of the externality cost because this number includes COVID‐19 infections to individuals who attended the rally (and may have internalized private health risks)—we nonetheless conclude that local and nationwide contagion from this event was substantial. Our findings underscore that local COVID‐19‐related policy decisions over events that generate large local economic benefits, but diffuse external health costs (such as the decision by South Dakota policy officials to hold the Sturgis event) may not be socially optimal.
2. BACKGROUND
2.1. COVID‐19 in South Dakota
With a population of approximately 900,000 and covering an area of over 77,000 mile2, South Dakota is one of the least densely populated states in the country, ranking 46 out of 51 states, including the District of Columbia (World Population Review, 2020). Many public health experts have credited the “natural social distancing” of low population density as an important driver of low infection rates in the state (Bottum, 2020; Pereira, 2020). As of July 31, 2020, a week prior to the official Sturgis festivities, there were 8,764 reported cases of COVID‐19 in South Dakota (or approximately 9.7 cases per 1,000 population), as well as 824 hospitalizations, and 130 deaths (South Dakota Department of Health, 2020; The Brookings Register, 2020; The New York Times, 2020). Meade County, where most of Sturgis's activities took place, reported less than 1% (71 cases) of the state's cases as of July 31, 2020 (Matthews, 2020; South Dakota Department of Health, 2020).
South Dakota's public health response to the novel coronavirus outbreak has largely been a hands‐off approach, centered around private personal responsibility (Pereira, 2020). South Dakota was one of 8 states to never issue a statewide shelter‐in‐place order or a safer‐at‐home order (Mervosh et al., 2020; Secon, 2020). A recent assessment found South Dakota to have the least restrictive COVID‐19 policy environment when assessing mask wearing mandates (none), travel restrictions (none), large gathering restrictions (none), statewide school restarts (district‐level decisions), reopening of bars and restaurants (full indoor‐dining permitted), work‐from‐home requirements (none), and temperature screenings (not required) (McCann, 2020; Shammas, 2020; South Dakota's Back to Normal Plan, 2020).
2.2. The 2020 Sturgis Motorcycle Rally
As planning for the 80th Annual Sturgis Motorcycle Rally began in Spring 2020, many public health officials argued for its postponement or cancellation given that it was set to occur in the middle of a worldwide pandemic.
Public health authorities, however, view [the Sturgis Rally] as a potential petri dish for the spread of COVID‐19…That's got Minnesota health leaders worried about the disease making its way back here. “We are concerned with any large gathering, sustained contact of that nature,” Minnesota Health Commissioner Jan Malcolm told reporters Monday, calling the rally “sort of a recipe for something to happen.” (MPR News Staff, 2020)
However, a lack of lockdown measures in South Dakota, along with no maximum gathering crowd limit or mask‐wearing requirement, made it quite difficult for the city to prevent the event from occurring (Blistein, 2020). Furthermore, when the Sturgis City Council consulted the state government on their ability to restrict or revoke camping permits of nearby campgrounds, where the majority of attendees stay (Blistein, 2020), 4 they were quickly denied (Blistein, 2020). 5 So, in April 2020, the Sturgis City Manager and the City Council, concluding that individuals would still travel to Sturgis in large numbers if the event were canceled, allowed the event to go forward with minimal changes (Ainslie, 2020; Bonnet, 2020b; 2020c).
To prepare for the influx of people arriving in the small town, the City of Sturgis tested all Rally workers and emergency responders for COVID‐19 and performed daily health screenings on such personnel (Blistein, 2020; James, 2020). The city stocked personal protective equipment (PPE), offered PPE supplies to local businesses in need, sanitized restroom stations and sidewalks, and placed hand sanitizer dispensers in public locations throughout the city (Blistein, 2020; Ainslie, 2020a). Moreover, hospital staging was increased, and a mandate was issued that would expand local intensive care units (ICUs) to include 500 more beds within 48 hr if necessary (Blistein, 2020; James 2020). The City announced that following the conclusion of the rally, residents and local businessowners would be assured access to low‐cost testing (Ainslie, 2020b).
The Sturgis Motorcycle Rally was held over a 10‐day period from August 7 through August 16, 2020, with pre‐Rally events beginning on August 3. Estimated attendance was 462,182 (South Dakota Department of Transportation, 2020). The Rally included rides and races (drag, motocross, motorcycle), bike shows, poker tournaments, boxing matches, exhibitions, contests, vendors (tattoo artists, rally merchandise, bike washes, apparel), and music events (concerts, disk jockeys, dancers).
Over 30 entertainment groups performed concerts or held events at over the course of the 2‐week period (80th Sturgis Rally Events Schedule, 2020; City of Sturgis Motorcycle Rally Concerts, 2020). Venues were both indoor and outdoor, located within Meade County, and included bars on the Main Street of Sturgis to campgrounds outside of city limits, most notably Buffalo Chip. Beginning on August 3, Buffalo Chip held dozens of events every day through the 16, including a headlining performance by musical group Smash Mouth (2020 Sturgis Buffalo Chip Schedule). Masks were required for the backstage crew during concerts, but attendees were only required to have mask in their possession to be permitted to enter (Blistein, 2020). Bars and restaurants remained fully open, including for indoor dining, with some businessowners reporting remaining open 24 hr per day to cater to attendees (Thorson, 2020). Moreover, liquor store sales in Sturgis were up 27% from the prior year, which could be representative of a less risk‐averse population of attendees given that attendance was down roughly 7.5% from the prior year (Bonnet, 2020b; 2020c).
Following the event, public health officials expressed concern about the likely effects of the event, not only in Sturgis and its environs, but also in the residential counties of those who attended the event (Knowles, 2020; Moini, 2020). Despite widespread speculation by policymakers and public health officials (Associated Press, 2020; Beer, 2020; Groves, 2020a; 2020b; 2020c; Whateley, 2020), no study has yet explored the impacts of this very large public gathering during the COVID‐19 pandemic. 6
3. DATA
3.1. Anonymized cellphone data
We begin our analysis using anonymized cellphone data provided by SafeGraph Inc. from July 6, 2020 through August 30, 2020, a period that envelopes the Sturgis Rally. 7 SafeGraph provides census‐block‐group‐level data from 45 million anonymized cell phones that allow us to measure the residence of individuals and the jurisdictions to which they travel. These data have been used widely by scholars examining the impact of COVID‐19 mitigation policies (Abouk and Heydari, 2020; Friedson et al., 2020; Lasry et al., 2020; Dave et al., 2020a; 2020b; 2020c) and large gatherings (Dave et al. 2020d,e) on stay‐at‐home behavior. These data have been used commonly by the CDC and other researchers to study social distancing behavior during the COVID‐19 epidemic in the United States.
The SafeGraph data define a person's “home” as a 153‐by‐153‐m area in a common night‐time location that receives the largest number of GPS pings during the hours of 6 p.m. through 7 a.m. An individual's “movement” is measured from a cellphone once a person leaves their home. 8 For the purposes of our study, we use the SafeGraph data to (a) measure the number of nonresident visitors to the census block groups (CBGs) where Sturgis Motorcycle Rally events took place, (b) trace those attendees back to their home counties, and (c) measure stay‐at‐home behavior among residents of Meade County (where the Sturgis Rally, in the main, took place) as well as border counties, so as to examine compensatory risk avoidance behavior by those who are local to the area.
First, we measure the natural log of the number of nonresident visitors in the census block groups (CBGs) where the Sturgis Rally took place and bordering CBGs (Census Bureau Geocoder, 2020). CBGs were identified as treated if they held (7 CBGs) or bordered (19 CBGs) a documented Sturgis event or vendor location, as listed on an official Sturgis Rally or Sturgis Rally‐affiliated website between August 3 and 16 (City of Sturgis 80th Motorcycle Rally 2020; Rally Sturgis, 2020; Sturgis 2020). 9 We also account for temporal variation across these CBGs, accounting for the days when particular events were held. “Treatment” CBGs were largely located within Meade County, mostly in the city of Sturgis, though some expand into Lawrence and Pennington County, which are border counties to Meade.
Relative to the 2‐week period from July 6 through July 19, the number of nonresident pings in the “Sturgis treatment CBGs” rose by 92.5% from August 3 and August 16, peaking on Saturday, August 8, the date of the Smash Mouth concert. Appendix Figure 1 compares the number of nonresident pings in the treatment CBGs and all other CBGS (“controls”) in the state of South Dakota. These patterns suggest that travel into the treatment regions increased substantially relative to the controls.
In Figure 1, we present a map of home counties of individuals (who do not reside in the treatment CBGs) who visited the CBGs where Sturgis Rally events took place between August 3 and August 16. Panel (a) shows the intensity of inflows into Sturgis (during the treatment period) net of usual inflows during a prior 2‐week period (from July 6 to July 19). We explore five categories of inflows: High, Moderate‐High, Moderate, Moderate‐Low, and Low. 10 As illustrated, the Rally drew attendees from all over the United States. Moreover, while a number of high inflow counties were found within South Dakota and its border states, a number of counties from other states, including Arizona, California, Colorado, Minnesota, Nevada, and Washington, contributed larger numbers of smartphone pings.
FIGURE 1.
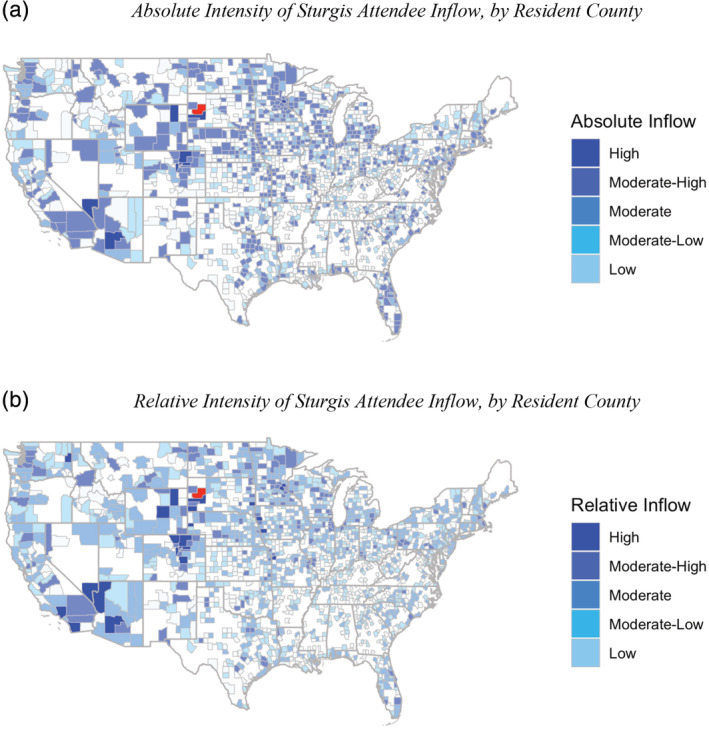
Distribution of inflows into Sturgis Motorcycle Rally. (a) Absolute intensity of Sturgis attendee inflow, by Resident County. (b) Relative intensity of Sturgis attendee inflow, by Resident County [Color figure can be viewed at wileyonlinelibrary.com]
We find that event attendees were not primarily concentrated in the event county or its environs. Only 0.9% of nonresident pings at the Sturgis Motorcycle Rally CBGs came from Meade county. A further 8.5% of nonresident pings came from other counties outside of Meade County within South Dakota. But a full 90.7% came from outside the state of South Dakota, 18.6% from border states and 72.1% from the remainder of the country.
In Panel (b) of Figure 1, we show an alternative measure of inflows: the ratio of the home county‐specific number of smartphone pings in the Sturgis treatment CBGs between August 3 and 16 and the average number of resident pings over the sample window. This measure (a) better controls for county population size (to ensure high inflows do not simply capture large populations), and (b) accounts for resident smartphone coverage in the SafeGraph data. In the main, the pattern of high inflow counties looks quite similar. 11
Next, to capture increased presence in Sturgis at the time of the rally, we use foot traffic data, also available from SafeGraph, Inc. These data track hourly aggregated foot traffic to millions of points of interest across the United States. In order to categorize each individual point of interest, SafeGraph, Inc. includes industry‐specific National American Industry Classification System (NAICS) codes.
We construct six measures from these NAICS codes, including dining establishments, comprised of restaurants and bars (7225 and 7224, respectively), and retail, which combines both essential and nonessential businesses, including industries such as grocery stores (4451) and pharmacies (446110), liquor stores (4453), gas stations (4471), and clothing merchandisers (4481). Entertainment establishments are aggregated into one measure, including spectator sports arenas (7112), amusement parks and arcades (7131), and gambling venues (7131). We also consider two measures of lodging, hotels (7211) and campgrounds (721211 and 721214). Foot traffic for each category of industry is then aggregated to the day‐by‐census block group level.
In addition to tracking behavior of rally attendees, we also measure stay‐at‐home behavior of residents of Meade County and its environs in order to detect any potential compensatory or avoidance behaviors on the part of the local residents. We generate two measures from the SafeGraph data: (a) Full‐Time Stay‐at‐Home, which measures the mean percent of individuals who spend the entire day at home, and (b) Median Hours at Home, which captures the intensive margin of stay‐at‐home behavior, the median number of hours that the respondent is recorded as being at his/her residence. Each of these measures is generated for three jurisdictions: Meade County, Meade County and its border counties (Perkins County, Ziebach County, Haakon County, Pennington County, Lawrence County, and Butte County), and the state of South Dakota. In Meade County, we document that in the week prior to the Sturgis event, residents remained at home for a median of 10.1 hr. During the Sturgis Rally period (August 3 through August 16), this number decreased to 8.8 hr.
3.2. COVID‐19 cases
We measure county‐level cumulative COVID‐19 cases using state and county‐level data collected from state and local health agencies by the New York Times. 12 COVID‐19 cases are analyzed over the period from June 6, 2020 through September 2, 2020. During this time frame, the mean number of cumulative COVID‐19 cases per 1,000 population was 3.83 in Meade County. There was one recorded COVID‐19 death over this period in the county which hosted the event; given the relatively low level of mortality before, during and after the Sturgis event, and the longer lag time for potential effects on COVID‐related deaths to materialize, we mainly focus on cases for our short‐to‐medium run analyses.
In Appendix Figure 2, we display the trends in COVID‐19 cases per 1,000 population in the state of South Dakota, Meade County, and in Meade County and its border counties. We find that Meade County had a similar COVID‐19 case rate to the state of South Dakota. However, in the latter part of the sample period (post‐Sturgis), the growth rate is notably faster in Meade County. COVID‐19 cases also grew more rapidly in South Dakota and “Meade County and Border Counties” in the post‐Sturgis (post‐August 16) period. However, the rate of growth appears fastest in Meade, particularly after a week following the close of the Sturgis Rally.
4. EMPIRICAL APPROACH
4.1. Effect of Sturgis rally on nonresident travel and foot traffic in Sturgis
We begin by estimating the effect of the Sturgis Motorcycle Rally on nonresident cell phone pings in the CBGs where the Sturgis events took place. 13 We pool 10,411 CBGs in South Dakota and its border states across 56 days and estimate the following difference‐in‐differences specification 14 :
| (1) |
where Y gcst measures the inverse hyperbolic sine of (a) the number of nonresident GPS pings in census block group g in county c in state s on day t, (b) foot traffic in restaurants and bars, retail, entertainment, hotels, and campgrounds in census block group g in county c in state s on day t 15 ; Sturgis gt is a treatment measure that “turns on” when an event occurs in the CBG at the Sturgis Event, Temp ct is a measure of the average temperature (in degrees Celsius) in county c on day t, Precip ct is a dichotomous variable capturing whether measurable rainfall occurred that day, 16 X st is a vector of state‐specific time‐varying controls, including state reopening policies for personal care services, gyms, entertainment centers, and restaurants/bars, the presence of a mask‐wearing mandate, and the COVID‐19 testing rate per 100,000 population; α g is a time‐invariant CBG fixed effect and τ t is a CBG‐invariant day effect that controls for intraday cyclicality in travel behavior in addition to secular trends. Given the relatively small number of treatment and border CBG clusters (less than 30), we conduct statistical inference using wild cluster bootstrap techniques (Cameron et al., 2008; 2015).
Our estimate β 1 will be unbiased only if the common trends assumption is satisfied. To explore the validity of our two‐way fixed effects estimator, we conduct event study analyses to explore differential trends in foot traffic (and nonresident pings) between treatment and control CBGs in the weeks prior to the Sturgis event. The presence of common leads provides at least descriptive support for the common trends assumption. Moreover, this event‐study approach also allows us to further disentangle dynamics and examine lagged effects of Sturgis events, which permit identification of (a) post‐treatment days that saw the largest increases in foot traffic, and (b) when travel back home by attendees likely began.
4.2. Estimating effects of Sturgis rally on stay‐at‐home behavior and COVID‐19
To examine the impact of the Sturgis Motorcycle Rally on the local resident population, we use data from July 6, 2020 through September 2, 2020 and undertake a synthetic control approach (Abadie et al., 2010). This method has been used by several recent studies to investigate how COVID‐19 mitigation policies (Friedson et al., 2020; Dave et al. 2020d) and gatherings (Dave et al., 2020e, 2020f) have affected social distancing and the spread of novel coronavirus. As noted above, we focus on (a) Meade County, the county where the rally took place, (b) Meade County and the surrounding border counties (“Meade Plus Border”), and (c) the state of South Dakota.
A key decision for researchers is in the selection of the donor pool to form the counterfactual for the treatment jurisdiction. In order to avoid a contaminated control group, we first ensure that our donor pool was not directly affected by the Sturgis Rally. Thus, we exclude all jurisdictions from which we detect travelers to the Sturgis event via smartphone pings. To further ensure the absence of spillovers from those attendees who travel to nonattending counties, we also exclude any jurisdictions from border states to South Dakota, which includes Iowa, Minnesota, Montana, Nebraska, North Dakota, and Wyoming.
For our analyses of Meade County and its environs, we exclude from the donor pool (a) counties from within the state of South Dakota or from border states, and (b) counties with urbanicity rates above 64.5% or below 59.5% (creating a band of counterfactuals that envelope Meade County's urbanicity rate of 62.0) and counties with a population‐weighted density greater than 650 persons per square mile or below 350 persons per square mile (creating a band of donor counties that envelope Meade County's population weighted density of approximately 500 persons per square mile). These restrictions help to select on factors that may be important to COVID‐19 spread (Friedson et al., 2020; Dave et al., 2020b, 2020c).
To ensure that the synthetic control was similar to the treatment jurisdiction on our key outcomes over the pre‐Sturgis rally window, we match on (a) outcomes (stay‐at‐home behaviors, COVID‐19 cases per capita) on each day for 28 days prior to the start of the pre‐events on August 3, or (b) outcomes on 10 or 14 pretreatment days. We also consider matching on multiple observable traits that have been documented to affect COVID‐19 case growth, which include the state‐level COVID‐19 testing rate per 100,000 population, an indicator for whether the state issued a mask wearing mandate, and state reopening policies (number of days that the state has allowed reopening of bars/restaurants, personal care services, gyms, entertainment centers, and retail shops). Our synthetic control estimate is then calculated as the difference in average post‐treatment COVID‐19 cases between the treated jurisdiction and its synthetic control. 17
In addition to examining the effect of the Sturgis Rally on COVID‐19 cases in Meade County (including its border counties) and in South Dakota, we also examine the impact of the rally on stay‐at‐home behavior among residents. This will test for the net social distancing effect among local residents who might avoid the rally due to fears about COVID‐19 case growth (Dave et al., 2020e, 2020f), or perhaps due to drunken violence and disorderliness.
Our previous analyses on the scale of nonresident travel, in conjunction with the inflow patterns across counties that contributed the largest numbers of attendees to Sturgis rally events, highlight further areas of focus—beyond just Meade County and South Dakota—for studying potential effects on COVID‐19 cases as the out‐of‐state attendees travel back home. In order to assess whether there were any discernible changes in COVID‐19 cases in areas that contributed relatively more attendees to the event, we utilize a dose–response difference‐in‐differences model to exploit variation in the home counties to which attendees return, as detailed in Figure 1. Namely, we pool a panel of 3,078 counties and 59 days from all U.S. states except South Dakota (which is analyzed in the above synthetic analysis) and estimate the following model:
| (2) |
where COVID‐19cst is the natural log of cumulative COVID‐19 cases per 1,000 population, 18 Inflow c is a set of five indicators of intensity of inflows to Sturgis from resident counties (both absolute inflow and relative to resident smartphone pings) relative to counties that had zero inflow (reference) into the Sturgis event (corresponding to the heat maps shown in Figure 1), PostSturgis t measures lagged windows of the post treatment period beginning on August 3 and continuing through September 2, approximately 3 weeks following peak attendance at Sturgis and 2 weeks following the close of the event. This post‐treatment window captures a period well past the median incubation period (5 days) for COVID‐19, and surpasses the point where 99% of individuals who are infected would have started showing symptoms (Lauer et al., 2020). Our controls are as follows: X st as defined above as well as the COVID‐19 testing rate per 100,000 population; Z ct ,is a vector for the average temperature in a county and whether measurable rainfall fell; α c are county fixed effects, τ t are time fixed effects, and γ c * t is a county‐specific linear time trend. The latter helps to control for differential growth trends of COVID‐19 across counties. To evaluate the common trends assumption, we again conduct event study analyses by intensity of inflows to the Sturgis event. 19
5. RESULTS
Our findings on nonresident travel and foot traffic in Sturgis appear in Table 1 and Figure 2A,B. Synthetic control estimates on social distancing and local COVID‐19 spread in Meade County, its border counties, and the state of South Dakota are shown in Tables 2, 3 and in Figures 3, 4, 5, 6. And dose–response estimates are shown in Tables 4, 5 and in Figure 7. Supplemental analyses are shown in various Appendix Tables and Figures.
TABLE 1.
Difference‐in‐differences estimates of effect of Sturgis Motorcycle Rally on inverse hyperbolic sine nonresident smartphone pings and foot traffic in treatment census block groups
| (1) | (2) | (3) | (4) | (5) | (6) | (7) | |
|---|---|---|---|---|---|---|---|
| Nonresident smartphone pings | Restaurant and bar foot traffic | Retail food traffic | Entertainment foot traffic | Hotel foot traffic | Campground foot traffic | Business service foot traffic | |
| Panel I: Difference‐in‐difference estimate | |||||||
| Sturgis rally | 0.159* | 0.603*** | 0.505*** | 0.361*** | 0.348* | 0.322 | 0.244* |
| [p = .072] | [p = .002] | [p = .000] | [p = .004] | [p = .074] | [p = .106] | [p = .062] | |
| Panel II: Heterogeneous treatment effect by treatment window | |||||||
| 0–3 days after first event | 0.17*** | 0.298** | 0.184** | 0.145 | 0.091 | 0.152 | 0.006 |
| [p = .006] | [p = .018] | [p = .044] | [p = .104] | [p = .312] | [p = .162] | [p = .972] | |
| 4–5 days after first event | −0.078 | 0.633*** | 0.518*** | 0.393*** | 0.311* | 0.349* | 0.343** |
| [p = .68] | [p = .000] | [p = .000] | [p = .002] | [p = .094] | [p = .098] | [p = .048] | |
| 7–9 days after first event | 0.005 | 0.663*** | 0.461*** | 0.425** | 0.313* | 0.343 | 0.268* |
| [p = .954] | [p = .000] | [p = .002] | [p = .016] | [p = .08] | [p = .116] | [p = .088] | |
| 10–12 days after first event | 0.051 | 0.366** | 0.183 | 0.245* | 0.296 | 0.209 | 0.095 |
| [p = .53] | [p = .014] | [p = .176] | [p = .070] | [p = .118] | [p = .166] | [p = .516] | |
| 13+ days after first event | −0.176** | −0.181** | −0.326*** | −0.061 | −0.255*** | −0.122* | −0.155* |
| [p = .002] | [p = .034] | [p = .000] | [p = .298] | [p = .000] | [p = .066] | [p = .08] | |
| N | 583,016 | 583,016 | 583,016 | 583,016 | 583,016 | 583,016 | 583,016 |
Note: Estimates are generated using ordinary least squares. All models include cluster group and day fixed effects. State‐level controls include: whether food industry reopened, whether retail stores reopened, whether personal or pet care services reopened, whether entertainment or amusement activities reopened, and whether there are any mask wearing requirements. County‐level controls include: average temperature and precipitation. Confidence intervals and p‐values were calculated using a wild cluster bootstrap method.
*Significant at 10% level. **Significant at 5% level. ***Significant at 1% level.
FIGURE 2.
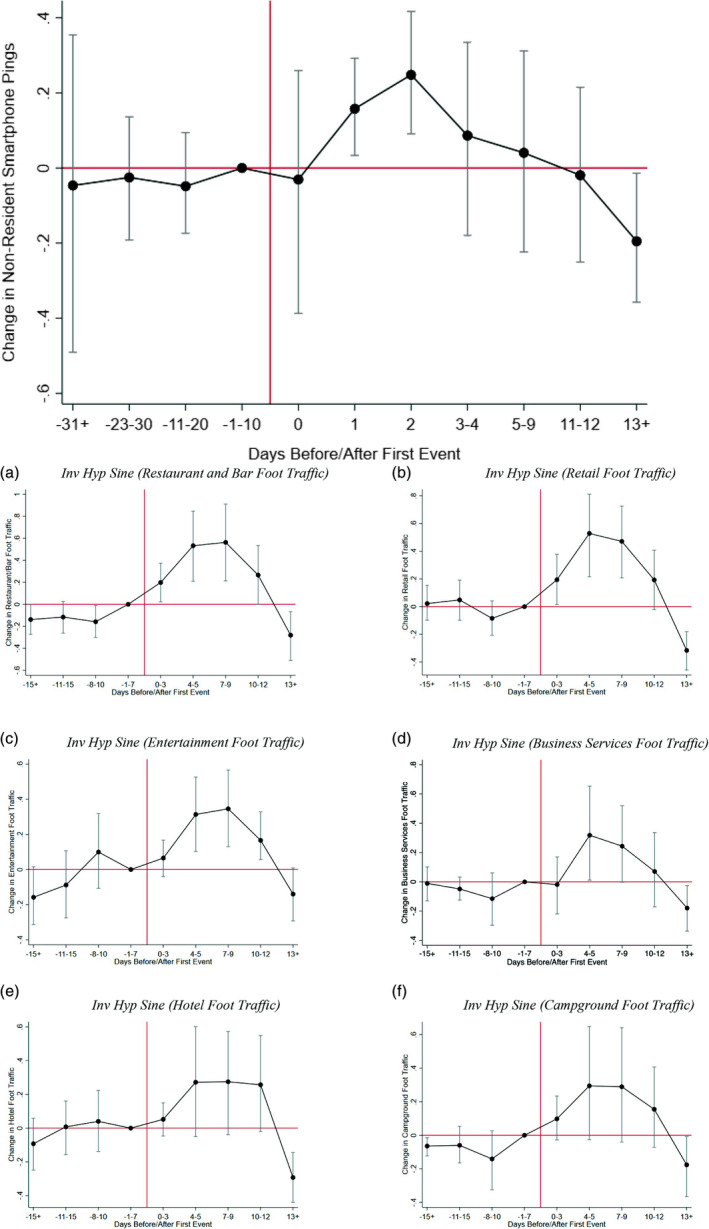
(a) Event‐study analyses of effect of Sturgis Motorcycle Rally on nonresident smartphone pings. Estimates are generated using ordinary least squares. All models include cluster group and day fixed effects. State‐level controls include: whether food industry reopened, whether retail stores reopened, whether personal or pet care services reopened, whether entertainment or amusement activities reopened, and whether there are any mask wearing requirements. County‐level controls include: average temperature and precipitation. Confidence intervals were calculated using a wild cluster bootstrap method. (b) Event‐study analyses of effect of Sturgis Motorcycle Rally on nonresident travel and foot traffic. A, Inverse hyperbolic sine (restaurant and bar foot traffic); B, inverse hyperbolic sine (retail foot traffic); C, inverse hyperbolic sine (entertainment foot traffic); D, inverse hyperbolic sine (business services foot traffic); E, inverse hyperbolic sine (hotel foot traffic); F, inverse hyperbolic sine (campground foot traffic). Estimates are generated using ordinary least squares. All models include cluster group and day fixed effects. State‐level controls include: whether food industry reopened, whether retail stores reopened, whether personal or pet care services reopened, whether entertainment or amusement activities reopened, and whether there are any mask wearing requirements. County‐level controls include: average temperature and precipitation. Confidence intervals were calculated using a wild cluster bootstrap method [Color figure can be viewed at wileyonlinelibrary.com]
TABLE 2.
Synthetic control estimates of effect of Sturgis Motorcycle Rally on stay‐at‐home behavior among local residents
| Percent staying at home full‐time | Median hours at home | |||||
|---|---|---|---|---|---|---|
| (1) | (2) | (3) | (4) | (5) | (6) | |
| Panel I: Meade County | ||||||
| Sturgis rally | −0.705 | 0.638 | 0.128 | −0.930* | −1.060** | −1.084** |
| [p = .719] | [p = .766] | [p = .889] | [p = .064] | [p = .018] | [p = .035] | |
| Pretreatment mean of DV | 30.933 | 30.933 | 30.933 | 9.925 | 9.925 | 9.925 |
| Panel II: Meade Cluster | ||||||
| Sturgis rally | −0.872 | −1.487 | −1.688 | −0.068 | 0.050 | −0.071 |
| [p = .860] | [p = .743] | [p = .648] | [p = .918] | [p = .889] | [p = .906] | |
| Pretreatment mean of DV | 28.510 | 28.510 | 28.510 | 9.378 | 9.378 | 9.378 |
| Panel III: South Dakota | ||||||
| Sturgis rally | −0.404 | −0.522 | −0.280 | 0.322 | 0.384 | 0.300 |
| [p = .938] | [p = .844] | [p = .938] | [p = .813] | [p = .563] | [p = .844] | |
| Pretreatment mean of DV | 26.392 | 26.392 | 26.392 | 9.198 | 9.198 | 9.198 |
| Observables used to construct the weights | ||||||
| # of pretreatment days | 28 | 10 | 14 | 28 | 10 | 14 |
| Match on all observables | No | Yes | Yes | No | Yes | Yes |
Note: The donor pool is comprised of counties with urbanicity rate ±2.5% of Meade County (62%) and weighted population density ±150% of Meade County (500), and excludes counties in border states and South Dakota, as well as counties with at least 1 home resident that that pinged in Sturgis event census block groups between 8/3 and 8/16. All observable controls include: state COVID‐19 testing rate per 100,000 population, number of days the state permitted reopening of businesses in the following sectors: restaurant, bars, movie theaters, gyms, and retail stores, and number of days the state had enacted a mask‐wearing mandate and travel quarantine mandate. Confidence intervals and p‐values were calculated using a wild cluster bootstrap method.
*Significant at the 10% level. **Significant at the 5% level. ***Significant at the 1% level.
TABLE 3.
Synthetic control estimates of effect of Sturgis Motorcycle Rally on cumulative COVID‐19 cases per 1,000 population
| (1) | (2) | (3) | |
|---|---|---|---|
| Panel I: Meade County | |||
| Full Sturgis treatment effect (8/3 through 8/28) | 1.632** | 2.073*** | 2.089*** |
| [p = .012] | [p = .006] | [p = .006] | |
| Only Sturgis event period (8/3 through 8/16) | 0.175 | 0.368* | 0.329* |
| [p = .409] | [p = .064] | [p = .082] | |
| Post‐Sturgis event period (8/17 through 8/28) | 2.832** | 3.477*** | 3.541*** |
| [p = .012] | [p = .006] | [p = .006] | |
| Pretreatment mean of DV | 2.122 | 2.122 | 2.122 |
| Panel II: Meade Cluster | |||
| Full Sturgis treatment effect (8/3 through 8/28) | 1.544** | 1.403** | 1.376** |
| [p = .029] | [p = .029] | [p = .029] | |
| Only Sturgis event period (8/3 through 8/16) | 0.377* | 0.317 | 0.321 |
| [p = .058] | [0.117] | [0.105] | |
| Post‐Sturgis event period (8/17 through 8/28) | 2.505** | 2.298** | 2.244** |
| [p = .029] | [p = .029] | [p = .029] | |
| Pretreatment mean of DV | 4.418 | 4.418 | 4.418 |
| Panel III: South Dakota | |||
| Full Sturgis treatment effect (8/3 through 8/28) | 1.099** | 1.239** | 1.221** |
| [p = .031] | [p = .031] | [p = .031] | |
| Only Sturgis event period (8/3 through 8/16) | 0.274 | 0.332 | 0.321 |
| [p = .188] | [p = .125] | [p = .125] | |
| Post‐Sturgis event period (8/17 through 8/28) | 1.778** | 1.986** | 1.962** |
| [p = .031] | [p = .031] | [p = .031] | |
| Pretreatment mean of DV | 9.033 | 9.033 | 9.033 |
| Observables used to construct the weights | |||
| # of pretreatment days | 28 | 10 | 14 |
| Match on all observables | No | Yes | Yes |
Note: The donor pool is comprised of counties with urbanicity rate ±2.5% of Meade County (62%) and weighted population density ±150% of Meade County (500), and excludes counties in border states and South Dakota, as well as counties with at least 1 home resident that that pinged in Sturgis event census block groups between 8/3 and 8/16. All observable matching controls include: state COVID‐19 testing rate per 100,000 population (measured on 4 days), number of days the state permitted reopening of businesses in the following sectors: restaurant, bars, movie theaters, gyms, and retail stores, and number of days the state had enacted a mask‐wearing mandate and travel quarantine mandate. The permutation‐based p‐values are included in brackets below each point estimate.
*Significant at the 10% level. **Significant at the 5% level. ***Significant at the 1% level.
FIGURE 3.
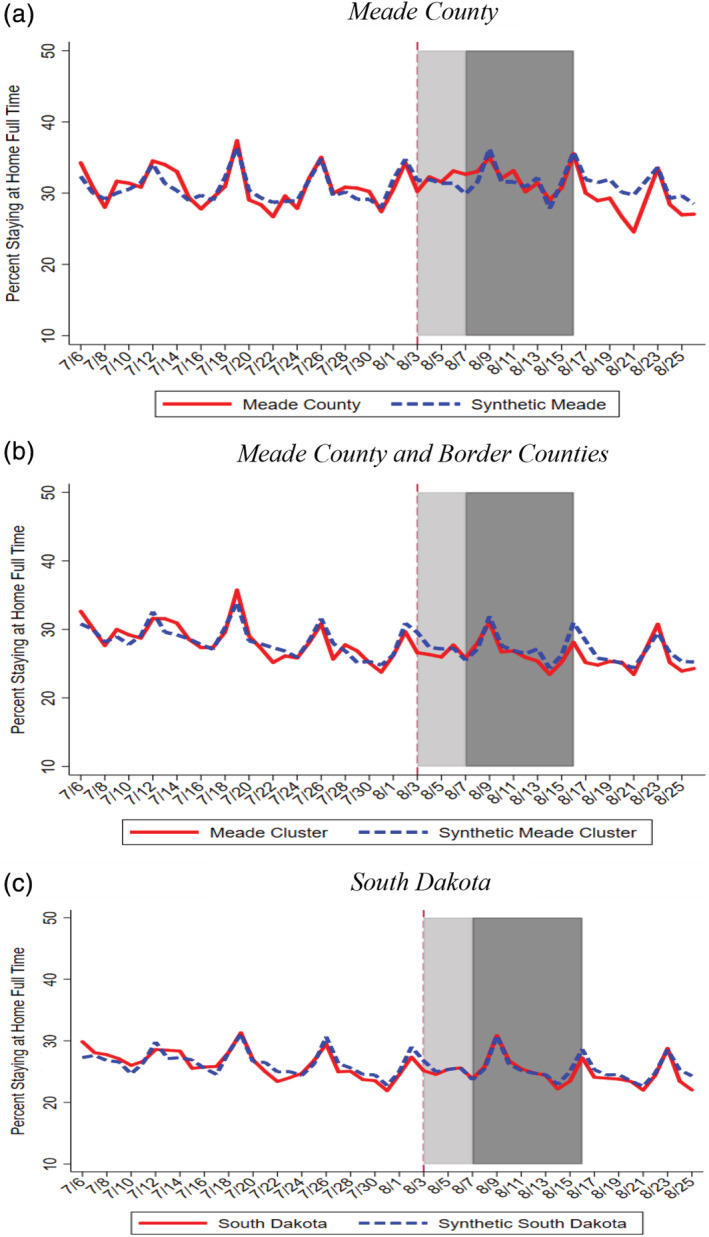
Synthetic control estimates of effect of Sturgis Motorcycle Rally on percent stay‐at‐home full‐time. (a) Meade County. (b) Meade County and Border Counties. (c) South Dakota. The donor pool is comprised of counties with urbanicity rate ±2.5% of Meade County (62%) and weighted population density ±150% of Meade County (500), and excludes counties in border states and South Dakota, as well as counties with at least 1 home resident that pinged in Sturgis event census block groups between 8/3 and 8/16. All synthetic control estimates are generated by matching on pretreatment stay‐at‐home behavior on every day between 7/6 and 8/2 [Color figure can be viewed at wileyonlinelibrary.com]
FIGURE 4.
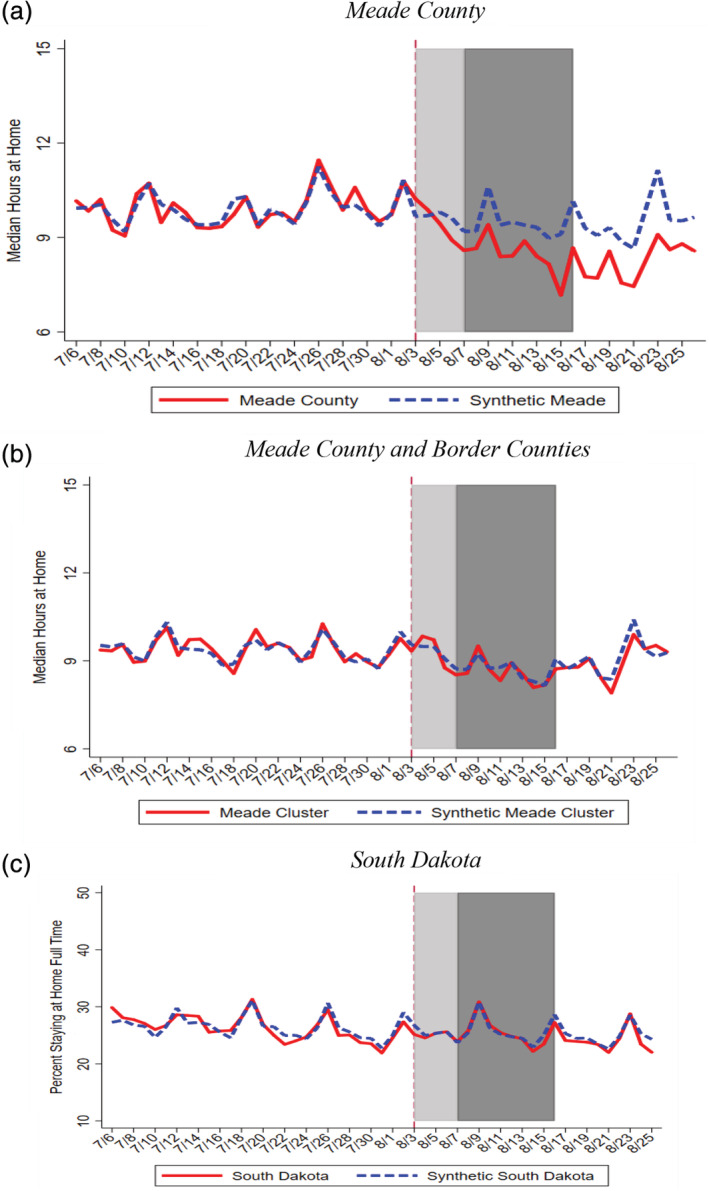
Synthetic control estimates of effect of Sturgis Motorcycle Rally on median hours spent at home. (a) Meade County. (b) Meade County and Border Counties. (c) South Dakota. The donor pool is comprised of counties with urbanicity rate ±2.5% of Meade County (62%) and weighted population density ±150% of Meade County (500), and excludes counties in border states and South Dakota, as well as counties with at least 1 home resident that that pinged in Sturgis event census block groups between 8/3 and 8/16. All synthetic control estimates are generated by matching on pretreatment stay‐at‐home behavior on every day between 7/6 and 8/2 [Color figure can be viewed at wileyonlinelibrary.com]
FIGURE 5.
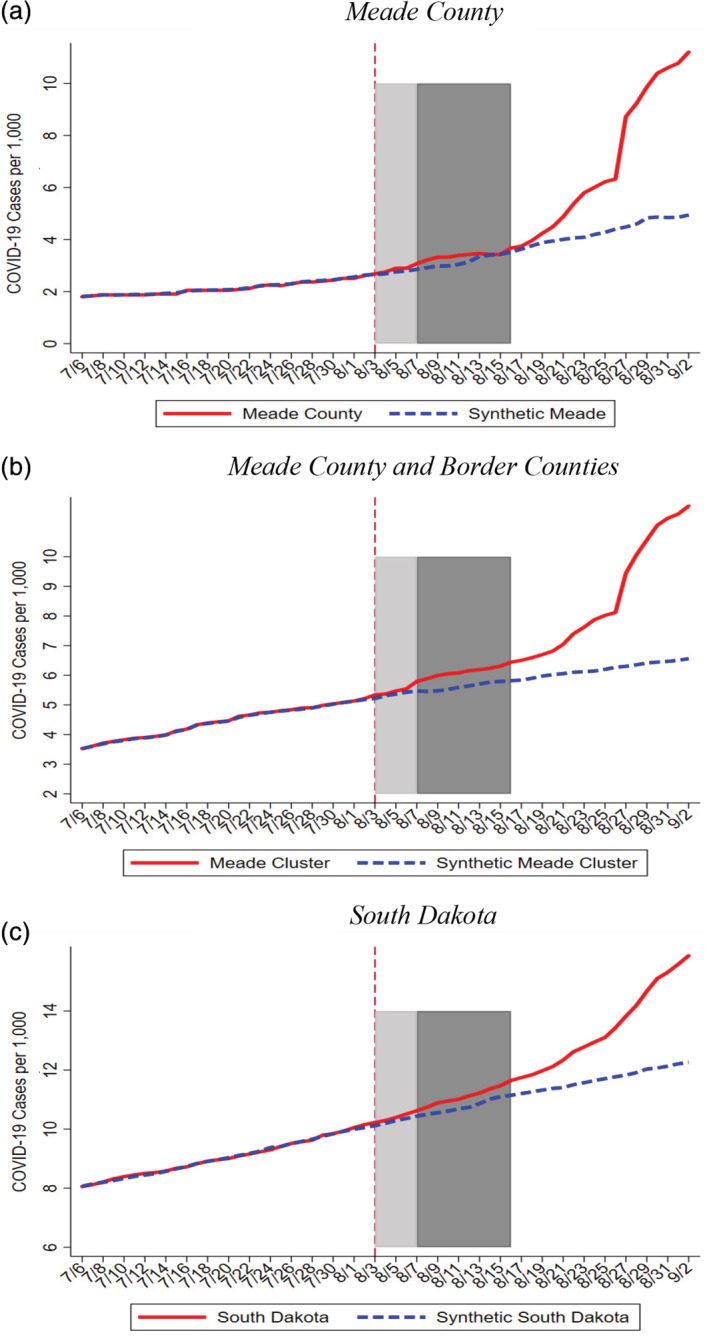
Synthetic control estimates of effect of Sturgis Motorcycle Rally on cumulative COVID‐19 cases per 1,000 population, synthetic controls generated by matching on COVID‐19 cases on each pretreatment day. (a) Meade County. (b) Meade County and Border Counties. (c) South Dakota. The donor pool is comprised of counties with urbanicity rate ±2.5% of Meade County (62%) and weighted population density ±150% of Meade County (500), and excludes counties in border states and South Dakota, as well as counties with at least 1 home resident that that pinged in Sturgis event census block groups between 8/3 and 8/16. All synthetic control estimates are generated by matching on pretreatment stay‐at‐home behavior on every day between 7/6 and 8/2 [Color figure can be viewed at wileyonlinelibrary.com]
FIGURE 6.
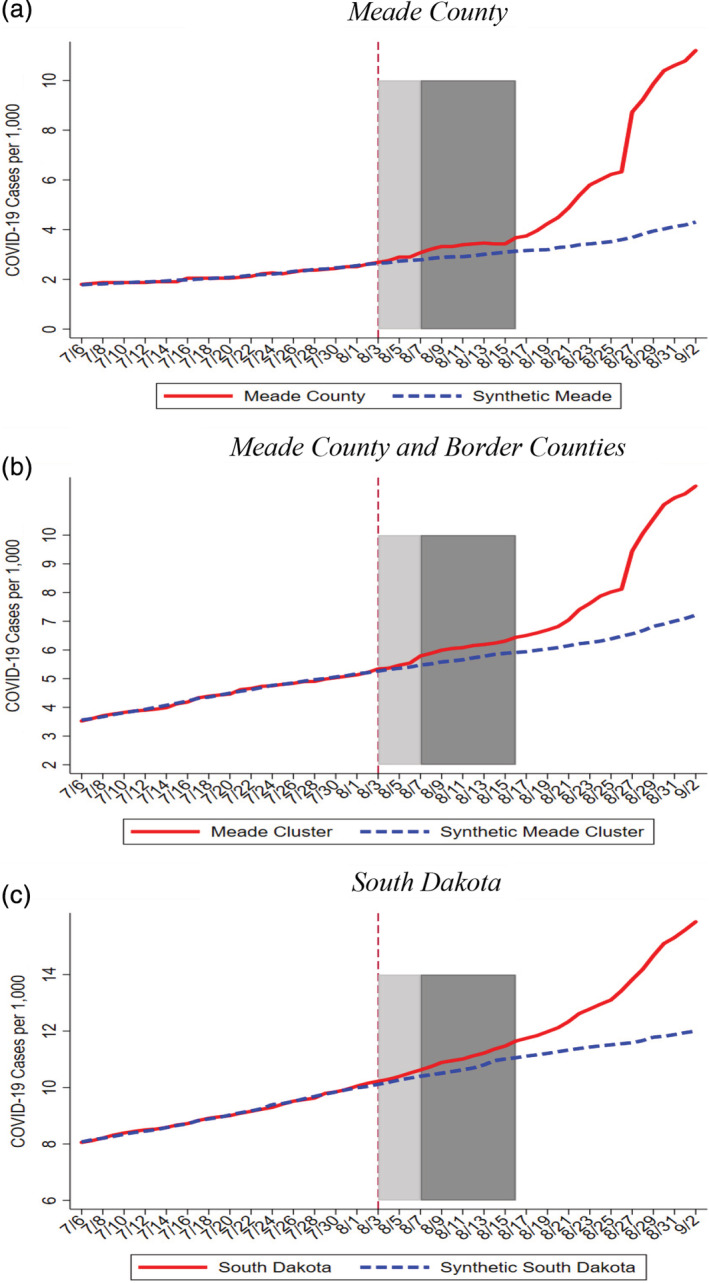
Synthetic control estimates of effect of Sturgis Motorcycle Rally on cumulative COVID‐19 cases per 1,000 population, synthetic controls generated by matching on COVID‐19 cases on 14 pretreatment days, COVID‐19 testing rates, reopening policies, travel restriction policies, mask‐wearing policies and & social distancing. (a) Meade County. (b) Meade County and Border Counties. (c) South Dakota. The donor pool is comprised of counties with urbanicity rate ±2.5% of Meade County (62%) and weighted population density ±150% of Meade County (500), and excludes counties in border states and South Dakota, as well as counties with at least 1 home resident that that pinged in Sturgis event census block groups between 8/3 and 8/16. All synthetic control estimates are generated by matching on pretreatment stay‐at‐home behavior on 7/7, 7/9, 7/11, 7/13, 7/15, 7/17, 7/19, 7/21, 7/23, 7/25, 7/27/, 7/29, 7/31, and 8/2, state COVID‐19 testing rate per 100,000 population, number of days the state permitted reopening of businesses in the following sectors: restaurant, bars, movie theaters, gyms, and retail stores, and number of days the state had enacted a mask‐wearing mandate and travel quarantine mandate [Color figure can be viewed at wileyonlinelibrary.com]
TABLE 4.
Dose–response difference‐in‐differences estimates of the effect of Sturgis rally on log (county‐level cumulative COVID‐19 cases)
| (1) | (2) | |
|---|---|---|
| Relative inflow | Absolute inflow | |
| Counties with high inflow | ||
| August 3–5 (0–3 days after rally begins) | 0.015 | 0.017 |
| [p = .29] | [p = .35] | |
| August 6–8 (4–6 days after rally begins) | 0.017 | 0.015 |
| [p = .31] | [p = .52] | |
| August 9–19 (7–17 days after rally begins) | 0.026 | 0.042 |
| [p = .38] | [p = .29] | |
| August 20–24 (18–23 days after rally begins) | 0.058 | 0.078 |
| [p = .18] | [p = .21] | |
| August 26 onward (24+ days after rally begins) | 0.102* | 0.127 |
| [p = .07] | [p = .14] | |
| Counties with moderate‐high inflow | ||
| August 3–5 (0–3 days after rally begins) | 0.016 | 0.013 |
| [p = .19] | [p = .2] | |
| August 6–8 (4–6 days after rally begins) | 0.015 | 0.014 |
| [p = .28] | [p = .28] | |
| August 9–19 (7–17 days after rally begins) | 0.032 | 0.033 |
| [p = .16] | [p = .12] | |
| August 20–24 (18–23 days after rally begins) | 0.070** | 0.061** |
| [p = .03] | [p = .03] | |
| August 26 onward (24+ days after rally begins) | 0.118*** | 0.096** |
| [p = .00] | [p = .01] | |
| Counties with moderate inflow | ||
| August 3–5 (0–3 days after rally begins) | 0.012 | 0.001 |
| [p = .21] | [p = .96] | |
| August 6–8 (4–6 days after rally begins) | 0.014 | 0.004 |
| [p = .24] | [p = .76] | |
| August 9–19 (7–17 days after rally begins) | 0.026 | 0.008 |
| [p = .2] | [p = .73] | |
| August 20–24 (18–23 days after rally begins) | 0.044 | 0.02 |
| [p = .12] | [p = .53] | |
| August 26 onward (24+ days after rally begins) | 0.068* | 0.033 |
| [p = .05] | [p = .38] | |
| Counties with moderate‐low inflow | ||
| August 3–5 (0–3 days after rally begins) | 0.004 | 0.009 |
| [p = .57] | [p = .25] | |
| August 6–8 (4–6 days after rally begins) | 0.004 | 0.01 |
| [p = .68] | [p = .33] | |
| August 9–19 (7–17 days after rally begins) | 0.001 | 0.011 |
| [p = 1] | [p = .51] | |
| August 20–24 (18–23 days after rally begins) | −0.002 | 0.018 |
| [p = .94] | [p = .42] | |
| August 26 onward (24+ days after rally begins) | −0.001 | 0.027 |
| [p = .97] | [p = .33] | |
| Counties with low inflow | ||
| August 3–5 (0–3 days after rally begins) | −0.014 | −0.008 |
| [p = .2] | [p = .43] | |
| August 6–8 (4–6 days after rally begins) | −0.015 | −0.009 |
| [p = .31] | [p = .5] | |
| August 9–19 (7–17 days after rally begins) | −0.023 | −0.019 |
| [p = .25] | [p = .31] | |
| August 20–24 (18–23 days after rally begins) | −0.025 | −0.025 |
| [p = .31] | [p = .31] | |
| August 26 onward (24+ days after rally begins) | −0.025 | −0.025 |
| [p = .4] | [p = .4] | |
| N | 178,900 | 178,900 |
Note: Estimate is generated using weighted least squares estimate. Standard errors are clustered at the county level. All estimates include county and day fixed effects as well as county specific linear time trend. State policy controls include log COVID‐19 testing, an indicator for whether a state reopened restaurant or bars, an indicator for whether a state reopened retail services beyond curbside pickup, an indicator for whether a state reopened personal or pet care services, an indicator for whether a state reopened entertainment business, an indicator for whether a state reopened gyms, and an indicator for whether a state paused reopening. County weather controls include average temperature and an indicator for whether any measurable precipitation fell.
*Significant at the 10% level. **Significant at the 5% level. ***Significant at the 1% level.
TABLE 5.
Heterogeneity in effect of Sturgis rally on log (county‐level cumulative COVID‐19 cases), by strength of state mitigation policies
| (1) | (2) | |||
|---|---|---|---|---|
| Relative inflow | Absolute inflow | |||
| Strict | Weak | Strict | Weak | |
| Panel I: Policy index | ||||
| Counties with high inflow | ||||
| August 3–5 (0–3 days after rally begins) | −0.008 | 0.031 | −0.018 | 0.049 |
| [p = .59] | [p = .11] | [p = .31] | [p = .12] | |
| August 6–8 (4–6 days after rally begins) | −0.003 | 0.027 | −0.022 | 0.043 |
| [p = .86] | [p = .23] | [p = .3] | [p = .26] | |
| August 9–19 (7–17 days after rally begins) | −0.013 | 0.054 | −0.023 | 0.068 |
| [p = .72] | [p = .12] | [p = .57] | [p = .23] | |
| August 20–24 (18–23 days after rally begins) | 0.003 | 0.091* | −0.005 | 0.093 |
| [p = .95] | [p = .07] | [p = .94] | [p = .29] | |
| August 26 onward (24+ days after rally begins) | 0.026 | 0.136* | 0.007 | 0.129 |
| [p = .72] | [p = .05] | [p = .93] | [p = .27] | |
| Counties with moderate‐high inflow | ||||
| August 3–5 (0–3 days after rally begins) | −0.01 | 0.034* | −0.006 | 0.029* |
| [p = .21] | [p = .05] | [p = .51] | [p = .03] | |
| August 6–8 (4–6 days after rally begins) | −0.005 | 0.024 | 0.001 | 0.023 |
| [p = .69] | [p = .21] | [p = .94] | [p = .14] | |
| August 9–19 (7–17 days after rally begins) | 0.016 | 0.03 | 0.02 | 0.036 |
| [p = .44] | [p = .34] | [p = .44] | [p = .16] | |
| August 20–24 (18–23 days after rally begins) | 0.057* | 0.052 | 0.051 | 0.054 |
| [p = .08] | [p = .25] | [p = .2] | [p = .13] | |
| August 26 onward (24+ days after rally begins) | 0.098** | 0.087 | 0.08 | 0.077 |
| [p = .03] | [p = .13] | [p = .13] | [p = .11] | |
| Panel II: Bars or restaurant | ||||
| Counties with high inflow | ||||
| August 3–5 (0–3 days after rally begins) | −0.011 | 0.039** | 0.009 | 0.018 |
| [p = .49] | [p = .05] | [p = .52] | [p = .61] | |
| August 6–8 (4–6 days after rally begins) | −0.011 | 0.035 | 0.003 | 0.011 |
| [p = .54] | [p = .13] | [p = .89] | [p = .79] | |
| August 9–19 (7–17 days after rally begins) | −0.026 | 0.064* | 0.017 | 0.042 |
| [p = .5] | [p = .07] | [p = .68] | [p = .53] | |
| August 20–24 (18–23 days after rally begins) | −0.015 | 0.102* | 0.046 | 0.067 |
| [p = .8] | [p = .06] | [p = .49] | [p = .52] | |
| August 26 onward (24+ days after rally begins) | 0.007 | 0.146* | 0.077 | 0.106 |
| [p = .93] | [p = .05] | [p = .39] | [p = .47] | |
| Counties with moderate‐high inflow | ||||
| August 3–5 (0–3 days after rally begins) | −0.013 | 0.029* | −0.014 | 0.027* |
| [p = .15] | [p = .06] | [p = .14] | [p = .04] | |
| August 6–8 (4–6 days after rally begins) | −0.009 | 0.022 | −0.007 | 0.023 |
| [p = .51] | [p = .19] | [p = .65] | [p = .11] | |
| August 9–19 (7–17 days after rally begins) | 0.005 | 0.035 | 0.008 | 0.038 |
| [p = .84] | [p = .21] | [p = .8] | [p = .1] | |
| August 20–24 (18–23 days after rally begins) | 0.045 | 0.061 | 0.038 | 0.059* |
| [p = .22] | [p = .13] | [p = .42] | [p = .08] | |
| August 26 onward (24+ days after rally begins) | 0.074 | 0.102* | 0.06 | 0.085* |
| [p = .13] | [p = .05] | [p = .32] | [p = .06] | |
| N | 182,730 | 182,730 | ||
Note: Estimate is generated using weighted least squares estimate. Standard errors are clustered at the state level. All estimates include county and day fixed effects as well as county specific linear time trend. State policy controls include log COVID‐19 testing, an indicator for whether a state reopened restaurant or bars, an indicator for whether a state reopened retail services beyond curbside pickup, an indicator for whether a state reopened personal or pet care services, an indicator for whether a state reopened entertainment business, an indicator for whether a state reopened gyms, and an indicator for whether a state paused reopening. County weather controls include average temperature and an indicator for whether any measurable precipitation fell.
*Significant at the 10% level. **Significant at the 5% level. ***Significant at the 1% level.
FIGURE 7.
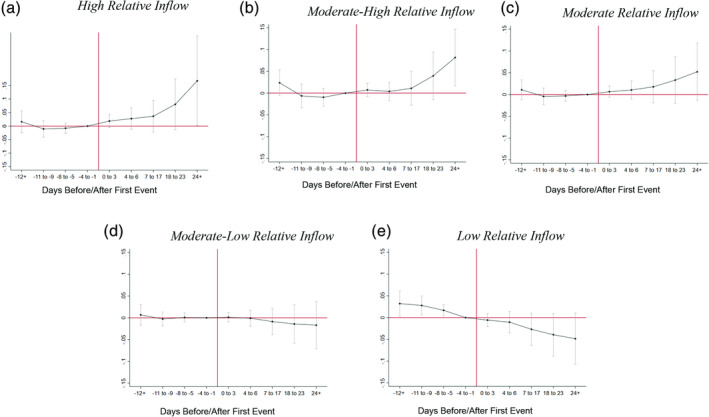
Event‐study analysis of effect of Sturgis rally on log (county‐level COVID‐19 cases), by relative inflow of county residents to Sturgis Motorcycle Rally. (a) High relative inflow; (b) moderate‐high relative inflow; (c) moderate relative inflow; (d) moderate‐low relative inflow; (e) low relative inflow [Color figure can be viewed at wileyonlinelibrary.com]
5.1. Nonresident travel, foot traffic, and social distancing
In Figure 2A, we first establish with our anonymized smartphone data that the 2020 Sturgis Rally attracted substantial foot traffic, particularly from nonresidents, consistent with reports of over 460,000 attendees at the event. Our event‐study analysis shows that in the weeks leading up to the event, there was relatively little difference in nonresident pings in the census block groups that later held Sturgis events and those nonresident pings in CBGs in other parts of South Dakota or in the border states. However, the number of nonresident pings rose substantially in the days following the onset of Sturgis events. This gradually increased during the first week following the onset of the event, cresting about 2 days after, and then returning to baseline about 11–12 days after the start of the first event, corresponding to the length of the pre‐Rally and main Rally events. 20 Note that the magnitudes of the lagged effects we observe are clearly lower‐bound estimates of inflows given that many of the control CBGs in our sample also saw spillover effects from travelers, either en route to, traveling home from, or riding motorcycles around the area during the Sturgis event. Still, our nonresident “ping” effects are statistically distinguishable from zero.
We observe a similar pattern of results in Figure 2B, where we show event‐study analyses of foot traffic at the Sturgis Rally. Specifically, we examine visitation patterns into restaurants and bars (Panel a), retail establishments (Panel b), entertainment venues (Panel c), business services (Panel d), hotels (Panel e), and campgrounds (Panel f). Again, there is relatively little evidence of differential pretreatment trends across each of these measures of foot traffic. Rather, we find strong and consistent evidence of large increases in foot traffic into each of these venues during the Sturgis Rally event, particularly for restaurants/bars, entertainment venues, and retail establishments. The magnitudes of our estimated effects were substantial, ranging from about 30 to 90% increase in foot traffic across each of these venues. These results, taken together with our nonresident ping analyses, provide strong evidence that the Sturgis Rally attracted substantial inflows, personal interaction, and economic activity in Meade County.
Our findings in Table 1 confirm the findings from our event study analyses. Panel I shows the overall “Sturgis event” effect, while Panel II shows post‐treatment lagged windows, which captures growing event activity and then the gradual close of the event. Consistent with our event studies, we find that relative to other nearby CBGs in South Dakota and in bordering states, nonresident pings and foot traffic rise substantially in the days following the onset of the Sturgis events, generally increasing for about a week to 10 days before declining (13+ days after the event). The peak estimated effects range from 36.7% (for hotels) to 94.1% (for restaurants and bars) increase in foot traffic relative to surrounding CBGs in South Dakota and the bordering states. As discussed above, these are likely lower bound estimates given spillovers into other areas en route to Sturgis or as attendees are riding their motorcycles around other areas during the event.
5.2. Social distancing and local community spread of COVID‐19
One of the most important results in two recent studies of the impacts of large gatherings (at a Tulsa, Oklahoma political rally in Dave et al., 2020e, and in large U.S. cities experiencing Black Lives Matter protests in Dave et al., 2020f) has been a countervailing increase in social distancing by local residents in response to the gathering, dampening community spread of COVID‐19. Could such risk‐averting behavior have occurred in Sturgis as well, where 60% of local residents polled appear to have opposed the Rally going on as in prior years? In Figure 3, we show synthetic control estimates of the effects of the Sturgis Rally on full‐time stay‐at‐home behavior in Meade County (Panel a), Meade County and its border counties (Panel b), and South Dakota as a whole (Panel c).
In Panels (a) and (b), we construct our synthetic control using a donor pool comprised of counties that (a) did not have residents “pinging” in Sturgis during the period August 3 through 16 and were not located in border states of South Dakota, (b) had urbanicity rates that did not deviate by more than 2.5% from the urbanicity rate of Meade County (62.5%), and (c) had weighted population density than did not deviate by more than 150 persons per square mile from the population density of Meade County (approximately 500 persons per square mile). After matching on all pretreatment values of full‐time stay‐at‐home behavior, we find no evidence that local residents avoided going outside and increased full‐time stay‐at‐home behavior in response to the large gathering in their county. This is true across both the pre‐Rally event period (light gray shading) and the main Rally events (darker gray shading). We also find no evidence of increases in full‐time stay‐at‐home behavior in South Dakota following the Sturgis event. 21
Rather, in Figure 4, we document that there was a decline in stay‐at‐home behavior by local residents, when such behavior is measured at the intensive margin. Specifically, we find that the average number of hours that local residents in Meade County (Panel a) spent in their home substantially declined during and following the onset of the Sturgis Rally, suggesting that local residents also attended the rally events. 22 Interestingly, this decline appeared to continue even as the event closed on August 16, indicative of some persistence in these behaviors. We also find these results in alternate synthetic control models where we match on 14 days of pretreatment social distancing as well as state policies related to reopening of businesses, mask‐wearing policies, and COVID‐19 testing rates (see Appendix Figure 4).
In Table 2, we provide formal synthetic control estimates, which largely confirm the results shown in Figures 3, 4 and Appendix Figures 3–4. We fail to detect evidence that the Sturgis Rally significantly affected full‐time stay‐at‐home behavior (Columns 1–3). However, we do find that the Sturgis Rally reduced the average number of hours that Meade County residents (Panel I) spent at home (Columns 4–6) by about 0.9 to 1.1 hr, or approximately 9.4 to 10.9% relative to the pretreatment mean. This reduction in stay‐at‐home behaviors does not extend much beyond Meade County, and the estimated effect sizes are much smaller when we include border counties to Meade (Panel II) and the state of South Dakota as a whole (Panel III). 23
These results suggest that in contrast to prior large gatherings that have been studied (i.e., Tulsa and BLM protests), in the case of Sturgis, the local resident population appeared to participate in the events. This raises the possibility that the local population may be at risk for COVID‐19 spread, especially if mitigating strategies (i.e., mask‐wearing, interacting closely with only household members, avoiding crowds) were not undertaken.
In Figures 5 and 6 and in Table 3, we explore whether the Sturgis Rally contributed to local community spread of COVID‐19. We find strong evidence that the events were a local spreader of COVID‐19. Figure 5 shows synthetic control estimates for the model where we match on all pretreatment days of cumulative COVID‐19 cases while Figure 6 shows estimates where we match on half of all pretreatment days (14 days) as well as on other predictors of community spread, including the number of days the state has permitted reopening of restaurants/bars, entertainment venues, personal care services, and gyms, as well as the number of days the state has had a mask‐wearing mandate and the state COVID‐19 testing rate (measured on July 7, August 2, August 6, and August 20). Across both sets of figures, we find strong evidence that the Sturgis Rally is associated with a substantial increase in COVID‐19 cases in the local population. The effect appears particularly stark in Meade County, which hosted the Rally's core events. There is a clear break in COVID‐19 growth in the period following the Sturgis Rally, accelerating after about August 24, a week following the event's close.
Table 3 presents the synthetic control estimates of the Sturgis Motorcycle Rally on cumulative COVID‐19 cases. We find that over the full post‐treatment period, the Sturgis Rally was associated with a 1.63–2.09 increase in COVID‐19 cases per 1,000 people in Meade County (Panel I). This corresponds to a 76.8–98.5% increase in cumulative COVID‐19 cases relative to its estimated synthetic counterfactual. The effects are statistically distinguishable from zero using permutation‐based p‐values generated from placebo tests, and are largest when we might expect them, following the incubation period of COVID‐19 (Lauer et al., 2020) during the period following the close of the Sturgis events. Specifically, after August 16th, we find that COVID‐19 cases increase by 2.83–3.54 cases per 1,000 population in Meade County relative to its synthetic control. By September 2, approximately 3 weeks following the Sturgis event, we find that COVID‐19 cases are 6–7 cases higher per 1,000 population in Meade County, a 100–200% increase in cases. This translates to between 177 and 195 more total cases in the County, by the end of the analysis period, as a result of the rally.
Turning to Meade County and its border counties (Panel II), we find that there is strong evidence that the Sturgis Rally increases COVID‐19 cases in Meade County's environs. In Meade County and its border counties, the Sturgis event is associated with a 1.38–1.54 cases per 1,000 population increase in cumulative COVID‐19 cases. Again, the effects are largest during the period following the close of the Motorcycle Rally.
Finally, the spread appears to be picked up in the entire state of South Dakota (Panel III), with almost 10% of attendees coming from within the state. Using our synthetic control method, we find that COVID‐19 cases are 1.10–1.24 higher per 1,000 population, effects that are statistically distinguishable from zero at conventional levels. By September 2, the synthetic control estimates indicate an increase in the state by between 3,185 and 3,441 total number of cases. We note that these estimates may be lower bound estimates to the extent that several of the positively weighted donor states that contributed to synthetic South Dakota (see Appendix Table 2) included counties with residents that “pinged” in Sturgis at the time of the event and could have contributed to community spread back home. 24
Together, the findings in Figures 5 and 6 and Table 3 provide strong evidence that the Sturgis event contributed to substantial local community spread. We next turn to an exploration of whether the impact of the Sturgis event extended nationally. That is, we answer the question: did the Motorcycle Rally turn into a superspreader event?
5.3. Dose–response estimates of effect of Sturgis on broader national spread of COVID‐19
While the above findings have established evidence of local community spread of COVID‐19, we next assess the degree to which the Sturgis event contributed to COVID‐19 spread beyond the borders of South Dakota. For this purpose, we exclude counties from the state of South Dakota from the analysis sample and use our dose–response difference‐in‐differences model (Equation 2) to assess whether counties that had relatively higher numbers of residents attend the Sturgis Rally saw increases in community spread of COVID‐19 following the event, when many such attendees returned home. Figure 7 and the corresponding Table 4 present the results of this exercise.
Figure 7 presents event‐study analyses of the effect of relative inflows into the Sturgis Rally on the natural log of cumulative COVID‐19 cases in attendees' resident counties. As noted above, the relative inflow measure captures the ratio of the number of net pings in Sturgis treatment CBGs from August 3 to 16 (relative to nonresident pings in the same CBGs from July 9 to 26) to the average number of resident pings over the sample window. Figure 7 presents event studies for Low Inflows, Moderate‐Low Inflows, Moderate Inflows, Moderate‐High Inflows, and High Inflows. The estimates shown in the event studies may be thought of as COVID‐19 effects relative to counties with no inflows to the Sturgis rally. Our event study results show little evidence of pretreatment county‐level COVID‐19 case trends. This suggests that even if those counties that contributed higher inflows into Sturgis were comprised of residents with heterogeneous risk preferences (i.e., residents in higher inflow counties may be less risk averse than residents in lower inflow counties), trends in COVID‐19 cases were similar across the two types of counties in the period leading up to the Sturgis event. 25 In moderate and higher inflow counties, we find that approximately more than 3 weeks after the start of the Sturgis events (corresponding to about 2 to 2.5 weeks following the official Rally end 26 ), county‐level cumulative COVID‐19 cases increase by about 6–12%. This provides some visual evidence of nonlocalized spread of COVID‐19 as a result of the Sturgis Motorcycle Rally. We find little evidence, within this time span, of any discernible increase in cases in those counties that sourced relatively fewer attendees to the Sturgis rally.
Table 4 presents the lagged effects of the Sturgis Rally on the natural log of COVID‐19 cases. Our findings in Column (1) show that the highest relative inflow counties to Sturgis (outside of the state of South Dakota), which were comprised of counties representing states nationwide, including Arizona, California, Colorado, Iowa, Minnesota, Nebraska, Nevada Washington, and Wyoming 27 —saw a 10.7% increase in COVID‐19 cases more than 3 weeks following the opening of the Sturgis Rally, and about 2 weeks following the close of the events. Note that this effect is identified of each of these counties' own county‐specific time trend relative to similar trends in noninflow counties. Over the same time window, we find that the second highest inflow counties (151 counties) also experienced about a 12.5% increase in COVID‐19 cases following the events. Turning to our “moderate inflow” counties (630 counties), we also see that a diverse set of counties from states across the nation also saw about a 7% increase in COVID‐19 cases, beginning about 10 days following the official close of the Sturgis Rally. These effects are all significantly different from zero. This suggests that the COVID‐19 spread effects of Sturgis occurred far more widely than just the state of South Dakota or its border states. It also suggests that the superspreading effects of the event were diffused across the nation. 28
In contrast, we find no evidence that lower inflow counties saw differential changes in COVID‐19 case growth relative to counties that did not have any inflows. This suggests that the superspreading effects of the Sturgis Event were restricted to counties with more substantial inflows.
As the relative measure of inflows normalizes by the total resident pings in the county, the pattern of results suggested in Column (1) of Table 4 were not simply driven by high population counties or by idiosyncratic SafeGraph coverage differences across counties. 29 In defining the “dose” of returning rally‐goers to their home counties, we also alternately consider the absolute measure of county‐level inflows into Sturgis. Figure 8 shows event‐study analyses of the effects of absolute inflows into Sturgis on the natural log of COVID‐19 cases. Consistent with our relative inflow measure, we find that moderate and higher inflow counties saw larger increases in COVID‐19 cases relative to counties that contribute no inflows into the Sturgis Rally.
FIGURE 8.
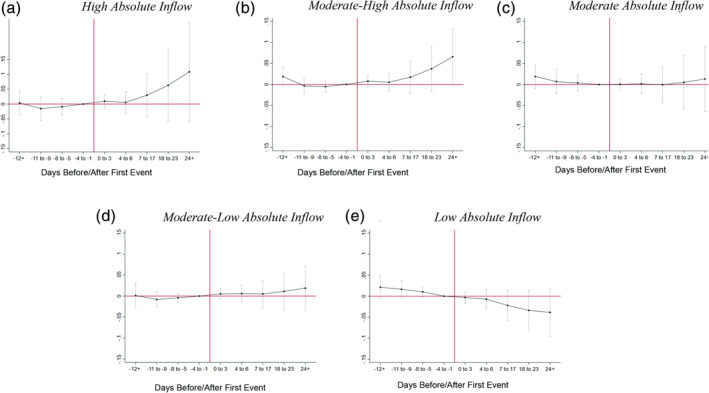
Event‐study analysis of effect of Sturgis rally on log (county‐level COVID‐19 cases), by absolute inflow of county residents to Sturgis Motorcycle Rally. (a) High absolute inflow; (b) moderate‐high absolute inflow; (c) moderate absolute inflow; (d) moderate‐low absolute inflow; (e) low absolute inflow [Color figure can be viewed at wileyonlinelibrary.com]
In Column (2) of Table 4, we show dose–response estimates using the absolute inflow measure. The results continue to show strong evidence that in the weeks following the Sturgis Rally, COVID‐19 cases grew more rapidly in counties that sourced more attendees to the Sturgis.
In our highest absolute inflow counties—comprised of only a handful of counties (7), we find that the Sturgis Rally is associated with a 13.5% increase in COVID‐19 cases; the effect is not statistically distinguishable from zero at conventional levels. We also find that the wide‐ranging set of moderate‐high inflow counties (507 counties) saw larger and significant increases in COVID‐19 cases relative to counties that saw no inflows into Sturgis, on order of about 10.1%. There is little evidence that the rally led to a higher caseload in the other counties that supplied far fewer attendees.
In the main, our findings in Table 4 are consistent with recent studies of the COVID‐19 spreading effects of other types of mass gatherings. For instance, Ahammer et al. (2020) study the effects of more localized mass gatherings—hosting a National Basketball Association (NBA) or National Hockey League (NHL) game, with an average audience of 18,000 individuals—on COVID‐19 cases in counties hosting the game and its perimeter counties prior to the suspension of play in March 2020. While the potential spread of COVID‐19 is more localized given the audience, the authors find the event is associated with an 8.3% increase in COVID‐19 cases in affected counties. Wing et al. (2020) find a qualitatively similar pattern of results in studying this question. 30
In supplementary analyses, presented in Appendix Table 4, we control for census division‐specific time fixed effects to account for unmeasured spatial shocks. 31 Note that these controls are in addition to county‐specific linear time trends, which are included in all COVID‐19 specifications. COVID‐19 case growth in the United States tends to be correlated within geographic regions and estimates in Appendix Table 4 explicitly control for any unobserved time‐varying regional shocks that may be driving similar trends within regions but differential trends across them. Results in Appendix Table 4 largely confirm the patterns discussed above, with counties that sourced relatively more visitors to the Sturgis Rally experiencing a larger increase in cases, on the order of 6.4–11.0% (counties with moderate‐high and high relative inflows) relative to counties with no inflows. We do not find any significant increase in cases in the other sets of counties. While these models allow us to rule out the concern that our results are picking up some coincidental region‐specific surge in COVID‐19 cases enveloping the Rally period, they are restrictive in drawing counterfactuals from within the same region. In other words, controlling for census division‐specific shocks may come at the expense of a potentially poorer control group of counties drawn from the same region and thus possibly contaminated by spillovers. 32
Taken together, the results in Tables 3 and 4, and Appendix Table 4, provide strong evidence that the Sturgis Rally appears to have been a superspreading event for COVID‐19; we find significant case increases within the state of South Dakota as well as increases extending to counties from which relatively more residents attended the event.
5.4. Did state policies mitigate COVID‐19 spread?
Despite evidence that a large share of variation in mitigation behaviors is driven by voluntary behaviors (Cronin and Evans, 2020; Sears et al., 2020), there is mounting evidence that statewide policy interventions such as shelter‐in‐place orders (Friedson et al., 2020; Courtemanche et al., 2020a; Dave et al., 2020a; 2020b; 2020c) and mask wearing mandates (Lyu and Wehby, 2020) may play an important role in preventing the spread of COVID‐19. In Table 5, we explore whether the nationwide spread of COVID‐19 cases from the Sturgis Rally was moderated by state policies designed to encourage mitigation. Specifically, we examine state mitigation policies in the month following the Rally (largely the month of August, beginning on August 3) and generate an index of strictness of mitigation using the following policies: whether there were state restrictions on openings of (a) restaurants, (b) bars, (c) gyms, (d) movie theaters/entertainment venues, and (e) nonessential retail establishments, (f) whether the state had implemented travel restrictions across state borders, and (g) whether the state had a mask wearing mandate. We define states above the median index value as Stricter Mitigation states (N = 23) and Weaker Mitigation states, as those below the median (N = 27). 33 We then interact these state characteristics with county‐level inflows into Sturgis to descriptively examine whether such policy environments impacted the spread of COVID‐19 as residents returned home from the Rally.
Panel I of Table 5 shows the results from this exercise, with the first two columns showing results using the preferred relative inflow measure and the final two columns showing results using the absolute inflow measure. 34 For ease of exposition, we present main results for the two groups of highest inflow counties, where we previously found evidence of a substantial increase in COVID cases following the events. 35 For the highest relative inflow counties, the findings provide some suggestive evidence that COVID‐19 spread from the Sturgis Rally may have been mitigated by state policies. That is, we find 3 weeks after the start of the Sturgis event, COVID‐19 cases grow by 14.6% in high relative inflow counties nested in states with weak mitigation policies (Column 1). However, in states with stronger mitigation policies, counties with higher inflows into Sturgis saw much lower rates of growth in COVID‐19 cases 1 week after the close of the Sturgis Rally (2.6%; statistically insignificant). This pattern is also evident using the absolute measure of inflows, though estimated effects are not statistically distinguishable from zero (Column 2). When examining more moderate inflow counties, we find less evidence of economically meaningful differences in the effect of the Sturgis Rally on COVID‐19 spread.
In Panel II, we explore which of the policies in our mitigation index are the most important explainers of the heterogeneous treatment effect we identify in Panel I. 36 Our assessment based on Panel II is that restrictions on capacity in restaurants or bars appear to be the most important mitigating policy in home counties. This finding is consistent with evidence in Table 1 showing that the largest increases in foot traffic at Sturgis were in restaurants and bars. Thus, it is not surprising that mitigation policies on these dimensions would have the largest effects in muting COVID‐19 spread. 37
While we cannot rule out that there may be other explanations besides policy differences to explain the heterogeneous inflow effects we observe, they are suggestive of the fact that the local COVID‐19 policy environment may serve as an important defense (or facilitator) of COVID‐19 resulting from a superspreader event. 38
6. CONCLUSION
The Sturgis Rally was the largest public gathering to take place in the country since the start of the COVID‐19 pandemic, representing a confluence of many of the factors that contribute to the spread of infectious disease (CDC, 2020). In this study, we document that the event contributed to substantial community spread both locally and nationally. Locally, we find a significant increase in cases in the county that hosted the event, in the broader cluster that encompasses adjoining counties, and statewide, with larger effects detected with the time lag from the inception of the event. Estimates indicate that, relative to the synthetic counterfactual, the cumulative COVID‐19 caseload in South Dakota increased by between 3.6 and 3.9 cases per 1,000 population, or a total of about 3,088 cases, by the end of the analysis period.
Balancing this rise in infections are the considerable economic benefits generated by the Rally and the ensuing influx of tourism to the state. The 2019 Rally, for instance, was estimated to have brought in over $720 million to the state. 39 In some ways, this static trade‐off between a higher public health toll and higher economic activity encapsulates the compromises apparent in the debates surrounding state and local lockdown and reopening policies. 40 The Sturgis Rally, however, also highlights another important consideration when formulating health policy addressing a pandemic, which is the tension between federalism and the value of more centralized policy making in the presence of large externalities.
The public health costs of the Sturgis Motorcycle Rally did not remain confined to the areas hosting or benefitting from the event. Instead, the spread of the infection diffused nationally, in accordance with the inflow of visitors to the event. Specifically, we find that outside of the state of South Dakota, counties with relatively larger inflows of visitors to the event experienced significantly larger increases in cases compared to counties that supplied no visitors; after about 2 weeks following the end of the Rally, the case rate increased by 6.4–12.5% in such counties. These estimates indicate a total of between 112,195 and 263,708 additional cases in these locations due to the Sturgis Motorcycle Rally. 41 Adding the number of new cases in South Dakota due to the Rally brings the total number of cases to between 115,283 and 266,796.
While these numbers represent a ballpark estimate based on our estimated treatment effects, they underscore the extreme difficulty of using contact tracing alone to estimate the effect of massive, nonsocially distanced gatherings on COVID‐19 spread in the United States. The United States does not have universal contact tracing nor is universal testing required to identify asymptomatic cases. Consequently, as of September 10, contact tracing had identified only 328 cases (from within South Dakota and 20 additional states) that could be linked to the Sturgis Rally, a number that is difficult to reconcile with an in‐person gathering of a half‐million strangers without serious mitigation efforts (CDC, 2020). 42 Moreover, our estimates of the additional number of cases nationwide attributed to the Rally are compatible with basic infectious disease growth modeling under reasonable assumptions. For instance, assuming 10,000 newly infected individuals (among the 460,000 attendees) at Sturgis, a reproductive rate (R0) of 2.5, and a median incubation period of 5 days yields 253,750 cases. 43
If we conservatively assume that all of our estimated Sturgis‐related cases were nonfatal, then these cases represent a cost of between $3.8 and $8.7 billion, based on the statistical cost of the median COVID‐19 case of $32,700 estimated by Kniesner and Sullivan (2020). 44 This is by no means an accurate accounting of the true externality cost of the event, as it counts those who attended and were infected as part of the externality when their costs are likely internalized. 45 However, this calculation is nonetheless useful as it provides a rough estimate as to how large of an externality a single superspreading event can impose. Even if half of the new cases were attendees, the implied externality is still quite large.
Such diffused spillover of costs across areas, which did not have authority over the event that generated the externality and which do not share in the accrued gains, imply a role for policymaking at a broader jurisdiction that encompasses the spillovers. If the externalities are dispersed nationally, as with the Sturgis Rally, this gives a sense of how valuable restrictions on mass gatherings can be in this context and also provides some rationale for a coordinated or, where possible, a national policy response. 46 Our descriptive evidence suggests that spread may have been moderated in states with stricter mitigation policies. In the absence of centralized or coordinated policy restricting the event, stricter mitigation policies in other locations may contribute to limiting externality exposure due to the behavior of noncompliant events and those who travel to them.
Supporting information
Data S1 Supporting Information.
ACKNOWLEDGMENTS
The authors thank Jonathan Cantor, Charles Courtemanche, William Evans, Benjamin Hansen, Devin Pope, and an anonymous referee for helpful comments. Dr. Sabia acknowledges support from the Center for Health Economics & Policy Studies at San Diego State University, which receives grant funding from the Troesh Family Foundation and the Charles Koch Foundation. We thank Alicia Marquez, Kyu Matsuzawa, Melinda Mueller, and Samuel Safford for outstanding research assistance.
Dave D, McNichols D, Sabia JJ. The contagion externality of a superspreading event: The Sturgis Motorcycle Rally and COVID‐19. South Econ J. 2021;87:769–807. 10.1002/soej.12475
Funding information Center for Health Economics & Policy Studies at San Diego State University
Footnotes
For more on these topics see Gruenspecht and Lave (1989); Anger et al. (2011); Carpenter et al. (2011); Abrevaya and Mulligan (2011); Lawler (2017).
See for instance model simulations by the Institute for Health Metrics and Evaluation (IHME; University of Washington) available at: http://www.healthdata.org/covid/faqs.
The City of Sturgis did take some public action. The City provided guidelines to vendors serving food and drink and offered to help businesses acquire personal protective equipment. The City provided health safety guidelines to vendors serving food and drink at the event (O'Kane, 2020). Furthermore, event organizers (a) required attendees of the multi‐day live concert event series, the Sturgis Buffalo Chip Music Festival, to carry masks into the event (Guttierez, 2020), (b) included signs at event entry points recommending social distancing (Griffith, 2020), and (c) warned attendees that some “South Dakota tribal lands may be restricted with checkpoints to protect residents from COVID‐19 exposure” (O'Kane, 2020).
Approximately 50% of attendees every year stay at large campgrounds, such as Buffalo Chip, outside of the city, that hold coinciding events with the Rally but are not subject to the same regulatory restrictions as events happening within Sturgis (Blistein, 2020).
There was also concern from Native American tribal leaders around Sturgis, who set up checkpoints in the months prior to the Rally to question travelers on possible exposure (James, 2020).
The Monument Health Sturgis Hospital confirmed that multiple attendees of the rally had tested positive (Levenson, 2020; Matzen, 2020; Walker, 2020a; Walker, 2020b; Walker, 2020c), and at least one positive case was traced back to a Sturgis bar within two days of the Rally's conclusion (South Dakota News Release August 18, 2020; Levenson, 2020; Coleman, 2020).
To obtain SafeGraph data, see: https://www.safegraph.com/covid-19-data-consortium.
While this measure of social distancing has some limitations—for instance, it would not capture whether an individual engages in social distancing while outside the home or working during nonstandard night shifts, any measurement error introduced in these measures cross‐spatially will not affect our results as we are interested in changes within areas over time.
Affiliated pre‐Sturgis Rally events took place from August 3 through August 6, 2020 (see, for example: https://www.buffalochip.com/BANDS, https://www.buffalochip.com/Portals/0/2012/schedule/2020%20_Daily_Schedule_Updated_8-9-20.pdf?ver=2020-08-09-172919-593) and the main events took place from August 7 through August 16, 2020 (Rally Sturgis, 2020).
High absolute inflows correspond to 400 or more pings (7 counties), moderate‐high absolute inflows correspond to 30–400 pings (526 counties), moderate inflows correspond to 20–30 pings (216 counties), moderate‐low inflows correspond to 10–20 pings (437 counties), low inflows correspond to 1–10 pings (672 counties), and zero inflows correspond to 0 pings (1,386 counties). The latter group also serves as an additional counterfactual, not having sourced any observable travelers to the Sturgis event.
High relative inflows correspond to more than 3.5 relative pings (25 counties), moderate‐high relative inflows correspond to (1 to 3.5] relative pings (157 counties), moderate relative inflows correspond to (.25 to 1] relative pings (648 counties), moderate‐low relative inflows correspond to (.1‐ to 25] relative pings (405 counties), low relative inflows correspond to (0 to .1] relative pings (523 counties), and zero relative inflows correspond to 0 pings (1,386 counties).
To obtain county‐ and state‐level COVID‐19 case and mortality data, see: https://github.com/nytimes/covid-19-data.
Included among the official sites were: Sturgis Dragway, Buffalo Chip, Glencoe Camp Resort, Kickstands Campground, Load American Roadhouse. Iron Horse Saloon, Drag Pipe Saloon and Campground, One Eyed Jack Saloon, Shade Valley Campground, Junction Ave & Main Street, The Historical Sturgis Half Mile, The Hotel Sturgis, Jackpine Gypsies Club, and Cadillac Jack's Gaming Resort.
We omit CBGs from the analysis sample if they did not host Sturgis events but were located in counties where there were CBGs that hosted events since there may be spillovers in terms of travel and foot traffic to these CBGs, and they may be partially “treated.”
The inverse hyperbolic sine approximates the natural log, is interpreted in a similar manner, but has the advantage of retaining areas with zero counts (Bellemare and Wichman, 2020).
Weather data can be obtained at: https://www.ncdc.noaa.gov/.
The unobserved counterfactual for COVID‐19 case or mortality rate for Meade County, Meade County and its border counties county, or the state of South Dakota is given by , where w j is the weight allocated to donor jurisdiction j on day t. The estimated weights are selected for all pretreatment days to minimize the absolute difference between COVID i = Meade, t and . The treatment effect α t is assessed as for t ɛ {August 3, August 16}, which is used to construct the average treatment effect over the post‐treatment window.
We also explored the robustness of our findings to the use of the natural log of daily COVID‐19 cases as our left‐hand side variable. This essentially would make the estimate of α1 the first derivative of the comparable estimate in (2). While daily case rate data tend to be noisier, in the main, our findings from such a specification yield results that are qualitatively similar to those presented in Table 4 of this article. The strongest evidence for COVID‐19 spread is in higher and moderate inflow counties relative to noninflow counties (with point estimates around 0.13 to 0.22, for 24+ days since the onset of the Rally events).
Given that we use variation in inflows to estimate treatment effects, we cluster our standard errors at the county‐level for statistical inference. Clustering at the state‐level generated a qualitatively similar pattern of results.
One of the headlining events, a concert by the band Smash Mouth, took place on August 9, 2 days after the official start of the Sturgis Rally on August 7.
These results persisted when we instead matched on 2 weeks of pretreatment social distancing data as well as state policies with regard to reopening of businesses, COVID‐19 testing, and mask‐wearing mandates (see Appendix Figure 3).
Some of the decrease in median hours spent at home may also reflect an increase in work activity fueled by the events and visitors.
In Appendix Table 1, we list the counties and states that received positive weights in the synthetic control estimates shown in Table 2.
In supplementary analyses, we assessed whether our results are sensitive to constraining the donor pool for Meade County, and for Meade County and its borders, to include only counties (that sourced no or very few visitors to the Rally) from within South Dakota and its neighboring states. The rationale is to draw the synthetic control from proximate nontreated counties in the surrounding region, which may a priori be similar and on similar regional trend paths, and not from distant parts of the country. For synthetic control analyses of South Dakota, we also broadened the donor pool to include all states (in contrast to our preferred analyses, where we had excluded the bordering states that would have been partially treated and thus not constitute valid controls). Our estimates are robust to these alternate definitions of the donor pool.
Specifically, COVID‐19 case pretreatment trends were similar after conditioning on observables, fixed effects, and county‐specific time trends described in Equation (2).
According to our foot traffic data, the peak event period at Sturgis was the weekend of August 8–9 after which differentials in foot traffic between treatment and control CBGs began to decline.
These counties include Jefferson County, Colorado, Weld County, Colorado, Adams County, Colorado, Denver County, Colorado, El Paso County, Colorado, Larimer County, Colorado, Mohave County, Arizona, Maricopa County, Arizona, Los Angeles County, California, San Diego, California, Clark County, Nevada, Anoka County, Minnesota, Hennepin County, Minnesota, Pottawattamie County, Iowa, Woodbury County, Iowa, Jackson County, Missouri, Campbell County, Wyoming, Natrona County, Wyoming, Spokane County, Washington, and Scotts Bluff County, Nebraska.
In Appendix Table 3, we assess the degree to which our findings could be explained by the opening of colleges and universities across U.S. counties. If school openings were related to Sturgis inflows, then our estimates could, theoretically, be biased. However, after interacting an indicator of whether there was a college or university in a county with our lagged Sturgis event windows, the estimated effects of the Sturgis Rally were unchanged.
It also accounts for differential risk of exposure from potential population mixing. For instance, 100 returning residents from the rally to their home county would have different implications for community spread if the home county has a relatively smaller population (than if the home county was more populated).
Moreover, Mangrum and Niekamp (2020) show that traveling to Spring Break led to a 3.7 percentage‐point increase in the COVID‐19 growth rate when students returned to campus.
For consistency, since all estimates are relative to counties with no inflows to the Sturgis rally (the reference category), we include fixed effects for interactions between each census division and the timing windows.
This may explain why the effect magnitudes in Appendix Table 4 are slightly moderated.
South Dakota would be coded as a Weaker Mitigation state, but is excluded from our dose–response analysis. Our stricter mitigation states have at least two mitigation policies.
With the policy variation underlying the heterogeneity analysis at the state level, we generate state‐clustered standard errors. Inferences are not affected if we alternately cluster at the county level.
Appendix Table 5 shows coefficients across all inflow windows.
Appendix Table 6 shows coefficients across all inflow windows.
In unreported results, we explore heterogeneity in the impacts of Sturgis inflows on COVID‐19 spread by the presence of mask‐wearing mandates in home counties, but find little evidence of heterogeneity across this policy margin.
We also explored whether the policy findings could be explained by state political preferences, but found that, in the main, results were not sensitive to controlling for whether the majority of the state's voters supported the Democratic presidential candidate in 2016.
See the 2019 Post Rally Summit, retrieved from: https://www.sturgismotorcyclerally.com/post-rally-summit?_ga=2.206681427.1733691378.1601265484-1046966725.1601265484.
For instance, shelter‐in‐place orders and associated increases in social distancing save lives but can also lead to costs in the form of job‐loss, reduced income, and reduced consumption levels (Dave et al., 2020b). However, since economic and social consequences also go hand in hand, and pandemics can further directly inflict economic costs from the uncertainty, greater morbidity and mortality, and reduced consumption, the nature of the trade‐off changes when considering dynamics over a longer time horizon (Donaldson and Mitton, 2020; Ip, 2020).
These estimates are derived by multiplying each of the statistically significant percent case increases for the relative inflow dose–response results, presented in Table 4 and Appendix Table 4, by each county's respective pre‐Rally cumulative COVID‐19 cases and then aggregating. The lower estimate is based on models which account for unmeasured time‐varying census division‐specific shocks and differential trends across these divisions (reported in Appendix Table 4). It is notable that these latter models are restrictive in that they are drawing counterfactuals from within the same census division, which may moderate estimates if there are spillovers across these areas. Nevertheless, irrespective of the models or the set of counterfactual draws utilized, case estimates from both Table 4 and Appendix Table 4 imply widespread contagion associated with the Sturgis Rally.
Clearly this estimate of Sturgis‐linked COVID‐19 cases from the Associated Press is a vast undercount. Contact tracing requires substantial resources to do well and will severely understate cases when faced with noncompliance, underreporting, lack of universal testing, and the challenges associated with identifying secondary and tertiary spread from asymptomatic cases through self‐reports. These difficulties are magnified multifold when dealing with an event the size of the Sturgis Rally, which attracted almost half million visitors diffused across all corners of the United States.
There were 1.28 million newly confirmed COVID‐19 cases, between July 25 and August 16 (a period that envelopes 10 days prior to the start of the Rally events till the end of the Rally), representing approximately 0.5% of the adult population in the United States. While reported confirmed cases are almost certainly an undercount of the true infection rate (Kniesner and Sullivan, 2020), this prevalence based on confirmed cases would indicate about 2,300 visitors (among the 460,000 attendees) to Sturgis being potentially infected prior to attending the Rally. Assuming an R0 of 2.5, 2,300 infected visitors can infect an additional 5,750 to 20,125 attendees over the course of the Rally. A wide range of estimates exist for the basic reproductive rate, with the CDC utilizing a range from 2.0 to 4.0 and 2.5 as their current “best estimate” in their pandemic planning scenarios (https://www.cdc.gov/coronavirus/2019-ncov/hcp/planning-scenarios.html). Under a reproductive rate of 2.0, 10,000 newly infected individuals among the Sturgis attendees would lead to an additional 140,000 infections nationwide, thus yielding 150,000 COVID‐19 cases attributable to the Rally.
The approximate cost figure of $32,700 is the estimate for a symptomatic case that requires no hospitalization, which is the median case (Kniesner and Sullivan, 2020). They estimate the average economic cost of a nonfatal COVID‐19 case as $46,483, which is based on the distribution of COVID‐19 cases across severity categories (asymptomatic, symptomatic cases that require no hospitalization, those that require non‐ICU hospitalization, those that require ICU admission, and those that require mechanical ventilation). Valued at this average monetized cost of a nonfatal case yields cost estimates of between $5.4 and $12.4 billion. It remains uncertain whether the cases driven by the Sturgis Rally are less or more severe than the median case. Hence, these cost estimates are meant as a suggestive benchmark that may in actuality be lower or higher depending on the severity of the new cases, how many of them are nonfatal versus fatal, and how these costs may vary across U.S. counties.
Estimates from Table 5, which indicated that the increase in cases may have been moderated in places that had relatively stricter containment policies, imply that at least some part of these costs is external, due to community spread from attendees to nonattendees.
Brady et al. (2020) also find evidence of substantial spatial diffusion and spillovers, with cases crossing county lines and the diffusion being impacted by lockdown policies in bordering states. Some prior work (Dave et al., 2020b, 2020c) further finds important heterogeneity in the effects of certain policies such as shelter‐in‐place orders, which implies a role for more nuanced, targeted, and localized approach to policymaking in such cases.
REFERENCES
- Abadie, A. , Diamond, A. and Hainmueller, J. (2010) Synthetic control methods for comparative case studies: estimating the effect of California's tobacco control program. Journal of the American Statistical Association, 105(490), 493–505. [Google Scholar]
- Abouk, R. and Heydari, B . (2020) The Immediate Effect of COVID‐19 Policies on Social Distancing Behavior in the United States . Available at SSRN: https://ssrn.com/abstract=3571421 [Accessed 10th October 2020]. [DOI] [PMC free article] [PubMed]
- Abrevaya, J. and Mulligan, K. (2011) Effectiveness of state‐level vaccination mandates: evidence from the varicella vaccine. Journal of Health Economics, 30(5), 966–976. [DOI] [PubMed] [Google Scholar]
- Ahammer, A. , Halla, M. and Lackner, M. (2020) Mass gatherings contributed to early COVID‐19 mortality: evidence from US sports . Economics Working Papers 2020‐13. Department of Economics, Johannes Kepler University Linz, Austria.
- Ainslie, D. (2020) City of Sturgis Information Publication. Vol 12, Issue 4, April 2020. [Google Scholar]
- Ainslie, D. (2020a) City of Sturgis Monthly Newsletter. Vol 12, Issue 6, June 2020. [Google Scholar]
- Ainslie, D. (2020b) City of Sturgis Monthly Newsletter. Vol 12, Issue 8, August 2020. [Google Scholar]
- Anger, S. , Kvasnicka, M. and Siedler, T. (2011) One last puff? Public smoking bans and smoking behavior. Journal of Health Economics, 30(3), 591–601. [DOI] [PubMed] [Google Scholar]
- Associated Press . (2020) Dozens of coronavirus infections traced back to Sturgis Rally. Los Angeles Times. https://www.latimes.com/world-nation/story/2020-08-25/sturgis-rally-coronavirus-dozens-infections [Accessed 10th October 2020]. [Google Scholar]
- Beer, T . (2020) Dozens of coronavirus cases spread across at least 7 states linked to Sturgis Motorcycle Rally. Forbes, 24 August.
- Bellemare, M.F. & Wichman, C.J. (2020) Elasticities and the inverse hyperbolic sine transformation. Oxford Bulletin of Economics and Statistics, 82(1), 50–61. [Google Scholar]
- Blistein, J . (2020) ‘Freedom‐loving people’: behind the scenes at that controversial smash mouth show in South Dakota. Rolling Stone, 12 August.
- Bonnet, S . (2020b) Sturgis City Council decides 80th rally is on. Rapid City Journal, 15 June.
- Bonnet, S . (2020c) Attendance down, but spending up at 80th Sturgis Motorcycle Rally. Rapid City Journal, 15 August.
- Bottum, F . (2020) Social distancing comes naturally in South Dakota. The Wall Street Journal, 3 April.
- Brady, R.R. , Insler, M. and Rothert, J. (2020) The fragmented United States of America: the impact of scattered lock‐down policies on country‐wide infections. COVID Economics, 43, 42–94. [Google Scholar]
- Brookings Register Staff . (2020) 80 new COVID‐19 cases in S.D. Friday, July 31; one new death. Brookings Register, 31 July.
- Cameron, A.C. and Miller, D.L. (2015) A practitioner's guide to cluster‐robust inference. Journal of Human Resources, 50(2), 317–372. [Google Scholar]
- Cameron, A.C. , Gelbach, J.B. and Miller, D.L. (2008) Bootstrap‐based improvements for inference with clustered errors. Review of Economics and Statistics, 90, 414–427. [Google Scholar]
- Carpenter, C. , Postolek, S. and Warman, C. (2011) Public‐place smoking laws and exposure to environmental tobacco smoke (ETS). American Economic Journal: Economic Policy, 3(3), 35–61. [Google Scholar]
- Center for Disease Control and Prevention . (2020) Deciding to go out , 30 July. Available at: https://www.cdc.gov/coronavirus/2019-ncov/daily-life-coping/deciding-to-go-out.html [Accessed 10th October 2020].
- Census Bureau Geocoder . (2020) Census Geocoder Documentation. US Census: Bureau. [Google Scholar]
- City of Sturgis Motorcycle Rally Concerts . (2020) Concert Series. Available at: https://sturgismotorcyclerally.com/rally-point-concert-series [Accessed 10th October 2020].
- Coleman, J . (2020) Officials warn Sturgis bar patron may have transmitted coronavirus to others. The Hill, 19 August.
- Cotti, C.D. , Cotti, B.E. , Foster, J. , Nesson, E.T. and Niekamp, P.S. (2020) The relationship between in‐person voting and COVID‐19: evidence from the Wisconsin primary. NBER Working Paper No. 27187. [DOI] [PMC free article] [PubMed]
- Courtemanche, C. , Garuccio, J. , Le, A. , Pinkston, J.C. and Yelowitz, A. (2020a) Strong social distancing measures in the United States reduced the COVID‐19 growth rate. Health Affairs, 39(7), 1237–1246. [DOI] [PubMed] [Google Scholar]
- Courtemanche, C.J. , Garuccio, J. , Le, A. , Pinkston, J.C. and Yelowitz, A. (2020b) Did social‐distancing measures in Kentucky help to flatten the COVID‐19 curve? . Available at: http://isfe.uky.edu/research/2020/did-social-distancing-measures-kentucky-help-flattencovid-19-curve [Accessed 10th October 2020].
- Cronin, C. and Evans, W . (2020) Private precaution and public restrictions: what drives social distancing and industry foot traffic in the COVID‐19 era? Working Paper No. 27531. Available at: https://www.nber.org/papers/w27531 [Accessed 10th October 2020].
- Dave, D.M. , Friedson, A.I. , Matsuzawa, K. , McNichols, D. and Sabia, J.J. (2020a) Did the Wisconsin supreme court restart a COVID‐19 epidemic? Evidence from a natural experiment. Working Paper No. 27322. National Bureau of Economic Research. 10.3386/w27322 [DOI]
- Dave, D.M. , Friedson, A.I. , Matsuzawa, K. and Sabia, J.J. (2020b) When do shelter‐in‐place orders fight COVID‐19 best? Policy heterogeneity across states and adoption time. Economic Inquiry. https://onlinelibrary.wiley.com/doi/full/10.1111/ecin.12944. [DOI] [PMC free article] [PubMed] [Google Scholar]
- Dave, D.M. , Friedson, A.I. , Matsuzawa, K. , Sabia, J.J. and Safford, S. (2020c) Were urban cowboys enough to control COVID‐19? Local shelter‐in‐place orders and coronavirus case growth. Journal of Urban Economics, 103294. [DOI] [PMC free article] [PubMed] [Google Scholar]
- Dave, D.M. , Friedson, A.I. , Matsuzawa, K. , Sabia, J.J. and Safford, S. (2020e) Black lives matter protests, social distancing, and COVID‐19. Working Paper No. 27408. Working Paper Series. National Bureau of Economic Research. 10.3386/w27408. [DOI]
- Dave, D.M. , Friedson, A.I. , Matsuzawa, K. , McNichols, D. , Redpath, C. and Sabia, J.J. (2020f) Risk aversion, offsetting community effects and COVID‐19: evidence from an indoor political rally. Working Paper No. 27552. Working Paper Series. National Bureau of Economic Research. Available at: https://www.nber.org/papers/w27522 [Accessed 10th October 2020].
- Donaldson, C. and Mitton, C. (2020) Health economics and emergence from COVID‐19 lockdown: the great big marginal analysis. Health Economics, Policy and Law, 1–5. https://www.cambridge.org/core/services/aop‐cambridge‐core/content/view/5A9336EC7735D79E10A9B9844A01BA61/S1744133120000304a.pdf/health‐economics‐and‐emergence‐from‐covid‐19‐lockdown‐the‐great‐big‐marginal‐analysis.pdf [Accessed 10th October 2020]. [DOI] [PMC free article] [PubMed] [Google Scholar]
- Ebrahim, S.H. and Memish, Z.A. (2020) Saudi Arabia's drastic measures to curb the COVID‐19 outbreak: temporary suspension of the Umrah pilgrimage. Journal of Travel Medicine, 27(3) p.taaa029. https://watermark.silverchair.com/taaa029.pdf?token=AQECAHi208BE49Ooan9kkhW_Ercy7Dm3ZL_9Cf3qfKAc485ysgAAAsQwggLABgkqhkiG9w0BBwagggKxMIICrQIBADCCAqYGCSqGSIb3DQEHATAeBglghkgBZQMEAS4wEQQM0l6KmIChrhXwtH‐mAgEQgIICd_6pmaZDY1‐dvHcMOGk5KknsC6MPoUeiIHEpaaOwG0nQrJu_pPKGOolsMPtmJMHzqIyTP3atb4eA2amq9zX27‐rV8L5r2LLHJcNXByPW7vVUoxUpIfasc3svT22Tnn12vRSmaSHbswWqUgaPyoNFc8llDecS6FHFgknbz0CXZwPBIiPaFv9bDSfpg5Q6bYTLTOGgKdzuly6SK9WZljL0D9wVKiTQR4gskxQ4EeU5Qi2yVUUw6qnnNQheZodnADDjCim2tlH31ChDGOJ9ussVBmVcMdj7uTCUCVXaC_ngn5Z0d5Os‐YQ_YCnThBmX9JCp6pAFVFa_vl7ktsONYUWOtX4X8y98Crf9Yur_Q1UxA8Ynucy742ydFKR9hg6Z4MaCYS2jDXU‐Mh4BZSTcZIOPgEApcGn‐C0m4_7tTyQQp_d3UpZczX5dXuhEB9B94uMalAGfKJoKvMCIAJHWtUnk8xpuhH1l8T241dgG11irH‐leQg2vutFJNREYpBFc3C3xEZNncISZIVoPdAC6EdxTDHFllPBuBP81F2n0AH4Vg34pZKKOHuhE3sKcUh8WiEdhVPPHxW2CKutYpVmMfSDPHoDeD9wphShdE‐mWARFpjl78ayTkPoCy99lMRZF9KbkVokShhyvu9lxxgKvF34EL9wcbiMIt1_B2PGV4mg8GPc5jrvPweB1umBePkz_n5fJcGtloUWWqFMMOSDxC6fpeXgVwcdtQjdJJAOfxCZH‐8GgJ7zmtPAzsLakr54FpNlrSs6ZyFK6WLUkAQZDXJKIWiaTGKse5XQoKis95XwSj76GZwqUnvh1KDcYz6uFqWsmgcQ6p3duSVX4g [Accessed 10th October 2020]. [DOI] [PMC free article] [PubMed] [Google Scholar]
- Friedson, A.I. , McNichols, D. , Sabia, J.J. and Dave, D. (2020) Shelter‐in‐place orders and public health: evidence from California during the COVID‐19 pandemic. Journal of Policy Analysis and Management [In Press]. [Google Scholar]
- Griffith, J . (2020) Smash Mouth singer mocks coronavirus pandemic at packed Sturgis Motorcycle Rally concert. NBC News, 11 August.
- Groves, S . (2020a) Annual Sturgis rally expecting 250K, stirring virus concerns. AP News, 4 August.
- Groves, S . (2020b) Harleys everywhere, masks nowhere: 80th Sturgis Motorcycle Rally draws thousands. The Chicago Tribune, 7 August.
- Groves, S . (2020c) Bikers descend on Sturgis rally with few signs of pandemic. AP News, 8 August.
- Gruenspecht, H.K. and Lave, L.B. (1989) The economics of health, safety, and environmental regulation. Handbook of industrial organization, 2, 1507–1550. [Google Scholar]
- Guttierez, J . (2020) The Sturgis Buffalo Chip is preparing for a safe and eventful rally. News Center, 23 July.
- Ip, G . (2020) Economics vs. epidemiology: quantifying the tradeoff. The Wall Street Journal, 15 April.
- Kniesner, T.J. and Sullivan, R. (2020) The forgotten numbers: a closer look at COVID‐19 non‐fatal valuations. Available at: SSRN 3680348. [DOI] [PMC free article] [PubMed]
- Knowles, H . (2020) Covid cases are linked to the Sturgis Motorcycle Rally, but the full impact may never be known. The Washington Post, 21 August.
- Knowles, H. and Lati, M . (2020) Sturgis Motorcycle Rally in South Dakota expected to draw 250,000, stoking virus fears. The Washington Post, 8 August.
- Lasry, A. , Kidder, D. , Hast, M. , Poovey, J. , Sunshine, G. , Zviedrite, N. , Ahmed, F. and Ethier, K.A. (2020) Timing of community mitigation and changes in reported COVID‐19 and community mobility―four U.S. metropolitan areas, February 26–April 1, 2020. CDC Morbidity and Mortality Weekly Report , April 17. Available at: https://www.cdc.gov/mmwr/volumes/69/wr/mm6915e2.htm?s_cid=mm6915e2_x [Accessed 10th October 2020]. [DOI] [PMC free article] [PubMed]
- Lauer, S.A. , Grantz, K.H. , Bi, Q. , Jones, F.K. , Zheng, Q. , Meredith, H.R. , Azman, A.S. , Reich, N.G. and Lessler, J. (2020) The incubation period of coronavirus disease 2019 (COVID‐19) from publicly reported confirmed cases: estimation and application. Annals of Internal Medicine, 172, 577–582. [DOI] [PMC free article] [PubMed] [Google Scholar]
- Lawler, E.C. (2017) Effectiveness of vaccination recommendations versus mandates: evidence from the hepatitis A vaccine. Journal of Health Economics, 52, 45–62. [DOI] [PubMed] [Google Scholar]
- Lee , et al. (2020) See Coronavirus Restrictions and Mask Mandates for All 50 States. The New York Times. https://www.nytimes.com/interactive/2020/us/states-reopen-map-coronavirus.html. [Accessed 10th October 2020].
- Levenson, E. (2020) A person with Covid‐19 may have exposed others at a bar during Sturgis Motorcycle Rally. CNN, 19 August.
- Lyu, W. and Wehby, G. (2020) Community use of face masks and COVID‐19: evidence from a natural experiment of state mandates in the US. Health Affairs, 39(8), 1419–1425. [DOI] [PubMed] [Google Scholar]
- Mangrum, D. and Niekamp, P. (2020) College student contribution to local COVID‐19 spread: evidence from university spring break timing , 20 May. Available at SSRN: https://ssrn.com/abstract=3606811 or 10.2139/ssrn.3606811. [Accessed 10th October 2020]. [DOI]
- Matthews, G . (2020) Health department reports 80 new COVID‐19 cases Friday. KBHD Radio, 31 July.
- Matzen, M . (2020) DOH reports three COVID‐19 cases at BHSU, one from Sturgis rally so far. Rapid City Journal, 17 August.
- Maxouris, C . (2020) 60% of Sturgis residents were against a motorcycle rally that brings in thousands but the city approved it. Here's why. CNN. Available at: https://www.cnn.com/2020/08/10/us/sturgis-motorcycle-rally-residents-decision/index.html [Accessed 10th October 2020]. [Google Scholar]
- McCann, A . (2020) States with the fewest coronavirus restrictions. WalletHub, 11 August.
- McKinley, J. and Gold, M. (2020) Ban on Large Gatherings in N.Y. as Coronavirus Cases Rise Sharply. The New York Times. https://www.nytimes.com/2020/03/12/nyregion/coronavirus-nyc-event-ban.html [Accessed 10th October 2020]. [Google Scholar]
- Mervosh, S. , Lu, D. and Swales, V. (2020) See which states and cities have told residents to stay at home. The New York Times, 20 April.
- Moini . (2020) Aug. 3 update on COVID‐19 in MN: ICU cases up; Sturgis may be ‘recipe’ for spread. MPR News, 3 August. https://www.mprnews.org/story/2020/08/03/latest-on-covid19-in-mn [Accessed 10th October 2020].
- MPR News Staff . (2020) Aug. 3 update on COVID‐19 in MN: ICU cases up; Sturgis may be ‘recipe’ for spread. MPR News, 3 August.
- Nord, N. (2020) Sturgis braces for record crowds at 75th annual motorcycle rally. Casper Star Tribune. https://trib.com/news/state-and-regional/sturgis-braces-for-record-crowds-at-75th-annual-motorcycle-rally/article_9d746453-1642-5fd5-8e2b-7c40f42cf6d9.html [Accessed 10th October 2020]. [Google Scholar]
- North Star Meeting Group . (2020) Where Can You Hold Events? Here's the State‐by‐State Reopening Status. Available at: https://www.northstarmeetingsgroup.com/News/Industry/Coronavirus-states-cities-reopening-COVID-19-new-cases [Accessed 10th October 2020].
- O'Kane, C . (2020) 400,000 bikers usually descend on this South Dakota town for their annual rally. And it's still happening—despite COVID‐19. CBS News, 7 August.
- Orecchio‐Egresitz . (2020) Sturgis Motorcycle Rally attendees lounge in bikinis, pack into bars, and mock mask wearers: ‘It's like COVID does not exist here’. Insider, 10 August.
- Pereira, I . (2020) A tale of two pandemics: how coronavirus split the map of the US. ABC News, 1 May.
- Porterfield, C . (2020) Sturgis Motorcycle Rally attracts thousands, with few masks and little social distancing (photos). Forbes, 8 August.
- Rally Sturgis . (2020) Sturgis rally ride maps . Available at: https://rallysturgis.com/ride-maps [Accessed 10th October 2020].
- Sears, J. , Villas‐Boas, J.M. , Villas‐Boas, V. and Villas‐Boas, S . (2020) Are we #StayingHome to flatten the curve? , 25 May. Department of Agricultural and Resource Economics. CUDARE Working Papers. Available at SSRN: https://ssrn.com/abstract=3569791 [Accessed 10th October 2020].
- Secon, H . (2020) An interactive map of the US cities and states still under lockdown—and those that are reopening. Business Insider, 3 June.
- Shammas, B . (2020) South Dakota Bureau of Human Resources. (2020). On‐site health screening, 10 September. Available at: https://bhr.sd.gov/benefits/active/benefit/on-site-health-screening/ [Accessed 10th October 2020].
- South Dakota Department of Health . (2020) South Dakota's back to normal plan . Available at: https://doh.sd.gov/documents/COVID19/COVID_SDPlan_BackToNormal.pdf [Accessed 10th October 2020].
- South Dakota Department of Transportation . (2020) Sturgis Motorcycle Rally traffic counts 2011–2020 . Available at: https://dot.sd.gov/media/documents/traffic/2020RallyTrafficReport.pdf [Accessed 10th October 2020].
- Sturgis Buffalo Chip . (2020) 2020 Sturgis Buffalo chip schedule. Sturgis Buffalo Chip . Available at: https://www.buffalochip.com/EVENTS/Daily-Schedule [Accessed 10th October 2020].
- The New York Times . (2020) South Dakota Coronavirus map and case count , 31 August. Available at: https://www.nytimes.com/interactive/2020/us/south-dakota-coronavirus-cases.html [Accessed 10th October 2020].
- Thorson, S . (2020) 80th annual Sturgis Motorcycle Rally is officially over, businesses and residents back to normal. Keloland, 17 August.
- Walker, M . (2020a) ‘Boxed into a corner,’ Sturgis braces for thousands to attend motorcycle rally. The New York Times, 6 August.
- Walker, M . (2020b) ‘If we get it, we chose to be here’: despite virus, thousands converge on Sturgis for huge rally. The New York Times, 7 August.
- Walker, M . (2020c) Sturgis Motorcycle Rally rolls to a close as virus tracking remains complex. The New York Times, 17 August.
- Whateley, D . (2020) Health officials in 3 states have traced new COVID‐19 cases to the Sturgis Motorcycle Rally where hundreds of thousands of bikers gathered. Business Insider, August 22.
- Wing, C. , Simon, D.H. and Carlin, P. (2020) Effects of large gatherings on the COVID‐19 epidemic: evidence from professional and college sports , July 21. Available at SSRN: https://ssrn.com/abstract=3657625 or 10.2139/ssrn.3657625 [Accessed 10th October 2020]. [DOI] [PMC free article] [PubMed]
- World Population Review . (2020) South Dakota Population 2020. Available at: https://worldpopulationreview.com/states/south-dakota-population [Accessed 10th October 2020].
- Yost, R . (2020) Sturgis rally traffic count not far from 2019's numbers. Keloland, August 18.
- 80th Sturgis Rally Events Schedule . (2020) 80th Annual Sturgis Motorcycle Rally. Available at: https://www.blackhillsbadlands.com/special-event/sturgis-motorcycle-rally [Accessed 10th October 2020].
Associated Data
This section collects any data citations, data availability statements, or supplementary materials included in this article.
Supplementary Materials
Data S1 Supporting Information.