

Abstract
Osteosarcoma (OS) is one of the most common metastatic bone cancers, which results in significant morbidity and mortality. The important role of long non‐coding RNAs (lncRNAs) in the biological processes of OS has been demonstrated through several studies. In the current study, we evaluated the role of the lncRNA, LINC01128, in OS. We analysed the expression of LINC01128 in three OS gene expression omnibus (GEO) data sets GSE21257, GSE36001 and GSE42352. The expression of LINC01128 in OS tissues and matched non‐tumour tissues obtained from 50 OS patients was detected using qRT‐PCR. The association between LINC01128 expression and overall survival of OS patients was evaluated using the Kaplan‐Meier method. The effects of LINC01128 knockdown and overexpression were evaluated through in vitro and in vivo assays. The LINC01128/miR‐299‐3p/ MMP2 axis was verified using dual‐luciferase reporter assay and qRT‐PCR assays. GEO data sets analysis revealed that the expression of LINC01128 was increased in OS. Elevated LINC01128 expression was accompanied by shorter overall survival in OS patients. Functional studies revealed that LINC01128 knockdown reduced the proliferation, migration and invasion of OS cells both in vitro and in vivo. Mechanistically, LINC01128 sponged miR‐299‐3p to increase MMP2 expression. Rescue assays determined the role of the LINC01128/miR‐299‐3p/MMP2 axis in the proliferation, migration and invasion of OS cells. Additionally, the Wnt/β‐catenin signalling pathway was activated by LINC01128 and MMP2 in OS cell lines. In summary, this study demonstrates that LINC01128 facilitates OS by functioning as a sponge of miR‐299‐3p, thus promoting MMP2 expression and activating the Wnt/β‐catenin signalling pathway.
Keywords: bone tumour, ceRNA, invasion, lncRNA, proliferation
1. INTRODUCTION
Osteosarcoma (OS) is the most frequent primary malignant bone tumour and occurs primarily in children and young adolescents. 1 , 2 It is characterized by mesenchymal cells, with a high degree of genetic heterogeneity, that produce immature bone and osteoid. 3 , 4 In the 1970s, amputation was the only intervention for OS patients, and the 5‐year survival rate was <20%. The development of chemotherapy has significantly improved life expectancy, and the 5‐year survival rate is currently 65%‐70%. 5 , 6 , 7 Nevertheless, with the changes in the management strategies, the overall survival rate for ten years has stabilized since the 1990s. 8 , 9 , 10 Moreover, no breakthrough has been made in the fields of clinical and scientific research of OS. Therefore, a better understanding of the biological processes and pivotal mechanisms promoting OS tumorigenesis and development are extremely important to improve the efficacy of treatments and prognosis in OS patients.
Long non‐coding RNAs (lncRNAs) are a type of RNA with lengths exceeding 200 nucleotides that do not encode proteins. 11 LncRNAs have attracted increasing attention as cancer biomarkers for early screening, diagnosis, prognosis and response to drug treatment. 12 , 13 , 14 Although several lncRNAs including lncRNA ODRUL, 11 , 15 SNHG15, 16 SNHG16, 17 SNHG4 18 and AFAP1‐AS 19 have been confirmed to be highly correlated with OS, no widely applicable therapeutic targets have not been identified thus far. LINC01128 has been reported to be associated with acute myeloid leukaemia 20 and cervical cancer. 21 However, whether LINC01128 is involved in the pathophysiology of OS remains unknown.
In this study, we screened LINC01128 as a potential OS target through the analyses of three GEO databases and evaluated its expression in tissues from OS patients and cell lines. We performed functional studies and investigated its molecular mechanism in OS.
2. MATERIAL AND METHODS
2.1. Collection of samples
OS tissue samples and matched adjacent non‐tumour tissues (fifty pairs) were collected from patients who underwent surgery at our hospital. Informed consents were obtained from all the patients or their guardians. None of the patients received chemotherapy prior to the surgery. Tissue samples were collected during definitive surgery and stored in liquid nitrogen until use. All patients were diagnosed with OS based on histopathological examination.
2.2. Cell culture
The cell bank of the Chinese Academy of Sciences (Shanghai, China) provided the OS cell lines (Saos2, MG63, U2OS and HOS) and a human normal osteoblast cell line hFOB1.19. MG63, HOS and U2OS cells were cultured in alpha minimal essential medium (α‐MEM; HyClone, Logan, UT, USA) supplemented with 10% foetal bovine serum (FBS; Gibco, Carlsbad, CA, USA). Saos2 cells were cultured in Rosewell Park Memorial Institute 1640 (RPMI‐1640) medium (Gibco, USA) supplemented with 15% FBS. hFOB1.19 cells were cultured in Ham's F12/Dulbecco's modified Eagle's medium (DMEM, Gibco) supplemented with 10% FBS, 100 U/mL penicillin and 100 mg/mL streptomycin (Invitrogen, Grand Island, NY, USA). All four human OS cell lines were maintained in a humidified incubator at 37°C with a 5% CO2. The hFOB 1.19 cell line was maintained at 33.5°C with a 5% CO2.
2.3. RNA transfection
ShRNAs against LINC01128, matching negative control (sh‐NC), shRNAs against MMP2 (sh‐MMP2) and its matching negative control (sh‐NC) were commercially acquired and synthesized by Ribo Bio Corporation (Guangzhou, China). For the knockdown of miR‐299‐3p, miR‐299‐3p mimics, miR‐299‐3p inhibitor and their corresponding NCs (inhibitor‐NC and miR‐NC) were synthesized by Ribo Bio Corporation.
Lentiviral infection was used to generate various stably transfected cell lines. Briefly, 293T cells were co‐transfected with packaging plasmids as well as viral vectors. After 48 hours of transfection, the culture medium was supplemented with 5 μg/mL polybrene, filtered through a 0.45 μm filter and used to infect the target cells. After 36 hours of infection, the cells were selected in culture medium containing 2 μg/mL puromycin.
2.4. Extraction of RNA and qRT‐PCR analysis
Total RNA was isolated from the OS tissues or cultured cells using TRIzol® reagent (Invitrogen, Carlsbad, CA, USA). The RNA was reverse transcribed into cDNAs using Transcriptor First Strand cDNA Synthesis kit (Roche Diagnostics, Pleasanton, CA, USA) at 37°C for 15 min and 85°C for 5 s following the manufacturer's instructions. qPCR was performed using the SYBR Green PCR kit (Applied Biosystems, Foster City, CA, USA) by initial denaturation at 94°C for 5 minutes, followed by 40 cycles including denaturation at 94°C for 30 seconds, annealing at 55°C for 30 seconds and extension at 72°C for 90 seconds. The relative expression level was calculated using the 2−ΔΔCt method and glyceraldehyde 3‐phosphate dehydrogenase (GAPDH) or U6 was used as an endogenous reference gene. Primers used in the PCR are listed in Table S1.
2.5. Counting Kit‐8 (CCK‐8) assay
OS cell proliferation was determined using the CCK‐8 assay. Specifically, U2OS and Saos2 cells were plated at 2 × 10³ cells/well in 96‐well plates (containing complete growth medium) and incubated in a moist environment with 5% CO2 at 37°C for 12 hours CCK‐8 reagent (10 μL/well; Dojindo, Japan) was added on days 1, 2, 3 and 4 followed by continuous incubation at 37°C for 2 hours and a microplate reader (Bio‐Rad, Hercules, CA, USA) was used to read the absorbance at 450 nm.
2.6. 5‐ethynyl‐2’‐deoxyuridine (EdU) incorporation assay
Saos2 and U2OS cells were plated at 8 × 10³ cells/well in a 96‐well plate and incubated overnight, followed by transfection for 48 hours. Subsequently, EdU solution (25 μmol/L) was added to the cell culture medium and the cells were incubated for 4 h. After fixing in 4% paraformaldehyde for 30 minutes and permeabilizing with 0.5% Triton X‐100 (Sigma, St. Louis, MO, USA) for 10 minutes, the cell nuclei were stained using DAPI (5 μg/mL) for 10 minutes. The images were collected using a fluorescent microscope (Leica, Wetzlar, Germany), and the EdU‐positive cells were quantified in five randomly selected fields.
2.7. Colony formation assay
U2OS or Saos2 cells (~1 × 10³ cells/well) were plated in 6‐well plates. Cells were fixed with methanol and stained with 0.1% crystal violet after 14 days. Colonies containing over 50 cells in size were counted manually. The experiments were repeated thrice to obtain the average colony formation rate.
2.8. Wound healing assay
Cells were cultured in 6‐well plates. When the cells reached 90% confluence, the cell layers were scratched using a 20 μL tip to form wounded gaps, gently washed to remove displaced cells and cultured for 24 hours. The wounded gaps were photographed at different time points with the same microscope setting, and the gap width covered by the migrating cells in different areas of each wound was measured and analysed.
2.9. Invasion assay
Invasion assay was performed using Transwell pre‐coated Matrigel chambers according to the manufacturer's protocol (BD Science, Bedford, MA, USA). For cell invasion assay, 800 µl medium supplemented with 10% FBS was added to the lower well, and 5 × 10⁵ cells in 100 µL serum‐free medium were seeded into the upper chamber of a Transwell plate. After 24 hours of incubation, 10‐min cell fixation was performed in 4% polymethanol, followed by 20 minutes staining using 0.1% crystal violet (Beyotime, Nantong, China). The invasion rate was quantified by counting the invasive cells in at least three random fields.
2.10. In vivo assay
Male BALB/c nude mice (6‐week‐old) were purchased from Vital River Laboratories Company (Beijing, China) and maintained in special pathogen‐free (SPF) condition. The animal experiments were carried out in strict accordance with the recommendations in the Guide for the Care and Use of Laboratory Animals of the National Institutes of Health. The mice were cultured under standard conditions (24°C ± 2°C, 50 ± 10% relative humidity, 12‐hours light/dark cycles) and with unlimited access to standard rodent maintenance feed (KEAO XIELI FEED Co., Ltd., Beijing, China) and water. Hygienic conditions were maintained by weekly cage changes. Animal health and behaviour were monitored every day, and body weights were assessed weekly over the course of the study. Mice were injected with 5 × 10⁶ Saos2 cells that stably express sh‐NC or sh‐LINC01128, subcutaneously in both flanks. Tumours were measured once a week with a calliper and the tumour volume (mm3) was calculated as 0.5 × Length × Width2. All animals were killed by overdose (>120 mg/kg body weight) intraperitoneal injection of pentobarbital after 28 days. The death was verified by loss of spontaneous breathing. The xenograft tumour tissues were sampled for subsequent analyses.
2.11. Nuclear and cytoplasmic fractionation
Nuclear and cytoplasmic fractionation assay was performed using the PARIS™ kit (Invitrogen) following the manufacturer's instructions. Cell fractionation solution was used to lyse the Saos2 and U2OS cells, followed by centrifugation to isolate the cytoplasmic fractions. Next, the remaining cytoplasmic fractions were discarded and the cell supernatant was placed into cell disruption buffer and incubated on ice. The cell supernatant and lysate were suspended in a mixture consisting of equal volume of 2 × lysis/binding and ethanol. Finally, the nuclear and cytoplasmic RNAs were eluted and extracted using TRIzol reagent (Life Technologies, Carlsbad, CA, USA). GAPDH was used as the cytoplasmic control, while U6 as the nuclear control.
2.12. Luciferase reporter assay
Wild‐type (Wt) and mutant (Mut) fluorescent plasmids corresponding to LINC01128 and MMP2 (LINC01128‐Wt, MMP2‐Wt, LINC01128‐Mut and MMP2‐Mut) were obtained from Promega Corporation (Fitchburg, Wisconsin, USA). Following plating in 96‐well plates, 293T cells were co‐transfected with miR‐299‐3p mimics or miR‐NC. Renilla luciferase activity was used for normalization of the luciferase activity. A dual‐luciferase reporter assay system (Promega) was used for the luciferase reporter assay.
2.13. Western blotting assay
The concentration of protein was determined using the BCA Protein Assay kit (Beyotime, Nantong, China). The samples (40 µg protein per lane) were separated by sodium dodecyl sulphate polyacrylamide gel electrophoresis (SDS‐PAGE, 10% gel) and transferred to a Hybond membrane (Amersham, Germany). The membrane was blocked with 5% skimmed milk for 2 hours, followed by incubation with MMP2 (ab97779) and c‐Myc (ab39688), β‐catenin (ab16051), GAPDH (ab181602) and cyclin D1 (ab227561) primary antibodies (diluted at 1:1000; Abcam, UK) at 4°C overnight. The membranes were rinsed with Tris‐buffered saline‐Tween (TBST) thrice followed by incubation with secondary antibodies for 2 hours. Enhanced chemiluminescence (ECL) reagent (Santa Cruz Biotechnology, CA, USA) was used to visualize the protein bands in the dark. The protein bands were analysed using ImageJ software (version 1.48; NIH; National Institutes of Health, Bethesda, MD, USA).
2.14. Statistical analysis
SPSS 22.0 software (SPSS Inc, Chicago, IL, USA) was used for statistical analyses. The data of all assays (tested individually at least thrice) in this study are expressed as the mean ± standard deviation (SD). The statistically significant differences between the two groups were determined using Mann‐Whitney U test, Wilcoxon signed‐rank test or two‐tailed Student's t test, where appropriate. The comparisons among different groups (>2 groups) were analysed by one‐way analysis of variance (one‐way ANOVA) with a Tukey's post hoc test. Data concerning the association of LINC01128 expression with clinicopathological features of OS are analysed by chi‐squared test and Fisher's exact test. Additionally, the log‐rank test and Kaplan‐Meier method were used to evaluate the overall survival. Expression correlations were investigated using Pearson correlation analysis. P < .05 was considered statistically significant.
3. RESULTS
3.1. LINC01128 level is increased in OS and associated with poor prognosis in OS patients
First, we analysed three OS GEO data sets GSE21257, GSE36001 and GSE42352 (Figures [Link], [Link], [Link]). After merging and comparing of the data sets, we identified ten highly expressed genes (Figure 1A). LINC01128 was the only lncRNA retrieved among them. With the objective to study the pathogenesis of OS from an epigenetic perspective, we chose to focus on LINC01128. qRT‐PCR assay for LINC01128 expression in the OS tissues and matched non‐tumour tissues obtained from 50 OS patients demonstrated that OS tissues displayed higher expression of LINC01128 relative to the paired paracancerous tissues (Figure 1B). Similarly, LINC01128 was also found to be expressed at a higher level in the OS cell lines (Saos2, MG63, U2OS and HOS) relative to that in the human normal osteoblast hFOB1.19 cells (Figure 1C). Based on the median expression level of LINC01128 in the 50 pairs of tissue specimens, they were classified into high and low LINC01128 expression groups. The overall survival rate of OS patients in high LINC01128 expression group was significantly lower than that in the low LINC01128 expression group (Figure 1D). The association between LINC01128 expression and OS clinicopathological features is presented in Table 1. It was discovered that increased LINC01128 was observably correlated with tumour size, distant metastasis and clinical stage, but other clinical and pathological characteristics such as age and gender were found to have no evident association with LINC01128 expression.
FIGURE 1.

LINC01128 expression is associated with poor prognosis in OS patients. (A) Three osteosarcoma GEO data sets (GSE21257, GSE36001, GSE42352) were analysed and ten highly expressed genes were identified from the intersection. (B) QRT‐PCR analysis of LINC01128 expression in 50 pairs of OS and normal tissues obtained from OS patients. (C) LINC01128 expression in OS cell lines and in hFOB1.19. (D) Kaplan‐Meier curve showing the overall survival of OS patients stratified based on LINC01128 expression. * P < .05, ** P < .01 and *** P < .001
TABLE 1.
Association of LINC01128 expression with clinicopathological features of osteosarcoma
| Feathers | Number | High | Low | P‐value |
|---|---|---|---|---|
| All cases | 50 | 25 | 25 | |
| Age(y) | ||||
| <18 | 26 | 12 | 14 | .7775 |
| ≥18 | 24 | 13 | 11 | |
| Gender | ||||
| Male | 28 | 14 | 14 | >.9999 |
| Female | 22 | 11 | 11 | |
| Tumour size (cm) | ||||
| <5 | 21 | 6 | 15 | .0209 |
| ≥5 | 29 | 19 | 10 | |
| Distant metastasis | ||||
| Absent | 23 | 17 | 6 | .0041 |
| Present | 27 | 8 | 19 | |
| Clinical stage | ||||
| I‐IIA | 24 | 6 | 18 | .0016 |
| IIB‐III | 26 | 19 | 7 | |
Total data from 50 tumour tissues of osteosarcoma patients were analysed. For the expression of LINC01128 was assayed by qRT‐PCR, the median expression level was used as the cut‐off. Data were analysed by chi‐squared test and Fisher's exact test. P‐value in bold indicates statistically significant.
3.2. LINC01128 affects the proliferation, migration and invasion of OS cells
LINC01128 gain‐ or loss‐of‐function was performed in U2OS and Saos2 cells using LINC01128 overexpression construct or shRNA, respectively. Figure 2A shows the transfection efficiency of sh‐LINC01128 and LINC01128 overexpression in Saos2 and U2OS cells. CCK‐8 and EdU, assays confirmed that sh‐LINC01128 inhibited the proliferation of OS cells, while overexpression of LINC01128 promoted cell proliferation (Figure 2B, C). Interestingly, we also observed similar phenomenon in the hFOB1.19 cells (Figure S5). Colony formation assays further verified these results by showing that the number and size of all cell colonies were enhanced by LINC01128 up‐regulation and inhibited by sh‐LINC01128 compared with the control group (Figure 2D). Additionally, wound healing assay showed that sh‐LINC01128 inhibited the migration of OS cells, while overexpression of LINC01128 promoted cell migration (Figure 3A). Invasion assay also revealed that the invasion of Saos2 cells was inhibited by sh‐LINC01128, and conversely, invasion of U2OS cells was promoted by overexpression of LINC01128 (Figure 3B). These findings indicate that high LINC01128 level stimulates the growth and metastasis of OS cells.
FIGURE 2.

Effect of LINC01128 on the proliferation of OS cells. (A) Transfection efficiency of sh‐LINC01128 and LINC01128 overexpression vector. (B) CCK‐8, (C) EdU (bar = 100 μm) and (D) colony formation assays confirmed the effect of LINC01128 knockdown and overexpression on the proliferation of OS cells. * P < .05, ** P < .01 and *** P < .001
FIGURE 3.

Effect of LINC01128 on migration and invasion of OS cells. (A) Migration of Saos2 and U2OS cells were analysed using wound healing assay (bar = 100 μm). (B) Invasion of Saos2 and U2OS cells were analysed using Transwell assay (bar = 100 μm). ** P < .01 and *** P < .001
3.3. Down‐regulation of LINC01128 inhibits tumour growth and metastasis in vivo
An in vivo xenograft model of OS growth was generated by transplanting Saos2 cells subcutaneously into mice. Using this model, we found that the LINC01128 knockout group (sh‐LINC01128) exhibited significantly less tumour propagation than the sh‐NC group (Figure 4A). The average volume and weight of the xenograft tumours in the sh‐LINC01128 group were lower than that in the sh‐NC group (Figure 4B and C). Staining of the tumour sections revealed that the expression level of MMP2 and Ki‐67 was higher in the sh‐NC group compared with the sh‐LINC01128 group (Figure 4D). To evaluate the potential involvement of LINC01128 in lung metastasis, we additionally generated a metastatic model and found that the number of lung metastases was clearly lower in the sh‐LINC01128 group compared with the sh‐NC group (Figure 4E). Together, these findings indicate that LINC01128 is involved in the propagation and metastasis of OS in vivo.
FIGURE 4.

Sh‐LINC01128 inhibits the OS tumour growth and metastasis. (A) Xenograft OS tumours. (B) Growth of xenograft tumours formed by sh‐LINC01128 cells is slower than that of xenograft tumours formed by sh‐NC cells. (C) Mean weight of xenograft tumours. (D) Sh‐LINC01128 markedly reduced MMP2 and Ki‐67 in tumours compared with negative control (bar = 50 μm). (E) Representative macroscopic and microscopic images (H&E staining) of the lung tissue sections. **P < .01 and ***P < .001
3.4. LINC01128 functions as a molecular sponge of miR‐299‐3p
We examined whether LINC01128 modulates gene expression through acting as a miRNA sponge. The localization of LINC01128 in the OS cells was assessed through subcellular fractionation assay and found to be enriched in the cytoplasm in OS cells (Figure 5A). Through StarBase (http://starbase.sysu.edu.cn/) analysis, we found that there are multiple miRNAs interacting with LINC01128. According to the level of 'clip ExpNum', we selected the top 20 miRNAs as the potential target miRNAs with the strongest interaction with LINC01128 (Table S2). Among the 20 potential target miRNAs, miR‐299‐3p is the most obviously down‐regulated miRNA in OS tissues (Figure S4). Thus, miR‐299‐3p was selected as the potential target of LINC01128. The putative binding sites shared by LINC01128 and miR‐299‐3p are shown in Figure 5B. Dual‐luciferase reporter assay in 293T cells revealed that overexpression of miR‐299‐3p reduced the luciferase activity of LINC01128‐Wt, but not that of LINC01128‐Mut (Figure 5C). Based on qRT‐PCR results, it was demonstrated that miR‐299‐3p expression level in OS tissues was obviously lower than that in the adjacent normal tissues (Figure 5D). Furthermore, miR‐299‐3p expression in the OS tissues was inversely related to LINC01128 expression (Figure 5E). Similarly, miR‐299‐3p was also found to be expressed at a lower level in the OS cell lines (Saos2, MG63, U2OS and HOS) relative to that in the human normal osteoblast hFOB1.19 cells (Figure 5F). QRT‐PCR validated that LINC01128 negatively regulated the expression of miR‐299‐3p in OS cells (Figure 5G). These results demonstrate that LINC01128 functions as a miR‐299‐3p sponge in OS cells.
FIGURE 5.

LINC01128 serves as a molecular sponge of miR‐299‐3p. (A) The localization of LINC01128 in OS cells was assessed using subcellular fractionation assay. (B) The putative binding sites between LINC01128 and miR‐299‐3p. (C) Dual‐luciferase reporter assay in 293T cells. (D) MiR‐299‐3p expression in OS tissues. (E) LINC01128 expression negatively correlates with miR‐299‐3p expression in OS tissues (r = −0.6737). (F) MiR‐299‐3p expression in OS cell lines and in hFOB1.19. (G) LINC01128 negatively regulates the expression of miR‐299‐3p in OS cells. ** P < .01 and *** P < .001
3.5. MMP2 is the target of miR‐299‐3p
Through StarBase (http://starbase.sysu.edu.cn/) analysis, we found that there are multiple mRNAs interacting with miR‐299‐3p. Through taking the intersection of four databases in StarBase (PITA, miRmap, microT and miRanda), we selected 131 potential target genes. According to the level of 'clip ExpNum', we selected the top 11 mRNAs as the potential target genes with the strongest interaction with miR‐299‐3p (Table S3). Among the 11 potential target genes, only MMP2 is reported to be closely related to the pathogenesis of osteosarcoma. 15 , 22 So, we identified MMP2 as the potential target of miR‐299‐3p, and the potential binding sites of miR‐299‐3p in the 3'UTR of MMP2 were also identified (Figure 6A). Dual‐luciferase reporter assay showed that miR‐299‐3p mimics clearly reduced the luciferase activity of MMP2‐Wt reporter in 293T cells (Figure 6B). Besides, the expression of MMP2 was increased in the OS tissues (Figure 6C), which is negative correlated with mir‐299‐3p (Figure 6D) but positive correlated with LINC01128 (Figure 6E). Similarly, MMP2 was also found to be expressed at a higher level in the OS cell lines (Saos2, MG63, U2OS and HOS) relative to that in the human normal osteoblast hFOB1.19 cells (Figure 6F). To further verify the relationship between miR‐299‐3p and MMP2, we transfected miR‐299‐3p mimics in U2OS cells and used a miR‐299‐3p inhibitor in Saos2 cells (Figure 6G) and then examined MMP2 expression level using qRT‐PCR and Western blotting. Both the RNA and protein levels of MMP2 were inversely regulated by miR‐299‐3p (Figure 6H and I). These data demonstrate that MMP2 is a target of miR‐299‐3p in OS cells.
FIGURE 6.

MMP2 is a target of miR‐299‐3p. (A) The binding sites of miR‐299‐3p in the 3'UTR of MMP2 were predicted. (B) Dual‐luciferase reporter assay in 293T cells. (C) MMP2 expression level in OS tissues. (D) Pearson correlation analysis showed that the expression of MMP2 is inversely correlated with miR‐299‐3p expression in OS tissues (r = −0.5430). (E) MMP2 expression is positively correlated with LINC01128 expression in OS tissues (r = 0.6380). (F) MMP2 expression in OS cell lines and in hFOB1.19. (G) Transfection efficiency of miR‐299‐3p mimics and miR‐299‐3p inhibitor. (H, I) RNA and protein level of MMP2 in OS cells after transfection with miR‐299‐3p mimics or inhibitors. ** P < .01 and *** P < .001
3.6. LINC01128 affects the proliferation and invasion of OS cells through collaborating with miR‐299‐3p and MMP2
Saos2 and U2OS cells stably transfected with sh‐LINC01128 or LINC01128 overexpression vector were subjected to rescue experiments. The transfection efficiency of sh‐MMP2 and MMP2 are shown in Figure 7A. CCK8 and EdU assays were performed to analyse cell proliferation. Cell invasion was also measured. The results showed that the miR‐299‐3p inhibitor promoted cell proliferation and invasion of OS cells transfected with sh‐LINC01128, while sh‐MMP2 reversed it (Figure 7B‐D). Further, miR‐299‐3p mimics inhibited cell proliferation and invasion of OS cells transfected with LINC01128 overexpression vector, while MMP2 overexpression vector reversed it (Figure 7B‐D).
FIGURE 7.

LINC01128 affects proliferation and invasion of OS cells through collaborating with miR‐299‐3p and MMP2. (A) Transfection efficiency of sh‐MMP2 and MMP2 overexpression vector. (B, C) CCK‐8 and EdU assays showing proliferation of Saos2(sh‐LINC01128) and U2OS(LINC01128) cells after transfection (bar = 100 μm). (D) Transwell assay showing invasion of Saos2(sh‐LINC01128) and U2OS(LINC01128) cells after transfection (bar = 100 μm). * P < .05, ** P < .01 and *** P < .001
3.7. LINC01128 and MMP2 jointly activate the Wnt/β‐catenin signalling pathway
A previous study demonstrated that OS progression is associated with the transcriptional activity of activated β‐catenin. 23 Besides, some studies have also shown that MMP2 is closely associated with the Wnt/β‐catenin signalling pathway. 24 , 25 , 26 This study validates that LINC01128 affects MMP2 mRNA stability through competitive binding with miR‐299‐3p. Therefore, we investigated whether the Wnt/β‐catenin signalling pathway was activated by LINC01128 through the positive regulation of MMP2 in OS. The levels of the Wnt/β‐catenin signalling pathway‐associated proteins were measured using Western blotting in Saos2 and U2OS cells after transfection. The protein levels of β‐catenin, C‐myc and cyclin D1 were inhibited by sh‐MMP2, but promoted by overexpression of MMP2 (Figure 8A), implying that MMP2 may activate the Wnt/β‐catenin signalling pathway. Additionally, as shown in Figure 8B, sh‐LINC01128 inhibited the protein levels of β‐catenin, C‐myc and cyclin D1, while, co‐transfection with MMP2 overexpression vector reversed their expression. LINC01128 overexpression vector promoted the protein levels of β‐catenin, C‐myc and cyclin D1, but the effects were reversed by co‐transfection with sh‐MMP2 (Figure 8B). The above findings validate that LINC01128 positively regulates MMP2, which activates the Wnt/β‐catenin signalling pathway (Figure 8C).
FIGURE 8.
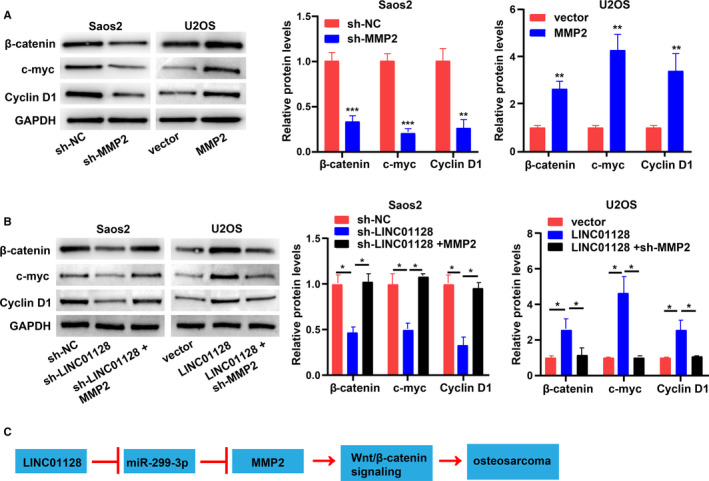
LINC01128 and MMP2 jointly activate the Wnt/β‐catenin signalling pathway. (A) Levels of Wnt/β‐catenin signalling pathway‐associated proteins in OS cells transfected with sh‐MMP2 or MMP2 overexpression vector. (B) Protein levels of Wnt/β‐catenin signalling pathway‐associated proteins in OS cells. (C) Proposed mechanism of LINC01128 in OS LINC01128 functions as a sponge of miR‐299‐3p, thus promoting MMP2 expression and activating the Wnt/β‐catenin signalling pathway, and finally facilitates OS. * P < .05, ** P < .01 and *** P < .001
4. DISCUSSION
Recently, increasing number of studies have reported the pivotal roles of lncRNAs in the occurrence and development of OS. 27 , 28 Hu Y and his colleagues reported that LINC01128 expedites cervical cancer progression by regulating miR‐383‐5p/SFN axis. 21 In the present study, we demonstrated that LINC01128 is significantly overexpressed in OS tissues and cell lines, and promotes proliferation, migration and invasion of OS cells.
LncRNAs facilitate tumour development by sponging miRNAs and protecting their target mRNAs from repression. 29 , 30 The results of subcellular localization analysis suggest that LINC01128 may play a role through competing endogenous RNA (ceRNA) mechanism. Bioinformatics analysis suggests that LINC01128 may bind with miR‐299‐3p. MiR‐299‐3p is a tumour suppressor gene, shown to inhibit the development of a variety of tumours, including cervical, 31 thyroid 32 and hepatocellular carcinoma 33 among others. To explore the specific mechanism of LINC01128 in OS, we performed a series of experiments and demonstrated that LINC01128 regulated the expression of MMP2 by competitively binding to miR‐299‐3p, thereby regulating the pathophysiological process of OS.
Wnt/β‐catenin signalling is an evolutionarily conserved and versatile pathway. Several studies have implicated the Wnt/β‐catenin pathway in tissue homeostasis, embryonic development and various human diseases. 34 , 35 , 36 Ectopic activation of this pathway leads to the accumulation of β‐catenin in the nucleus and stimulates the transcription of many oncogenes. 37 , 38 Previous studies have reported that abnormal activation of the Wnt signalling pathway plays an important role in OS pathogenesis. Therefore, in this study, we examined whether LINC01128/ miR‐299‐3p/ MMP2 had an effect on the Wnt/β‐catenin signalling pathway. Our results confirmed that LINC01128/miR‐299‐3p/MMP2 functions via the Wnt/β‐catenin signalling pathway.
However, the study has several limitations. First, a larger tissue sample size of OS is required to further explore the clinical value of LINC01128. Second, whether there are other target genes or miRNAs which can interact with LINC01128 requires further exploration.
In conclusion, LINC01128 plays a carcinogenic role in OS LINC01128 regulates the development of OS through sponging miR‐299‐3p to promote MMP2 expression and activate the Wnt/β‐catenin signalling pathway. Our study is the first to identify LINC01128 as a marker and prognostic target in OS. However, further in‐depth investigations are needed in the future prior to its potential clinical applications.
CONFLICT OF INTEREST
The authors report no conflicts of interest.
AUTHOR CONTRIBUTION
Qiang Yao: Data curation (lead); Methodology (lead); Writing‐original draft (supporting); Writing‐review & editing (supporting). Ting Chen: Conceptualization (lead); Writing‐original draft (lead); Writing‐review & editing (lead).
ETHICAL APPROVAL AND INFORMED CONSENT
The present study was approved by the Ethics Committee of Shengjing Hospital of China Medical University. All population‐related studies were carried out according to the principles of good clinical practice and the World Medical Association Declaration of Helsinki. Written informed consent was signed by all the participants.
Supporting information
Fig S1
Fig S2
Fig S3
Fig S4
Fig S5
Table S1
Table S2
Table S3
Yao Q, Chen T. LINC01128 regulates the development of osteosarcoma by sponging miR‐299‐3p to mediate MMP2 expression and activating Wnt/β‐catenin signalling pathway. J Cell Mol Med. 2020;24:14293–14305. 10.1111/jcmm.16046
DATA AVAILABILITY STATEMENT
The data pertaining to the current study are available from the corresponding author on reasonable request.
REFERENCES
- 1. Zhou C, Tan W, Lv H, Gao F, Sun J. Hypoxia‐inducible microRNA‐488 regulates apoptosis by targeting Bim in osteosarcoma. Cell Oncol (Dordr). 2016;39:463‐471. [DOI] [PubMed] [Google Scholar]
- 2. Punzo F, Tortora C, Di Pinto D, et al. Bortezomib and endocannabinoid/endovanilloid system: a synergism in osteosarcoma. Pharmacol Res. 2018;137:25‐33. [DOI] [PubMed] [Google Scholar]
- 3. Biazzo A, De Paolis M. Multidisciplinary approach to osteosarcoma. Acta Orthop Belg. 2016;82:690‐698. [PubMed] [Google Scholar]
- 4. Kovac M, Blattmann C, Ribi S, et al. Exome sequencing of osteosarcoma reveals mutation signatures reminiscent of BRCA deficiency. Nat Commun. 2015;6:8940. [DOI] [PMC free article] [PubMed] [Google Scholar]
- 5. Isakoff MS, Bielack SS, Meltzer P, Gorlick R. Osteosarcoma: current treatment and a collaborative pathway to success. J Clin Oncol. 2015;33:3029‐3035. [DOI] [PMC free article] [PubMed] [Google Scholar]
- 6. He C, Sun J, Liu C, Jiang Y, Hao Y. Elevated H3K27me3 levels sensitize osteosarcoma to cisplatin. Clin Epigenetics. 2019;11:8. [DOI] [PMC free article] [PubMed] [Google Scholar]
- 7. Lu Y, Li L, Lin Z, et al. Enhancing Osteosarcoma Killing and CT Imaging Using Ultrahigh Drug Loading and NIR‐Responsive Bismuth Sulfide@Mesoporous Silica Nanoparticles. Adv Healthc Mater. 2018;7:e1800602. [DOI] [PMC free article] [PubMed] [Google Scholar]
- 8. Zuo D, Shogren KL, Zang J, et al. Inhibition of STAT3 blocks protein synthesis and tumor metastasis in osteosarcoma cells. J Exp Clin Cancer Res. 2018;37:244. [DOI] [PMC free article] [PubMed] [Google Scholar]
- 9. Ferreira de Oliveira JMP, Pacheco AR, Coutinho L, et al. Combination of etoposide and fisetin results in anti‐cancer efficiency against osteosarcoma cell models. Arch Toxicol. 2018;92:1205‐1214. [DOI] [PubMed] [Google Scholar]
- 10. Wang Z, Yin F, Xu J, et al. CYT997(Lexibulin) induces apoptosis and autophagy through the activation of mutually reinforced ER stress and ROS in osteosarcoma. J Exp Clin Cancer Res. 2019;38:44. [DOI] [PMC free article] [PubMed] [Google Scholar]
- 11. Li Z, Dou P, Liu T, He S. Application of Long Noncoding RNAs in Osteosarcoma: Biomarkers and Therapeutic Targets. Cell Physiol Biochem. 2017;42:1407‐1419. [DOI] [PubMed] [Google Scholar]
- 12. Chen J, Liu A, Wang Z, et al. LINC00173.v1 promotes angiogenesis and progression of lung squamous cell carcinoma by sponging miR‐511‐5p to regulate VEGFA expression. Mol Cancer. 2020;19:98. [DOI] [PMC free article] [PubMed] [Google Scholar]
- 13. Wang FW, Cao CH, Han K, et al. APC‐activated long noncoding RNA inhibits colorectal carcinoma pathogenesis through reduction of exosome production. J Clin Invest. 2019;129:727‐743. [DOI] [PMC free article] [PubMed] [Google Scholar]
- 14. Wang G, Zhang ZJ, Jian WG, et al. Novel long noncoding RNA OTUD6B‐AS1 indicates poor prognosis and inhibits clear cell renal cell carcinoma proliferation via the Wnt/beta‐catenin signaling pathway. Mol Cancer. 2019;18:15. [DOI] [PMC free article] [PubMed] [Google Scholar]
- 15. Zhu KP, Ma XL, Zhang CL. LncRNA ODRUL Contributes to Osteosarcoma Progression through the miR‐3182/MMP2 Axis. Mol Ther. 2017;25:2383‐2393. [DOI] [PMC free article] [PubMed] [Google Scholar] [Retracted]
- 16. Liu K, Hou Y, Liu Y, Zheng J. LncRNA SNHG15 contributes to proliferation, invasion and autophagy in osteosarcoma cells by sponging miR‐141. J Biomed Sci. 2017;24:46. [DOI] [PMC free article] [PubMed] [Google Scholar]
- 17. Zhu C, Cheng D, Qiu X, Zhuang M, Liu Z. Long Noncoding RNA SNHG16 Promotes Cell Proliferation by Sponging MicroRNA‐205 and Upregulating ZEB1 Expression in Osteosarcoma. Cell Physiol Biochem. 2018;51:429‐440. [DOI] [PubMed] [Google Scholar]
- 18. Xu R, Feng F, Yu X, Liu Z, Lao L. LncRNA SNHG4 promotes tumour growth by sponging miR‐224‐3p and predicts poor survival and recurrence in human osteosarcoma. Cell Prolif. 2018;51:e12515. [DOI] [PMC free article] [PubMed] [Google Scholar]
- 19. Shi D, Wu F, Mu S, et al. LncRNA AFAP1‐AS1 promotes tumorigenesis and epithelial‐mesenchymal transition of osteosarcoma through RhoC/ROCK1/p38MAPK/Twist1 signaling pathway. J Exp Clin Cancer Res. 2019;38:375. [DOI] [PMC free article] [PubMed] [Google Scholar]
- 20. Li H, Tian X, Wang P, et al. LINC01128 resisted acute myeloid leukemia through regulating miR‐4260/NR3C2. Cancer Biol Ther. 2020;21:615‐622. [DOI] [PMC free article] [PubMed] [Google Scholar]
- 21. Hu Y, Ma Y, Liu J, Cai Y, Zhang M, Fang X. LINC01128 expedites cervical cancer progression by regulating miR‐383‐5p/SFN axis. BMC Cancer. 2019;19:1157. [DOI] [PMC free article] [PubMed] [Google Scholar]
- 22. Kunz P, Sahr H, Lehner B, Fischer C, Seebach E, Fellenberg J. Elevated ratio of MMP2/MMP9 activity is associated with poor response to chemotherapy in osteosarcoma. BMC Cancer. 2016;16:223. [DOI] [PMC free article] [PubMed] [Google Scholar]
- 23. Ali N, Venkateswaran G, Garcia E, et al. Osteosarcoma progression is associated with increased nuclear levels and transcriptional activity of activated beta‐Catenin. Genes Cancer. 2019;10:63‐79. [DOI] [PMC free article] [PubMed] [Google Scholar]
- 24. Wu T, Wang LN, Tang DR, Sun FY. SOST silencing promotes proliferation and invasion and reduces apoptosis of retinoblastoma cells by activating Wnt/beta‐catenin signaling pathway. Gene Ther. 2017;24:399‐407. [DOI] [PubMed] [Google Scholar]
- 25. Tian S, Peng P, Li J, et al. SERPINH1 regulates EMT and gastric cancer metastasis via the Wnt/beta‐catenin signaling pathway. Aging (Albany NY). 2020;12:3574‐3593. [DOI] [PMC free article] [PubMed] [Google Scholar]
- 26. Ma Y, Zhu B, Liu X, et al. Inhibition of oleandrin on the proliferation show and invasion of osteosarcoma cells in vitro by suppressing Wnt/beta‐catenin signaling pathway. J Exp Clin Cancer Res. 2015;34:115. [DOI] [PMC free article] [PubMed] [Google Scholar]
- 27. Xie L, Yao Z, Zhang Y, et al. Deep RNA sequencing reveals the dynamic regulation of miRNA, lncRNAs, and mRNAs in osteosarcoma tumorigenesis and pulmonary metastasis. Cell Death Dis. 2018;9:772. [DOI] [PMC free article] [PubMed] [Google Scholar]
- 28. Xia P, Gu R, Zhang W, Sun YF. lncRNA CEBPA‐AS1 Overexpression Inhibits Proliferation and Migration and Stimulates Apoptosis of OS Cells via Notch Signaling. Mol Ther Nucleic Acids. 2020;19:1470‐1481. [DOI] [PMC free article] [PubMed] [Google Scholar] [Retracted]
- 29. Militello G, Weirick T, John D, Doring C, Dimmeler S, Uchida S. Screening and validation of lncRNAs and circRNAs as miRNA sponges. Brief Bioinform. 2017;18:780‐788. [DOI] [PubMed] [Google Scholar]
- 30. Shen SN, Li K, Liu Y, Yang CL, He CY, Wang HR. Silencing lncRNAs PVT1 Upregulates miR‐145 and Confers Inhibitory Effects on Viability, Invasion, and Migration in EC. Mol Ther Nucleic Acids. 2020;19:668‐682. [DOI] [PMC free article] [PubMed] [Google Scholar] [Retracted]
- 31. Yu Y, Zhao JD, Yang H. MiR‐299‐3p inhibits proliferation and invasion of cervical cancer cell via targeting TCF4. Eur Rev Med Pharmacol Sci. 2019;23:5621‐5627. [DOI] [PubMed] [Google Scholar]
- 32. Chen X, Qi M, Yang Q, Li JY. MiR‐299‐3p functions as a tumor suppressor in thyroid cancer by regulating SHOC2. Eur Rev Med Pharmacol Sci. 2019;23:232‐240. [DOI] [PubMed] [Google Scholar]
- 33. Dang S, Zhou J, Wang Z, Wang K, Dai S, He S. MiR‐299‐3p functions as a tumor suppressor via targeting Sirtuin 5 in hepatocellular carcinoma. Biomed Pharmacother. 2018;106:966‐975. [DOI] [PubMed] [Google Scholar]
- 34. Miao J, Liu J, Niu J, et al. Wnt/beta‐catenin/RAS signaling mediates age‐related renal fibrosis and is associated with mitochondrial dysfunction. Aging Cell. 2019;18:e13004. [DOI] [PMC free article] [PubMed] [Google Scholar]
- 35. Gao J, Liao Y, Qiu M, Shen W. Wnt/beta‐Catenin Signaling in Neural Stem Cell Homeostasis and Neurological Diseases. Neuroscientist. 2020. [DOI] [PubMed] [Google Scholar]
- 36. Rharass T, Lantow M, Gbankoto A, Weiss DG, Panakova D, Lucas S. Ascorbic acid alters cell fate commitment of human neural progenitors in a WNT/beta‐catenin/ROS signaling dependent manner. J Biomed Sci. 2017;24:78. [DOI] [PMC free article] [PubMed] [Google Scholar]
- 37. Huang L, Li X, Ye H, et al. Long non‐coding RNA NCK1‐AS1 promotes the tumorigenesis of gligg through sponging microRNA‐138‐2‐3p and activating the TRIM24/Wnt/beta‐catenin axis. J Exp Clin Cancer Res. 2020;39:63. [DOI] [PMC free article] [PubMed] [Google Scholar]
- 38. Li ZT, Zhang X, Wang DW, et al. Overexpressed lncRNA GATA6‐AS1 Inhibits LNM and EMT via FZD4 through the Wnt/beta‐Catenin Signaling Pathway in GC. Mol Ther Nucleic Acids. 2020;19:827‐840. [DOI] [PMC free article] [PubMed] [Google Scholar] [Retracted]
Associated Data
This section collects any data citations, data availability statements, or supplementary materials included in this article.
Supplementary Materials
Fig S1
Fig S2
Fig S3
Fig S4
Fig S5
Table S1
Table S2
Table S3
Data Availability Statement
The data pertaining to the current study are available from the corresponding author on reasonable request.