Abstract
Myeloid‐derived suppressor cells (MDSCs) are known to contribute to tumour immune evasion, and studies have verified that MDSCs can induce cancer stem cells (CSCs) and promote tumour immune evasion in breast cancers, cervical cancers and glioblastoma. However, the potential function of MDSCs in regulating CSCs in epithelial ovarian cancer (EOC) progression is unknown. Our results indicated that compared to nonmalignant ovarian patients, EOC patients showed a significantly increased proportion of MDSCs in the peripheral blood. In addition, MDSCs dramatically promoted tumour sphere formation, cell colony formation and CSC accumulation, and MDSCs enhanced the expression of the stemness biomarkers NANOG and c‐MYC in EOC cells during coculture. Moreover, the mechanisms by which MDSCs enhance EOC stemness were further explored, and 586 differentially expressed genes were found in EOC cells cocultured with or without MDSCs; during coculture, the expression level of colony‐stimulating factor 2 (CSF2) was significantly increased in EOC cells cocultured with MDSCs. Furthermore, the depletion of CSF2 in EOC cells was successfully performed, the promotive effects of MDSCs on EOC cell stemness could be markedly reversed by downregulating CSF2 expression, p‐STAT3 signalling pathway molecules were also altered, and the p‐STAT3 inhibitor could markedly reverse the promotive effects of MDSCs on EOC cell stemness. In addition, the CSF2 expression level was correlated with EOC clinical staging. Therefore, MDSCs enhance the stemness of EOC cells by inducing the CSF2/p‐STAT3 signalling pathway. Targeting MDSCs or CSF2 may be a reasonable strategy for enhancing the efficacy of conventional treatments.
Database
Gene expression data files are available in the GEO databases under the accession number(s) GSE145374.
Keywords: cancer stem cells, colony‐stimulating factor 2, epithelial ovarian cancer, myeloid‐derived suppressor cells
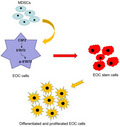
Previous studies have verified that myeloid‐derived suppressor cells (MDSCs) can promote tumour immune evasion. We found that epithelial ovarian cancer (EOC) patients showed a significantly increased proportion of MDSCs in the peripheral blood. MDSCs dramatically promoted EOC cell stemness, and the promotive effects of MDSCs on EOC cell stemness could be markedly reversed by downregulating CSF2/p‐STAT3 expression. In addition, the CSF2 expression level was correlated with EOC clinical staging.
Abbreviations
- ALDH
aldehyde dehydrogenase
- BIRC3
baculoviral IAP repeat‐containing 3
- CSC
cancer stem cell
- CSF2
colony‐stimulating factor 2
- EOC
epithelial ovarian cancer
- ICAM1
intercellular adhesion molecule 1
- IHC
immunohistochemistry
- IL‐32
interleukin‐32
- MDSC
myeloid‐derived suppressor cell
- PB
fresh peripheral blood
- PBMC
peripheral blood mononuclear cell
- p‐STAT3
phosphorylated STAT3
- TNFAIP3
TNF alpha‐induced protein 3
Introduction
Epithelial ovarian cancer (EOC) is the deadliest gynaecological malignancy. It is accompanied by poor treatment efficacy in advanced stages, which results in a high mortality rate [1] and seriously endangers women’s health [2, 3]. Although EOC patients respond well to initial surgery and chemotherapy, resistance and recurrence usually occur, eventually leading to death. Given our failure to improve the long‐term survival of EOC patients, there is a need to address the key cellular and molecular mechanisms by which tumour metastasis and chemoresistance occur in these patients from a novel angle.
Tumour cells and immune cells interact in the tumour microenvironment, leading to immune editing, which ultimately leads to tumour spread, recurrence and metastasis [4, 5]. Myeloid‐derived suppressor cells (MDSCs) are an important immune component in the tumour microenvironment and are considered to mediate immune suppression in tumour‐bearing mice and cancer patients. In addition to mediating immunosuppression, MDSCs promote cancer cell invasion and metastasis and tumour angiogenesis [6]. However, the role of MDSCs in the tumour microenvironment is not fully understood.
Cancer stem cells were first discovered in 1997, and CSCs are a subset of cells associated with tumour progression and resistance [7]. Aldehyde dehydrogenase (ALDH) has been identified as a human CSC biomarker [8]. Studies have confirmed that tumour‐associated macrophages (TAMs) and cancer‐associated fibroblasts (CAFs) in the tumour microenvironment enhance the stemness of malignant tumours [9]. Recently, studies have found that MDSCs participate in the induction of CSCs through various mechanisms in human ovarian cancer and breast cancer [10, 11]. However, the mechanisms by which MDSCs are involved in the induction of ovarian cancer stemness are still unclear. In this study, we focused on the mechanisms of MDSC‐induced stemness in EOC.
Results
Accumulation of MDSCs in epithelial ovarian cancer
Previous studies have shown that a large number of MDSCs accumulate in the peripheral blood (PB) and tumour tissue of cancer patients and that MDSCs can inhibit acquired and natural antitumour immunity in various ways, allowing tumour cells to escape immune surveillance and attack, leading to tumour progression [12]. This study focused on the mechanism involving MDSCs in EOC. First, we collected 20 samples of EOC PB and 20 samples of benign tumour PB as research objects, as shown in Table 1. To determine the percentage of MDSCs in EOC patients and benign tumour patients, we examined the expression levels of various antigens, such as CD11b, HLA‐DR, CD33, CD14 and CD15, in Peripheral blood mononuclear cells (PBMCs). Figure 1A,B presents the gating strategy and analysis of MDSC subsets. The proportion of MDSCs in the PB of EOC patients is significantly higher than that in the PB of benign tumour patients (CD11b+HLA‐DR−/lowCD33+CD14+ cells: 6.06 ± 1.66 vs. 0.68 ± 0.18%, respectively, P < 0.01; CD11b+HLA‐DR−/lowCD33+CD15+ cells: 24.84 ± 3.68 vs. 3.30 ± 0.61, respectively, P < 0.0001) (Fig. 1C,D). Therefore, we believe that CD11b+HL‐ADR−/lowCD33+CD14+ cells may be the M‐MDSC subset and CD11b+HLA‐DR−/lowCD33+CD15+ cells may be the PMN‐MDSC subset. Obviously, MDSCs accumulate significantly in the PB of EOC patients.
Table 1.
Patients with EOC or Benign Tumour used to detect MDSCs in the PB.
| FIGO stage | Number | Age (Years) |
|---|---|---|
| Benign tumour | 20 | 56.15 ± 14.36 |
| EOC (I–II) | 4 | 56.30 ± 11.80 |
| EOC (III–IV) | 16 |
Fig. 1.
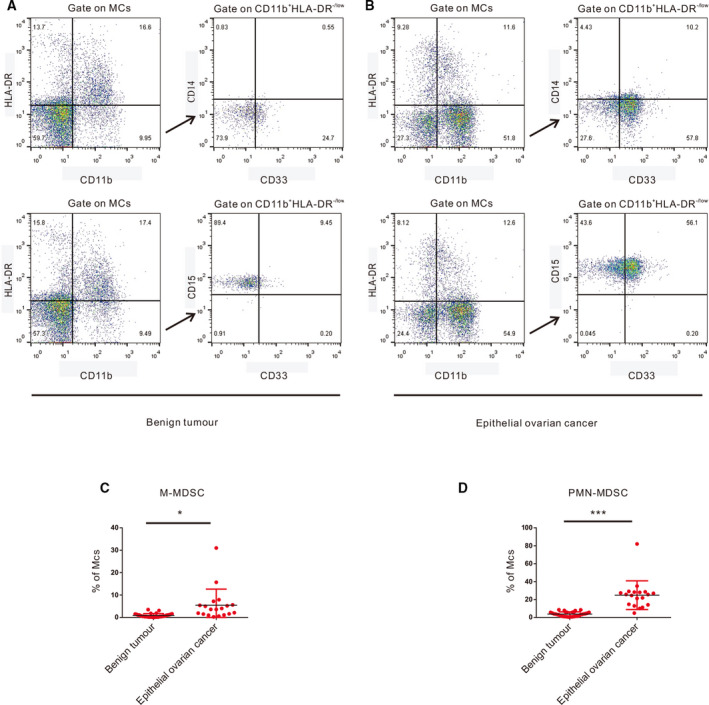
Accumulation of MDSCs in EOC. (A) Flow cytometry analysis of M‐MDSCs and PMN‐MDSCs in PB from benign tumour patients. (B) Flow cytometry analysis of M‐MDSCs and PMN‐MDSCs in PB from EOC patients. (C) Statistical analysis of the frequencies of M‐MDSCs as a percentage of the MC population. (D) Statistical analysis of the frequencies of PMN‐MDSCs as a percentage of the MC population. Each point corresponds to an individual patient. Lines indicate the 25th to 75th percentiles. Horizontal lines represent the median value. Data were analysed using Student’s t‐test and are expressed as the mean ± SD. Symbols represent statistical significance (*P < 0.01; and ***P < 0.0001).
MDSCs enhance the stemness of epithelial ovarian cancer cells
Cancer stem cells have numerous biomarkers, and acetaldehyde dehydrogenase (ALDH) is considered to be one of the ovarian CSC biomarkers [13]. In our study, ALDH+ and ALDH− EOC cells were sorted by flow cytometry, and we found that ALDH+ EOC cells formed more spheres in an in vitro sphere formation assay (Fig. 2A). In addition, we confirmed that the expression of core stem cell molecules (SOX2, NANOG, OCT4a, KLF4 and c‐MYC) in ALDH+ EOC cells at the transcriptional level was significantly higher than that in ALDH− EOC cells by qRT‐PCR (Fig. 2B). Therefore, we believe that ALDH+ EOC cells are EOC stem cells. In our study, we found that MDSCs in the PB of benign tumour patients are extremely rare. Subsequently, when EOC cells were cocultured with more MDSCs, the number of tumour spheres (Fig. 2C–E) and proportion of stem cells (Fig. 3A–C) in EOC increased significantly. Furthermore, there was no significant difference in the number of tumour spheres (Fig. 2C–E) or the proportion of stem cells (Fig. 3A–C) in EOC cells after coculture with the same number of MDSCs from different groups of patients. Therefore, we believe that MDSCs promote EOC stemness through the MDSCs’ accumulation. Therefore, in the following experiments, we used EOC cells cultured alone as a control group. We found that the number of colonies of EOC cells was significantly increased by MDSCs (Fig. 3D). Furthermore, MDSCs promoted the expression of core stem cell molecules (SOX2, NANOG, OCT4a, c‐MYC and KLF4) at the transcriptional level (Fig. 3E), and the expression of NANOG and c‐MYC at the protein level is also upregulated by MDSCs (Fig. 3F,G).
Fig. 2.
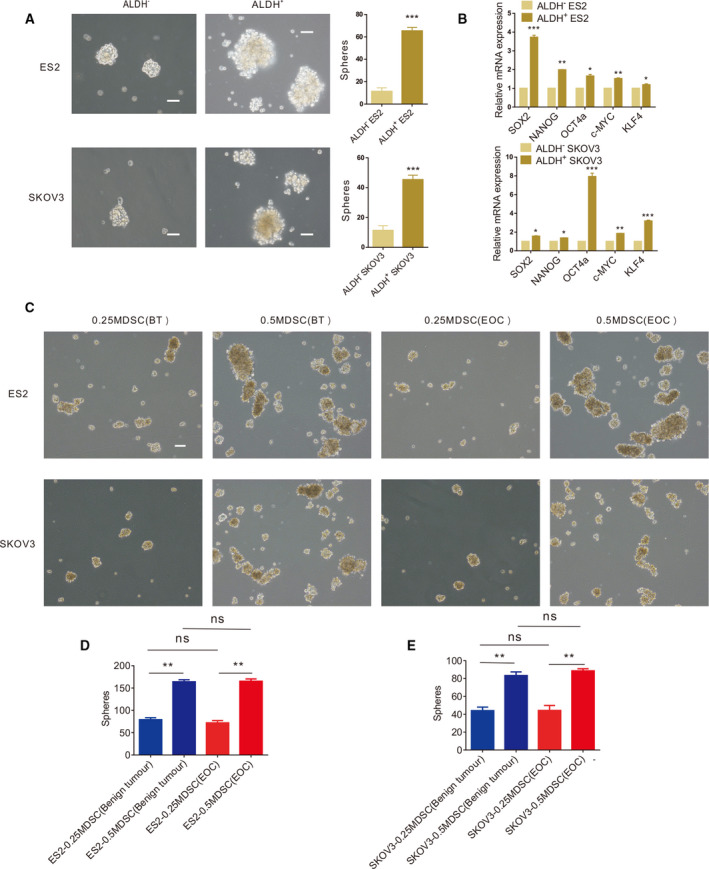
ALDH+ EOC cells are EOC stem cells. (A) Sphere formation assays using ALDH+ and ALDH‐ ES2 and SKOV3 cells. Scale bar, 50 μm. (B) qRT‐PCR analysis of core stem cell molecule expression levels in ALDH+ and ALDH‐ ES2 and SKOV3 cells. (C) Sphere formation assays using ES2 and SKOV3 cells cultured with MDSCs from different groups of patients. Scale bar, 50 μm. (D, E) Statistical analysis of the number of ES2 and SKOV3 tumour spheres with MDSCs from different groups of patients. All data were analysed using Student’s t‐test and are expressed as the mean ± SD. Experiments were performed in triplicate with MDSCs from three different patients. Symbols represent statistical significance (*P < 0.01; **P < 0.001; and ***P < 0.0001).
Fig. 3.
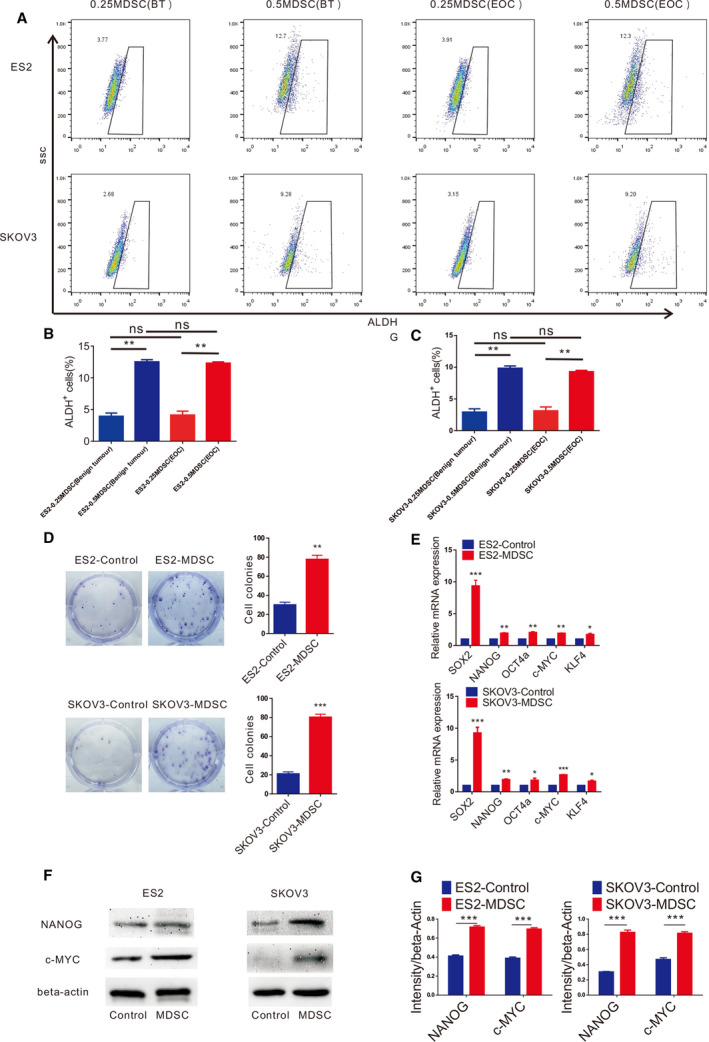
MDSCs enhance the stemness of EOC cells. (A) Flow cytometry analysis of the ALDH+ cells within the ES2 and SKOV3 cell populations cultured with MDSCs from different groups of patients. (B, C) Statistical analysis of the proportion of the ALDH+ cells within the ES2 and SKOV3 cell populations cultured with MDSCs from different groups of patients. (D) Colony formation assays using ES2 and SKOV3 cells cocultured with MDSCs. Scale bar, 50 μm. (E) qRT‐PCR analysis of core stem cell molecule expression in ES2 and SKOV3 cells cultured with MDSCs. (F, G) Western blot analysis of core stem cell molecule expression in ES2 and SKOV3 cells cultured with MDSCs. All data were analysed using Student’s t‐test and are expressed as the mean ± SD. Experiments were performed in triplicate with MDSCs from three different patients. Symbols represent statistical significance (*P < 0.01; **P < 0.001; and ***P < 0.0001).
MDSCs stimulate CSF2 expression in epithelial ovarian cancer
To clarify the mechanisms by which MDSCs stimulate EOC cell stemness, we speculated that MDSCs may regulate the expression of certain critical proteins in EOC cells to enhance EOC cell stemness. To verify this hypothesis, MDSCs were sorted and cocultured with SKOV3 cells for 24 h. Then, we analysed the mRNA expression levels in SKOV3 cells after coculture and compared the levels with those in SKOV3 cells cultured in the absence of MDSCs. Microarray analysis showed that there were significant differences in the expression of 586 genes at the transcriptional level (Fig. 4A), among which 335 exhibited upregulated expression and 251 exhibited downregulated expression (Fig. 4B). The expression levels of colony‐stimulating factor 2 (CSF2), intercellular adhesion molecule 1 (ICAM1), baculoviral IAP repeat‐containing 3 (BIRC3), TNF alpha‐induced protein 3 (TNFAIP3) and interleukin‐32 (IL‐32) increased significantly (Fig. 4B). We detected the expression of CSF2, ICAM1, BIRC3, TNFAIP3 and IL‐32 in EOC cells cultured with or without MDSCs by qRT‐PCR (Fig. 4C), and the results showed that after coculture with MDSCs, EOC cells showed significantly increased expression of these molecules at the transcriptional level. Among the molecules, CSF2 had the most increased expression level. Moreover, we also observed that the protein expression level of CSF2 in EOC cells was significantly increased with MDSC coculture (Fig. 4D,E). CSF2, one of the major haematopoietic growth factors, plays important roles in haematopoietic regulation and immune regulation [14]. Thus, we hypothesized that MDSCs promote EOC cell stemness by regulating CSF2.
Fig. 4.
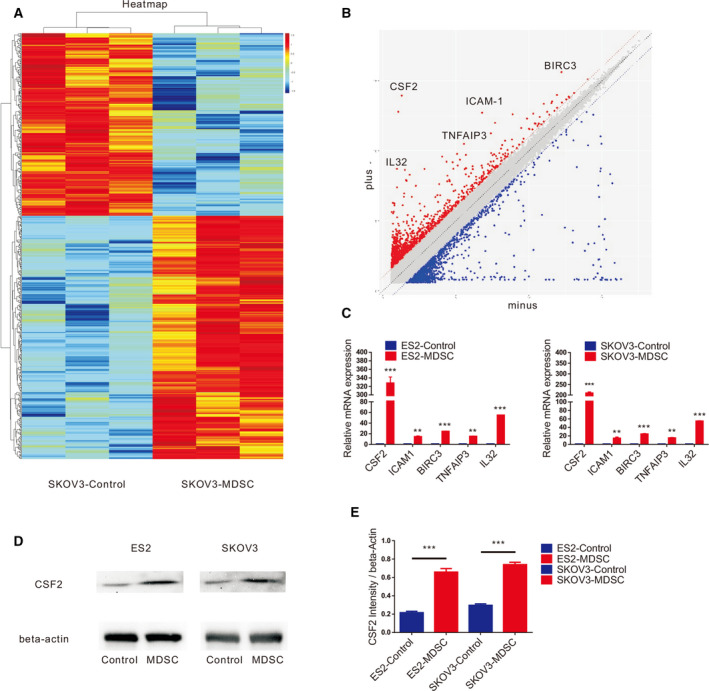
MDSCs stimulate CSF2 expression in EOC. (A) Microarray analysis of differentially expressed genes for SKOV3 cells based on coculture with MDSCs. (B) Scatter diagram analysis of discriminating genes for SKOV3 cells based on coculture with MDSCs. (C) qRT‐PCR analysis of CSF2, ICAM‐1, IL‐32, BIRC3 and TNFAIP3 expression in ES2 and SKOV3 cells cultured with or without MDSCs. (D, E) Western blot analysis of CSF2 expression in ES2 and SKOV3 cells cultured with or without MDSCs. All data were analysed using Student’s t‐test and are expressed as the mean ± SD. Experiments were performed in triplicate with MDSCs derived from three different patients, and statistically significant differences are presented as follows: **P < 0.001 and ***P < 0.0001.
MDSCs enhance epithelial ovarian cancer stemness via CSF2
shCSF2‐1, shCSF2‐2, shCSF2‐3 and nonfunctional scrambled control (shControl) plasmids were transfected into EOC cells, and the expression of CSF2 in the EOC cells transfected with the shCSF2‐1 plasmid was significantly decreased, as evaluated by qRT‐PCR and western blotting (Fig. 5A,B). EOC cells transfected with the shCSF2‐1 and shControl plasmids were independently cocultured with MDSCs. Figure 5C,D shows that the MDSCs increased the number of EOC cell spheres and that after the expression of CSF2 in EOC cells was weakened, the number of EOC cell spheres in the cocultures with MDSCs decreased significantly. As shown in Fig. 5E,F, the EOC cells cocultured with MDSCs formed more colonies, and CSF2‐depleted EOC cells cocultured with MDSCs produced fewer colonies. After coculture with MDSCs, the proportion of ALDH+ EOC cells increased significantly. After knocking down CSF2 expression in EOC cells, the proportion of ALDH+ EOC cells was reduced significantly in the cocultures with MDSCs (Fig. 5G,H). We found that MDSCs facilitated the expression of SOX2, NANOG, STAT3 and c‐MYC by qRT‐PCR, which could be markedly reversed by downregulating CSF2 expression (Fig. 7A). Western blot analysis (Fig. 7B‐D) revealed that MDSCs enhanced the expression of NANOG and c‐MYC in EOC cells, but after downregulating CSF2 expression in EOC cells, the expression of NANOG and c‐MYC in EOC cells decreased. In summary, the stimulatory effects of MDSCs on EOC cell stemness could be markedly reversed by downregulating CSF2 expression. Therefore, MDSCs may promote EOC cell stemness by inducing CSF2.
Fig. 5.
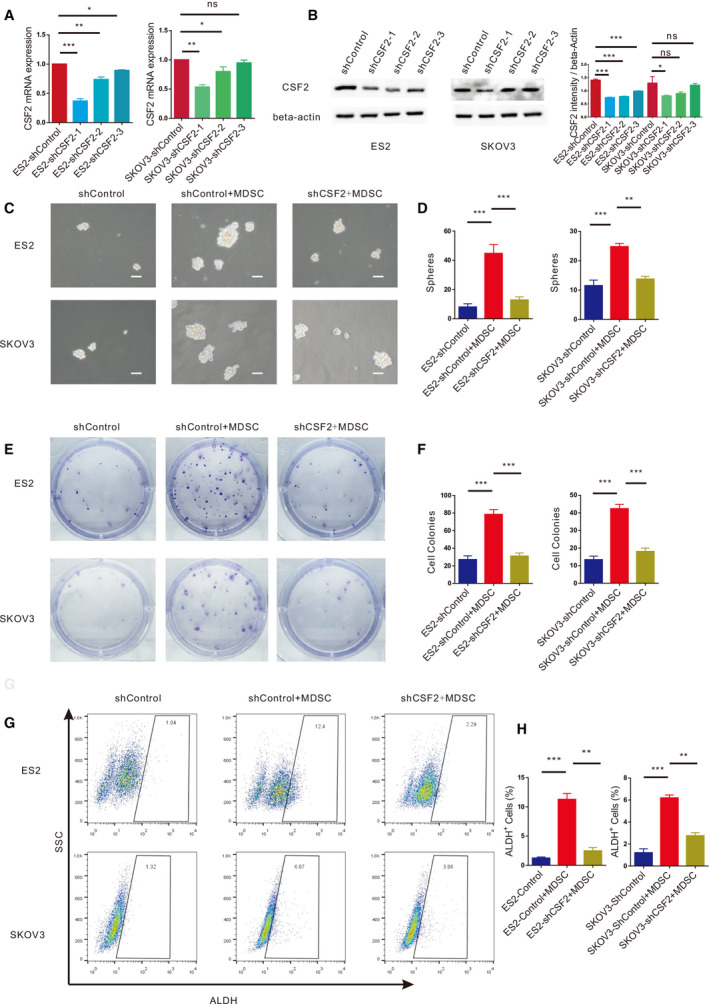
MDSCs enhance EOC stemness via CSF2. (A) qRT‐PCR analysis of CSF2 expression in ES2 and SKOV3 cells transfected with the shControl or shCSF2 plasmid. (B) Western blot analysis of CSF2 expression in ES2 and SKOV3 cells transfected with the ShControl or ShCSF2 plasmid. (C, D) Sphere formation assays with ES2 and SKOV3 cells with dysregulated CSF2 expression cultured with or without MDSCs. Scale bar, 50 μm. (E, F) Colony formation assays with ES2 and SKOV3 cells with knocked down CSF2 expression cultured with or without MDSCs. (G, H) Flow cytometry analysis of the ALDH+ cells in ES2 and SKOV3 cell populations transfected with the shControl or shCSF2 plasmid and cultured with MDSCs. All data were analysed using Student’s t‐test and are expressed as the mean ± SD. Experiments were performed in triplicate with MDSCs derived from three different patients. Symbols represent statistical significance (*P < 0.01; **P < 0.001; and ***P < 0.0001; ns, P> 0.05).
Fig. 7.
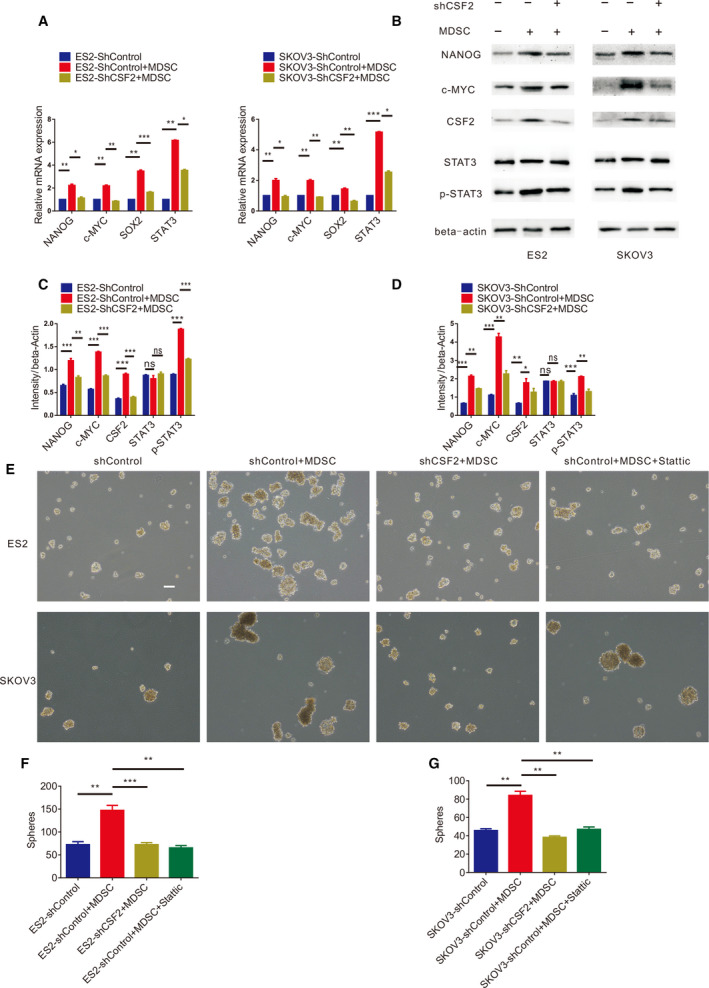
MDSCs induce epithelial ovarian CSCs through CSF2/p‐STAT3 signalling pathway. (A) qRT‐PCR analysis of NANOG, c‐MYC, SOX2 and STAT3 expression levels in ES2 and SKOV3 cells with knocked down CSF2 expression cultured with or without MDSCs. Experiments were performed in triplicate with MDSCs derived from three different patients. (B) Western blot analysis of NANOG, c‐MYC, CSF2, STAT3 and p‐STAT3 expression in ES2 and SKOV3 cells with knocked down CSF2 expression cultured with or without MDSCs. (C, D) Statistical analysis of NANOG, c‐MYC, CSF2, STAT3 and p‐STAT3 intensity in ES2 and SKOV3 cells with knocked down CSF2 expression cultured with or without MDSCs. (E, F, G) Sphere formation assays with ES2 and SKOV3 cells with dysregulated CSF2 expression or the p‐STAT3 inhibitor Stattic cultured with or without MDSCs. Scale bar, 100 μm. Data were analysed using a nonparametric test, and statistically significant differences are presented as follows: *P < 0.01; **P < 0.001; and ***P < 0.0001.
MDSCs induce epithelial ovarian cancer stem cells through the CSF2/p‐STAT3 signalling pathway
What are the mechanisms by which MDSCs enhance EOC cell stemness by inducing CSF2? We explored this issue further. Microarray results and KEGG analysis showed that the process by which MDSCs promote EOC cell stemness may involve multiple signalling pathways (Fig. 6), of which the JAK/STAT3 pathway attracted our attention. We found that MDSCs promoted the expression of p‐STAT3 in EOC cells and that the expression level of p‐STAT3 decreased after knocking down CSF2 expression in EOC cells, as measured by western blotting (Fig. 7B–D). During coculture, there was no significant difference in the total protein levels of STAT3 (Fig. 7B–D). When EOC cells cocultured with MDSCs, the P‐STAT3 inhibitor Stattic significantly decreased the number of EOC cell spheres cocultured with MDSCs (Fig. 7E‐G) and significantly reduced the proportion of ALDH+ EOC cells cocultured with MDSCs (Fig. 8A–D). Therefore, MDSCs may promote EOC cell stemness via the CSF2/p‐STAT3 pathway.
Fig. 6.
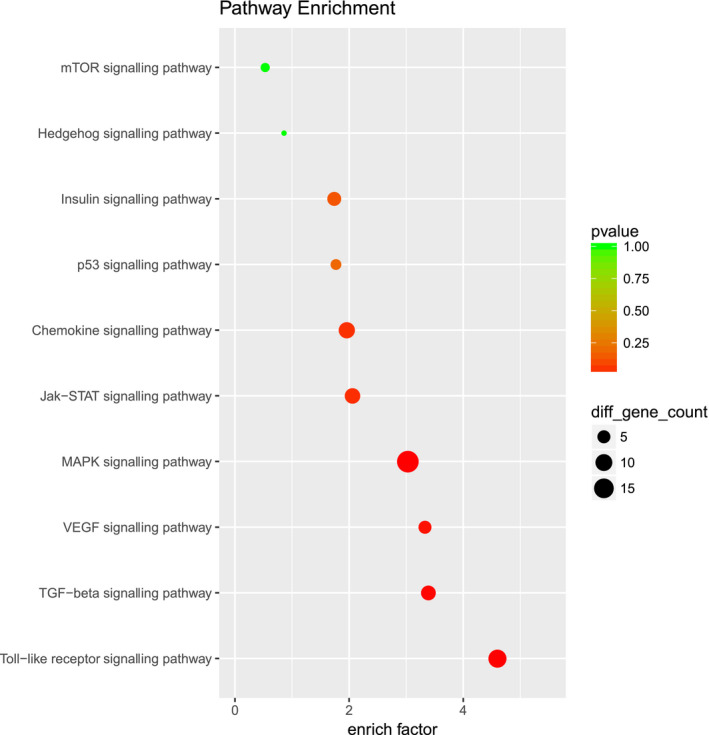
MDSCs may induce epithelial ovarian CSCs through CSF2/p‐STAT3 signalling pathway. By using KEGG analysis, differentially expressed genes were found to be closely related to pathways such as the JAK/STAT3 pathway, MAPK pathway and Toll‐like receptor signalling pathway.
Fig. 8.
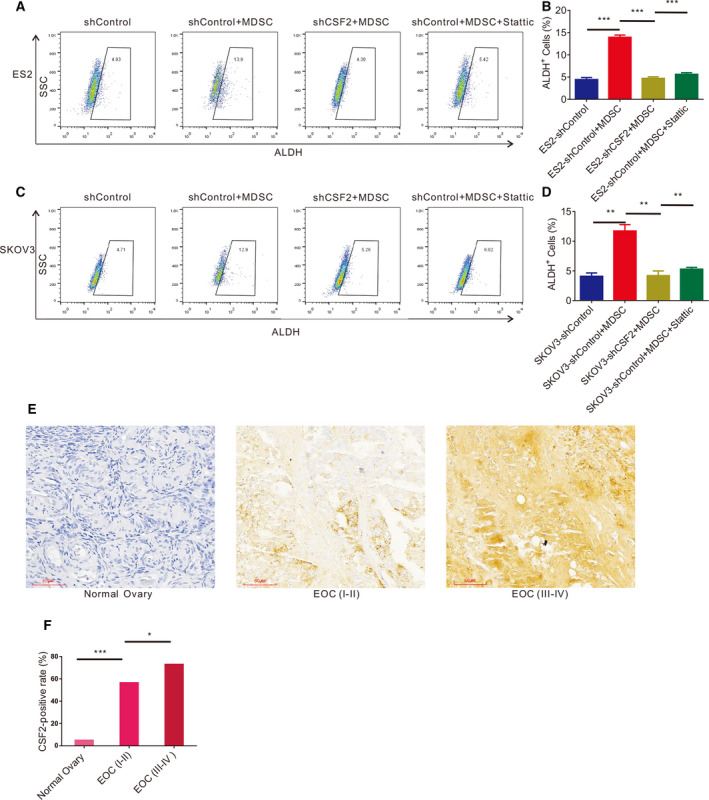
CSF2 expression is significantly correlated with clinical stage in EOC. (A, B) Flow cytometry analysis of the ALDH+ cells in ES2 cells transfected with the shControl or shCSF2 plasmid or treated with p‐STAT3 inhibitor Stattic cocultured with or without MDSCs. (C, D) Flow cytometry analysis of the ALDH+ cells in SKOV3 cells with the shControl or shCSF2 plasmid or treated with p‐STAT3 inhibitor Stattic and cultured with or without MDSCs. (E, F) Immunohistochemical analysis of CSF2 expression in normal ovary, EOC (Stage I–II) and EOC (Stage III–IV) tissue samples. Data were analysed using a nonparametric test, and statistically significant differences are presented as follows: *P < 0.01; **P < 0.001; and ***P < 0.001. Scale bar, 100 μm.
CSF2 expression is significantly correlated with clinical stage in epithelial ovarian cancer
Finally, we detected the expression level of CSF2 in 40 normal ovarian tissue sections and 60 EOC tissue sections. The clinical parameters of the patients are shown in Table 2. We observed that CSF2 expression in the ovarian tissue samples was significantly increased in the samples from EOC patients with lymphatic metastasis and stage III‐IV disease compared to the samples from normal samples. The positive rate of CSF2 expression in the EOC tissue samples was significantly higher than that in the normal ovarian tissue samples (66.7% vs. 5.00%, respectively) (Table 3 and Fig. 8E,F). Further analysis showed that the CSF2 expression level in the stage III‐IV EOC tissue samples was significantly higher than that in the stage I‐II EOC tissue samples (72.97% vs. 56.52%, respectively) (Table 3 and Fig. 8E,F). EOC patients with lymphatic metastasis had a higher CSF2‐positive rate in ovarian cancer tissue than patients without lymphatic metastasis (87.50% vs. 59.09%) (Table 3). Therefore, CSF2 expression is significantly correlated with clinical stage in EOC. It may be a crucial factor affecting the prognosis of EOC.
Table 2.
Clinical parameters of EOC patients.
| Parameter | Cases | CSF2 | P |
|---|---|---|---|
| Age | |||
| ≤ 55 year | 28 | 16 (57.14%) | > 0.050 |
| > 55 year | 32 | 24 (75.00%) | |
| FIGO stage | |||
| I–II | 23 | 13 (56.52%) | 0.031 |
| III–IV | 37 | 27 (72.97%) | |
| Lymphatic metastasis | |||
| Yes | 16 | 14 (87.50%) | 0.039 |
| No | 44 | 26 (59.09%) | |
| Distant metastasis | |||
| Yes | 2 | 2 (100.00%) | > 0.050 |
| No | 58 | 38 (65.51%) | |
Table 3.
Expression of CSF2 in normal ovary and EOC tissue samples
| FIGO stage | Number | Score | Positive rate (%) | χ2 | P | |||
|---|---|---|---|---|---|---|---|---|
| 0 | 1 | 2 | 3 | |||||
| Normal ovary | 40 | 38 | 3 | 0 | 0 | 5.00 | ||
| EOC (I–II) | 23 | 10 | 2 | 5 | 6 | 56.52 | 22.54 a | < 0.0001 a |
| EOC (III–IV) | 37 | 10 | 3 | 14 | 10 | 72.97 | 4.67 b | 0.031 b |
Normal ovary vs. EOC (I‐II)
EOC (I‐II) vs. EOC (III‐IV).
Discussion
Interactions between tumour cells and immune cells lead to immune editing [15], which promotes tumour immune escape and ultimately leads to tumour spread, recurrence and metastasis [16, 17]. CSCs contribute to tumour progression, metastasis and therapeutic resistance [18, 19, 20]. The mechanisms involving CSCs in ovarian cancer remain unclear. Studies have suggested that interactions between tumour cells and environmental signals in the tumour microenvironment may lead to tumour progression [21, 22, 23]. The important roles of mesenchymal stem cells, macrophages and bone marrow‐derived progenitor cells in environmental signals affecting tumour cells have been extensively studied in tumour‐bearing mouse models [21, 22, 23, 24, 25, 26, 27]. However, the major immunosuppressive components, MDSCs, are poorly understood in human cancers. This study demonstrates that, as an environmental signal in the tumour microenvironment, MDSCs promote the EOC stem cell phenotype and lead to tumour progression.
The immunosuppressive effects of MDSCs are relatively well studied in tumour‐bearing mouse models. MDSCs have been deeply studied in the process by which tumour cells evade immune surveillance and attack [28]. Initially, MDSCs in the ovarian tumour environment were described in 2004 as vascular leukocytes, the population of ovarian tumour‐associated leukocytes of unknown origin and surface markers such as F4/80 and CD11b [29, 30]. Recently published research confirmed that Snail induces cancer progression via upregulation of CXCR2 ligands and recruitment of MDSCs. Blocking CXCR2 represents an immunological therapeutic approach to inhibit the progression of Snail‐high tumours undergoing EMT [31]. Myeloid progenitor cells, including MDSCs and macrophages, are associated with cancer cell stemness [10, 11, 32]. It is known that MDSCs can enhance the stemness of human breast cancer cells through the IL‐6/STAT3 and NO/NOTCH signalling pathways [11]. In addition, it has been found that CSCs can secrete a macrophage migration inhibitor to promote the immunosuppressive function of MDSCs, thus causing immune escape [33]. However, there are few studies on the stemness of ovarian cancer cells induced by MDSCs. In 2013, MDSCs were first identified to promote ovarian cancer stem cell properties through the miRNA101‐CTBP2 network [10]. Our study further explored the mechanisms by which MDSCs promote the stemness of EOC cells.
It is well known that the biomarkers of CSCs include ALDH, CD133, and CD44, but there is no universally recognized marker for EOC stem cells [34]. Our experiments found that ALDH+ EOC cells highly expressed core molecules of stem cells and formed more tumour spheres than ALDH‐ EOC cells, so the study used ALDH as the biomarker of EOC stem cells. We found that the proportion of MDSCs was significantly increased in EOC patients and that MDSCs promoted the stemness of EOC cells. Then, we found that MDSCs significantly promoted the expression of CSF2 in EOC cells by mRNA microarray. We hypothesized that MDSCs enhanced EOC cell stemness via CSF2. Furthermore, we found that MDSCs might promote the stemness of EOC by inducing the CSF2/p‐STAT3 signalling pathway. Finally, we analysed the expression levels of CSF2 in 40 samples of normal ovarian tissue and 60 samples of EOC tissue, and we observed that CSF2 was significantly highly expressed in the EOC tissue samples. Furthermore, EOC patients expressing high levels of CSF2 were found to have advanced‐stage disease and lymph node metastasis.
Granulocyte‐macrophage CSF2 is now recognized as an immune modulatory cytokine produced by different cells, including macrophages, endothelial cells, alveolar epithelial cells and T cells [35, 36]. CSF2 plays a dominant role in the survival, proliferation, differentiation and function of myeloid lineage cells [37]. Some studies have suggested that CSF2 causes, or is a part of, an inflammatory response [38, 39], while others suggest that CSF2 promotes immunological tolerance by acting as an immunoregulatory cytokine [40, 41]. There is compelling evidence showing that various solid tumours secrete CSF2, including lung cancer, glioma, bladder cancer, head and neck cancer, melanoma, skin carcinoma and colorectal cancer [42, 43, 44, 45, 46, 47, 48, 49, 50]. There are conflicting results for the tumour signalling pathways associated with CSF2, with some studies showing an antitumour effect and others showing a tumour growth‐promoting effect [47, 51, 52, 53]. In studies related to ovarian cancer, most studies have found that CSF2 can inhibit tumour progression and even be used as a tumour vaccine to treat ovarian cancer [54, 55, 56, 57]. However, it is surprising that CSF2 stimulates the proliferation and migration of various types of tumour cells, including skin squamous cell carcinoma, glioma, head and neck squamous cell carcinoma and lung cancer cells, in vivo and in vitro through different mechanisms [46, 58, 59, 60].
In ovarian cancer, the role of CSF2 in promoting the phenotype of EOC stem cells has not been reported. Based on MDSCs promoting the EOC stem cell phenotype, we first found that MDSCs may promote EOC stemness by inducing the CSF2/p‐STAT3 pathway. Targeting MDSCs or CSF2 may be a reasonable strategy for enhancing the efficacy of conventional treatments. This finding may provide new ideas for manipulating the phenotype of ovarian cancer and reducing the drug resistance and recurrence of EOC.
Materials and methods
Human subjects
All experiments involving human subjects were undertaken with the understanding and written consent of each subject. The study methods conformed to the standards set by the Declaration of Helsinki. All use of human subjects in this study was approved by the Medical Ethics Committee at Shanghai First Maternity and Infant Hospital (KS18160). EOC and benign tumour patients diagnosed in the Shanghai First Maternity and Infant Hospital between June 2018 and June 2019 were recruited. We collected fresh PB from 20 patients with EOC or benign tumour. Fresh PB was processed into a single‐cell suspension and immediately used for the detection and separation of MDSCs. We also collected 40 samples of normal ovarian tissue and 60 samples of EOC tissue for immunohistochemistry (IHC) assays between April 2015 and January 2019 in the Shanghai First Maternity and Infant Hospital.
Culture conditions of EOC cell lines and MDSCs
The human EOC cell lines ES‐2, SKOV3 and HO‐8910 were obtained from the American Type Culture Collection (ATCC) and were cultured and passaged according to the manufacturer’s instructions. All cell lines were cultured in RPMI 1640 medium (HyClone, Logan, UT, USA) containing 10% FBS (Gibco, Carlsbad, CA, USA), 100 units per mL penicillin and 100 mg·mL−1 streptomycin at 37 °C in a humidified 5% CO2 incubator. MDSCs were also cultured under the same conditions.
Immunohistochemical analysis
Immunohistochemistry was performed as previously described [61]. Briefly, human tissue specimens were incubated with primary antibody against CSF2 (1 : 200; ProteinTech, Cat. No. 177662‐1‐AP, Rosemont, IL, USA), and then incubated with a secondary antibody, and finally stained with 3,3‐diaminobenzidine and haematoxylin. The slides were examined, and images were captured using the Nikon Eclipse TE2000 fluorescence microscope. According to the histologic scores, the intensity of staining was classified into four groups: high (3), medium (2), low (1), and negative (0). For statistical analysis, we divided the samples into two groups: negative expression (0) and positive expression (1, 2 or 3).
MDSC flow cytometry analysis
Peripheral blood mononuclear cells were isolated from the PB of EOC patients by density gradient centrifugation (Ficoll‐Paque Plus; GE Healthcare, Pittsburgh, PA, USA). After washing with PBS, the PBMCs were incubated with fluorophore‐conjugated antibodies against CD33 (BD, Cat. No. 561817, Franklin Lakes, NJ, USA), CD14 (BD, Cat. No. 562692), CD15 (BD, Cat. No. 560828), CD11b (BD, Cat. No. 557396), and HLA‐DR (BD, Cat. No. 555812) for 30 min. Finally, the PBMCs were detected by flow cytometry (BD, FACSCalibur) and analysed by flowjo 10.0 (Becton, Dickinson & Company, Franklin Lakes, NJ, USA). A morphological gate including mononuclear cells (MCs) (based on SSC and FSC properties) was applied before gating for MDSC subsets. The labels above the cytometric plots indicate the gated population analysed. Analysed markers are indicated on the axis of each cytometric plot. Representative dot plots of two subsets of MDSCs identified using a gating strategy, monocytic (M)‐MDSCs (HLA‐DR−/lowCD11b+CD33+CD14+ cells) and polymorphonuclear (PMN)‐MDSCs (HLA‐DR−/lowCD11b+CD33+CD15+ cells), are shown.
Isolation of MDSCs
Myeloid‐derived suppressor cells were isolated from the PB of EOC patients using CD33 beads (Miltenyi Biotec, Cat. No. 130‐045‐501, Bergisch Gladbach, Germany) and an MS column (Miltenyi Biotec, Cat. No. 130‐042‐201). The purity of the isolated cell population was determined using flow cytometry, and the frequency of CD11b+CD33+HLA‐DR−/low cells was > 85%.
CSC flow cytometry analysis and isolation
The AldeFluor Assay Kit (Stemcell Technologies, Cat. No. 01700, Vancouver, Canada) was used to determine the percentage of EOC cells expressing high levels of ALDH (ALDH+ EOC cells) according to the manufacturer’s instructions. Briefly, 1 × 10⁶ cells were incubated with the AldeFluor substrate for 45 min at 37 °C, with or without the ALDH inhibitor diethylaminobenzaldehyde. After incubation, ALDH+ cells were detected in the FITC channel with a flow cytometer (BD, FACSAria) using flowjo10.0 software. ALDH+ EOC cells and ALDH−/low EOC cells were sorted by FACS.
MDSC and EOC cell coculture
Myeloid‐derived suppressor cells were sorted by CD33 microbeads. EOC cells (2.5 × 10⁵ per mL) were noncontact cocultured with MDSCs (2.5 × 10⁵ per mL) in a transwell system in a 6‐well plate. After 24 h of coculture, we examined EOC cell phenotypes and function.
Plasmid transfection in EOC cells
To deplete the expression of CSF2, ES‐2, SKOV3 and HO8910 cells were treated with shCSF2 plasmids or nonfunctional scrambled control plasmids (GENECHEM, Shanghai, China) by using X‐tremeGENE HP DNA Transfection Reagent (Roche, Basel, Switzerland) according to the manufacturer’s instructions. The cells were harvested at 24–48 h post‐transfection for future experiments.
Inhibition of the p‐STAT3 signalling pathway
ES‐2, SKOV3 and HO8910 cells were incubated with the specific STAT3 phosphorylation inhibitor Stattic (20 μm) (Cat. HY‐13818; MCE, Monmouth Junction, NJ, USA) in 10% serum medium for 24 h. Control cells were treated with the same volume of DMSO. After incubation, the efficacy of p‐STAT3 inhibition was detected by western blotting. After 24 h of coculture with MDSCs and incubation with the specific STAT3 phosphorylation inhibitor Stattic (20 μm), we examined EOC cell phenotypes and function.
Colony formation assay
A total of 250 cells were plated into per well of a 6‐well plate and incubated for approximately 7–10 days in a cell culture incubator. Then, colonies were washed with 1xPBS. After fixation with 4% paraformaldehyde and staining with crystal violet, colonies of EOC cells were observed.
In vitro sphere formation
Myeloid‐derived suppressor cells were sorted from the PB of EOC patients as described above. EOC cells with or without MDSCs were plated in ultralow attachment surface 6‐well plates with serum‐free medium supplemented with bFGF (10 ng·mL−1; PeproTech, Rocky Hill, NJ, USA), EGF (20 ng·mL−1, PeproTech) and 0.4% BSA at a density of 1000 to 10 000 viable cells per well. After 2 weeks, the number of spheres in each well was counted using a phase‐contrast microscope.
Microarray assay
SKOV3 cells cultured with or without MDSCs were collected for microarray analysis. SKOV3 cells (2.5 × 10⁵) were cocultured with freshly sorted EOC‐associated MDSCs (5 × 10⁵) or medium in a transwell system (Corning, Corning, NY, USA) for 24 h. Then, RNA was extracted from the SKOV3 cells by using TRIzol reagent. The isolated RNAs were assessed by mRNA profiling via the Low Input Quick Amp Labelling Kit, One‐Colour (Cat. No. 5190‐2305l; Agilent Technologies, Santa Clara, CA, USA) at Shanghai Biotechnology Corp., Shanghai, China. The gene expression data files are available from the NCBI’s Gene Expression Omnibus (GEO) portal using accession number GSE145374.
Real‐time RT‐PCR
Real‐time RT‐PCR analysis was performed as previously described [61]. Briefly, total RNA from EOC cells was extracted by using TRIzol Reagent (Invitrogen, Carlsbad, CA, USA), and cDNA synthesis was performed by using the PrimeScript RT Master Mix Kit (TaKaRa BIO, Shiga, Japan) according to the manufacturer’s protocol. The mRNA expression level was detected by using the SuperReal PreMix Plus (SYBR Green) Kit (TaKaRa BIO) and the Applied Biosystems Step‐One Plus™ Real‐Time PCR System. β‐Actin served as an endogenous control for mRNAs. The method was used to calculate relative mRNA expression levels. The primer sequences (5'–3') used for real‐time PCR were as follows:
beta‐actin (forward): AACTCCATCATGAAGTGTGACG;
beta‐actin (reverse): GATCCACATCTGCTGGAAGG;
CSF2 (forward): TCCTGAACCTGAGTAGAGACAC;
CSF2 (reverse): TGCTGCTTGTAGTGGCTGG;
STAT3 (forward): CAGCAGCTTGACACACGGTA;
STAT3 (reverse): AAACACCAAAGTGGCATGTGA;
ICAM1 (forward): TTGGGCATAGAGACCCCGTT;
ICAM1 (reverse): GCACATTGCTCAGTTCATACACC;
BIRC3 (forward): AAGCTACCTCTCAGCCTACTTT;
BIRC3 (reverse): CCACTGTTTTCTGTACCCGGA;
IL‐32 (forward): TGGCGGCTTATTATGAGGAGC;
IL‐32 (reverse): CTCGGCACCGTAATCCATCTC;
TNFAIP3 (forward): TCCTCAGGCTTTGTATTTGAGC; and
TNFAIP3 (reverse): TGTGTATCGGTGCATGGTTTTA.
Western blot analysis
We extracted the total protein of the cells using RIPA lysis buffer (Cat. No. WB0102; WEIAO, Shanghai, China). The western blotting was conducted as previously described [61]. Briefly, a total of 15 µg of protein per sample was separated by 10% SDS/PAGE and transferred to PVDF membranes. The membranes were first incubated for 2 h at room temperature in 5% BSA and then incubated at 4 °C in BSA in TBS containing 0.1% Tween‐20 with primary antibodies against CSF2 (1 : 1000; Cat. No. 177662‐1‐AP; ProteinTech), STAT3 (1 : 1000; Cat. No. 4904; Cell Signalling Technology, Beverly, MA, USA), p‐STAT3 (1 : 1000; Cat. No. 4113; Cell Signalling Technology) and β‐actin (1 : 1000; Cat. No. 20536‐1‐AP; ProteinTech), followed by incubation with secondary antibodies (Cell Signalling Technology, Cat. No. 7074) conjugated with horseradish peroxidase at room temperature for 1 h. The protein bands were detected by using an enhanced chemiluminescence plus kit (Cat. No. WBULS0500; Millipore, Billerica, MA, USA) as recommended by the manufacturer.
Statistical analysis
All experiments were repeated at least three times in duplicate. Data are presented as the mean ± SD. Differences between treated and control groups were analysed using Student’s t‐test and a nonparametric test. The level of significance was set at P < 0.05. All statistical analyses were performed with spss 20.0 software (IBM Software, Armonk, NY, USA).
Conflict of interest
The authors declare no conflict of interest.
Author contributions
XL and JW conceived and designed the experiments, performed most of them, and wrote, edited and submitted the manuscript. WW, HG and NL helped with the assays and participated in the interpretation of the data. GZ and LL helped with collection of clinical specimens. LH and XG conceived, designed and supervised the whole project and provided the requested funding.
Acknowledgements
We greatly appreciate Clinical and Translational Research Center, Shanghai First Maternity and Infant Hospital, Tongji University School of Medicine, for providing an experimental platform for this paper. This work was supported by National Natural Science Foundation of China, Grant/ Award Number: 81572546; Shanghai First Maternity and Infant Hospital, Grant/ Award Number: 2018C06; National Natural Science Foundation of China, Grant/ Award Number: 81972422; and National Natural Science Foundation of China, Grant/ Award Number: 81601309.
Xiaofeng Li and Jiapo Wang contributed equally to this work
Contributor Information
Lingfei Han, Email: lingfeihan@126.com.
Xiaoqing Guo, Email: Xiaoqing_Guo@tongji.edu.cn.
References
- 1. Malpica A, Deavers MT, Lu K, Bodurka DC, Atkinson EN, Gershenson DM & Silva EG (2004) Grading ovarian serous carcinoma using a two‐tier system. Am J Surg Pathol 28, 496–504. [DOI] [PubMed] [Google Scholar]
- 2. Farley J, Ozbun LL & Birrer MJ (2008) Genomic analysis of epithelial ovarian cancer. Cell Res 18, 538–548. [DOI] [PMC free article] [PubMed] [Google Scholar]
- 3. Karst AM & Drapkin R (2010) Ovarian cancer pathogenesis: a model in evolution. J Oncol 2010, 932371. [DOI] [PMC free article] [PubMed] [Google Scholar]
- 4. Pardoll DM (2012) The blockade of immune checkpoints in cancer immunotherapy. Nat Rev Cancer 12, 252–264. [DOI] [PMC free article] [PubMed] [Google Scholar]
- 5. Schreiber RD, Old LJ & Smyth MJ (2011) Cancer immunoediting: integrating immunity's roles in cancer suppression and promotion. Science 331, 1565–1570. [DOI] [PubMed] [Google Scholar]
- 6. Marvel D & Gabrilovich DI (2015) Myeloid‐derived suppressor cells in the tumor microenvironment: expect the unexpected. J Clin Invest 125, 3356–3364. [DOI] [PMC free article] [PubMed] [Google Scholar]
- 7. Bonnet D & Dick JE (1997) Human acute myeloid leukemia is organized as a hierarchy that originates from a primitive hematopoietic cell. Nat Med 3, 730–737. [DOI] [PubMed] [Google Scholar]
- 8. Kryczek I, Liu S, Roh M, Vatan L, Szeliga W, Wei S, Banerjee M, Mao Y, Kotarski J, Wicha MS et al (2012) Expression of aldehyde dehydrogenase and CD133 defines ovarian cancer stem cells. Int J Cancer 130, 29–39. [DOI] [PMC free article] [PubMed] [Google Scholar]
- 9. Chen WJ, Ho CC, Chang YL, Chen HY, Lin CA, Ling TY, Yu SL, Yuan SS, Chen YJ, Lin CY et al (2014) Cancer‐associated fibroblasts regulate the plasticity of lung cancer stemness via paracrine signalling. Nat Commun 5, 3472. [DOI] [PubMed] [Google Scholar]
- 10. Cui TX, Kryczek I, Zhao L, Zhao E, Kuick R, Roh MH, Vatan L, Szeliga W, Mao Y, Thomas DG et al (2013) Myeloid‐derived suppressor cells enhance stemness of cancer cells by inducing microRNA101 and suppressing the corepressor CtBP2. Immunity 39, 611–621. [DOI] [PMC free article] [PubMed] [Google Scholar]
- 11. Peng D, Tanikawa T, Li W, Zhao L, Vatan L, Szeliga W, Wan S, Wei S, Wang Y, Liu Y et al (2016) Myeloid‐derived suppressor cells endow stem‐like qualities to breast cancer cells through IL6/STAT3 and NO/NOTCH Cross‐Talk Signaling. Cancer Res 76, 3156–3165. [DOI] [PMC free article] [PubMed] [Google Scholar]
- 12. Weber R, Fleming V, Hu X, Nagibin V, Groth C, Altevogt P, Utikal J & Umansky V (2018) Myeloid‐derived suppressor cells hinder the anti‐cancer activity of immune checkpoint inhibitors. Front Immunol 9, 1310. [DOI] [PMC free article] [PubMed] [Google Scholar]
- 13. Xu X, Chai S, Wang P, Zhang C, Yang Y, Yang Y & Wang K (2015) Aldehyde dehydrogenases and cancer stem cells. Cancer Lett 369, 50–57. [DOI] [PubMed] [Google Scholar]
- 14. Deng J, Li Y, Pennati A, Yuan S, Wu JH, Waller EK & Galipeau J (2017) GM‐CSF and IL‐4 fusion cytokine induces B cell‐dependent hematopoietic regeneration. Mol Ther 25, 416–426. [DOI] [PMC free article] [PubMed] [Google Scholar]
- 15. Dunn GP, Bruce AT, Ikeda H, Old LJ & Schreiber RD (2002) Cancer immunoediting: from immunosurveillance to tumor escape. Nat Immunol 3, 991–998. [DOI] [PubMed] [Google Scholar]
- 16. Pirker R, Pereira JR, von Pawel J, Krzakowski M, Ramlau R, Park K, de Marinis F, Eberhardt WE, Paz‐Ares L, Storkel S et al (2012) EGFR expression as a predictor of survival for first‐line chemotherapy plus cetuximab in patients with advanced non‐small‐cell lung cancer: analysis of data from the phase 3 FLEX study. Lancet Oncol 13, 33–42. [DOI] [PubMed] [Google Scholar]
- 17. Zou W (2005) Immunosuppressive networks in the tumour environment and their therapeutic relevance. Nat Rev Cancer 5, 263–274. [DOI] [PubMed] [Google Scholar]
- 18. Bronte V & Zanovello P (2005) Regulation of immune responses by L‐arginine metabolism. Nat Rev Immunol 5, 641–654. [DOI] [PubMed] [Google Scholar]
- 19. Dean M, Fojo T & Bates S (2005) Tumour stem cells and drug resistance. Nat Rev Cancer 5, 275–284. [DOI] [PubMed] [Google Scholar]
- 20. Pardal R, Clarke MF & Morrison SJ (2003) Applying the principles of stem‐cell biology to cancer. Nat Rev Cancer 3, 895–902. [DOI] [PubMed] [Google Scholar]
- 21. Karnoub AE, Dash AB, Vo AP, Sullivan A, Brooks MW, Bell GW, Richardson AL, Polyak K, Tubo R & Weinberg RA (2007) Mesenchymal stem cells within tumour stroma promote breast cancer metastasis. Nature 449, 557–563. [DOI] [PubMed] [Google Scholar]
- 22. Kim S, Takahashi H, Lin WW, Descargues P, Grivennikov S, Kim Y, Luo JL & Karin M (2009) Carcinoma‐produced factors activate myeloid cells through TLR2 to stimulate metastasis. Nature 457, 102–106. [DOI] [PMC free article] [PubMed] [Google Scholar]
- 23. Liu C, Kelnar K, Liu B, Chen X, Calhoun‐Davis T, Li H, Patrawala L, Yan H, Jeter C, Honorio S et al (2011) The microRNA miR‐34a inhibits prostate cancer stem cells and metastasis by directly repressing CD44. Nat Med 17, 211–215. [DOI] [PMC free article] [PubMed] [Google Scholar]
- 24. Dawson MR, Duda DG, Fukumura D & Jain RK (2009) VEGFR1‐activity‐independent metastasis formation, Nature.461, E4. discussion E5. [DOI] [PMC free article] [PubMed] [Google Scholar]
- 25. DeNardo DG, Brennan DJ, Rexhepaj E, Ruffell B, Shiao SL, Madden SF, Gallagher WM, Wadhwani N, Keil SD, Junaid SA et al (2011) Leukocyte complexity predicts breast cancer survival and functionally regulates response to chemotherapy. Cancer Discov 1, 54–67. [DOI] [PMC free article] [PubMed] [Google Scholar]
- 26. Kaplan RN, Riba RD, Zacharoulis S, Bramley AH, Vincent L, Costa C, MacDonald DD, Jin DK, Shido K, Kerns SA et al (2005) VEGFR1‐positive haematopoietic bone marrow progenitors initiate the pre‐metastatic niche. Nature 438, 820–827. [DOI] [PMC free article] [PubMed] [Google Scholar]
- 27. Qian BZ, Li J, Zhang H, Kitamura T, Zhang J, Campion LR, Kaiser EA, Snyder LA & Pollard JW (2011) CCL2 recruits inflammatory monocytes to facilitate breast‐tumour metastasis. Nature 475, 222–225. [DOI] [PMC free article] [PubMed] [Google Scholar]
- 28. Gabrilovich DI & Nagaraj S (2009) Myeloid‐derived suppressor cells as regulators of the immune system. Nat Rev Immunol 9, 162–174. [DOI] [PMC free article] [PubMed] [Google Scholar]
- 29. Conejo‐Garcia JR, Benencia F, Courreges MC, Kang E, Mohamed‐Hadley A, Buckanovich RJ, Holtz DO, Jenkins A, Na H, Zhang L et al (2004) Tumor‐infiltrating dendritic cell precursors recruited by a beta‐defensin contribute to vasculogenesis under the influence of Vegf‐A. Nat Med 10, 950–958. [DOI] [PubMed] [Google Scholar]
- 30. Conejo‐Garcia JR, Buckanovich RJ, Benencia F, Courreges MC, Rubin SC, Carroll RG & Coukos G (2005) Vascular leukocytes contribute to tumor vascularization. Blood 105, 679–681. [DOI] [PubMed] [Google Scholar]
- 31. Taki M, Abiko K, Baba T, Hamanishi J, Yamaguchi K, Murakami R, Yamanoi K, Horikawa N, Hosoe Y, Nakamura E et al (2018) Snail promotes ovarian cancer progression by recruiting myeloid‐derived suppressor cells via CXCR2 ligand upregulation. Nat Commun 9, 1685. [DOI] [PMC free article] [PubMed] [Google Scholar]
- 32. Wan S, Zhao E, Kryczek I, Vatan L, Sadovskaya A, Ludema G, Simeone DM, Zou W & Welling TH (2014) Tumor‐associated macrophages produce interleukin 6 and signal via STAT3 to promote expansion of human hepatocellular carcinoma stem cells. Gastroenterology 147, 1393–1404. [DOI] [PMC free article] [PubMed] [Google Scholar]
- 33. Yaddanapudi K, Putty K, Rendon BE, Lamont GJ, Faughn JD, Satoskar A, Lasnik A, Eaton JW & Mitchell RA (2013) Control of tumor‐associated macrophage alternative activation by macrophage migration inhibitory factor. J Immunol 190, 2984–2893. [DOI] [PMC free article] [PubMed] [Google Scholar]
- 34. Mimeault M & Batra SK (2014) Molecular biomarkers of cancer stem/progenitor cells associated with progression, metastases, and treatment resistance of aggressive cancers. Cancer Epidemiol Biomarkers Prev 23, 234–254. [DOI] [PMC free article] [PubMed] [Google Scholar]
- 35. Fleetwood AJ, Cook AD & Hamilton JA (2005) Functions of granulocyte‐macrophage colony‐stimulating factor. Critic Rev Immunol 25, 405–428. [DOI] [PubMed] [Google Scholar]
- 36. Ponomarev ED, Shriver LP, Maresz K, Pedras‐Vasconcelos J, Verthelyi D & Dittel BN (2007) GM‐CSF production by autoreactive T cells is required for the activation of microglial cells and the onset of experimental autoimmune encephalomyelitis. J Immunol 178, 39–48. [DOI] [PubMed] [Google Scholar]
- 37. Hamilton JA (2008) Colony‐stimulating factors in inflammation and autoimmunity. Nat Rev Immunol 8, 533–544. [DOI] [PubMed] [Google Scholar]
- 38. El‐Behi M, Ciric B, Dai H, Yan Y, Cullimore M, Safavi F, Zhang GX, Dittel BN & Rostami A (2011) The encephalitogenicity of T(H)17 cells is dependent on IL‐1‐ and IL‐23‐induced production of the cytokine GM‐CSF. Nat Immunol 12, 568–575. [DOI] [PMC free article] [PubMed] [Google Scholar]
- 39. van Nieuwenhuijze A, Koenders M, Roeleveld D, Sleeman MA, van den Berg W & Wicks IP (2013) GM‐CSF as a therapeutic target in inflammatory diseases. Mol Immunol 56, 675–682. [DOI] [PubMed] [Google Scholar]
- 40. Parmiani G, Castelli C, Pilla L, Santinami M, Colombo MP & Rivoltini L (2007) Opposite immune functions of GM‐CSF administered as vaccine adjuvant in cancer patients. Ann Oncol 18, 226–232. [DOI] [PubMed] [Google Scholar]
- 41. Kohanbash G, McKaveney K, Sakaki M, Ueda R, Mintz AH, Amankulor N, Fujita M, Ohlfest JR & Okada H (2013) GM‐CSF promotes the immunosuppressive activity of glioma‐infiltrating myeloid cells through interleukin‐4 receptor‐alpha. Cancer Res 73, 6413–6423. [DOI] [PMC free article] [PubMed] [Google Scholar]
- 42. Chen Z, Malhotra PS, Thomas GR, Ondrey FG, Duffey DC, Smith CW, Enamorado I, Yeh NT, Kroog GS, Rudy S et al (1999) Expression of proinflammatory and proangiogenic cytokines in patients with head and neck cancer. Clin Cancer Res 5, 1369–1379. [PubMed] [Google Scholar]
- 43. Demirci U, Coskun U, Sancak B, Ozturk B, Bahar B, Benekli M & Buyukberber S (2009) Serum granulocyte macrophage‐colony stimulating factor: a tumor marker in colorectal carcinoma? Asian Pac J Cancer Prev 10, 1021–1024. [PubMed] [Google Scholar]
- 44. Lammel V, Stoeckle C, Padberg B, Zweifel R, Kienle DL, Reinhart WH & Simon HU (2012) Hypereosinophilia driven by GM‐CSF in large‐cell carcinoma of the lung. Lung Cancer 76, 493–495. [DOI] [PubMed] [Google Scholar]
- 45. Meyer C, Sevko A, Ramacher M, Bazhin AV, Falk CS, Osen W, Borrello I, Kato M, Schadendorf D, Baniyash M et al (2011) Chronic inflammation promotes myeloid‐derived suppressor cell activation blocking antitumor immunity in transgenic mouse melanoma model. Proc Natl Acad Sci USA 108, 17111–17116. [DOI] [PMC free article] [PubMed] [Google Scholar]
- 46. Mueller MM, Herold‐Mende CC, Riede D, Lange M, Steiner HH & Fusenig NE (1999) Autocrine growth regulation by granulocyte colony‐stimulating factor and granulocyte macrophage colony‐stimulating factor in human gliomas with tumor progression. Am J Pathol 155, 1557–1567. [DOI] [PMC free article] [PubMed] [Google Scholar]
- 47. Obermueller E, Vosseler S, Fusenig NE & Mueller MM (2004) Cooperative autocrine and paracrine functions of granulocyte colony‐stimulating factor and granulocyte‐macrophage colony‐stimulating factor in the progression of skin carcinoma cells. Cancer Res 64, 7801–7812. [DOI] [PubMed] [Google Scholar]
- 48. Oshika Y, Nakamura M, Abe Y, Fukuchi Y, Yoshimura M, Itoh M, Ohnishi Y, Tokunaga T, Fukushima Y, Hatanaka H et al (1998) Growth stimulation of non‐small cell lung cancer xenografts by granulocyte‐macrophage colony‐stimulating factor (GM‐CSF). Eur J Cancer 34, 1958–1961. [DOI] [PubMed] [Google Scholar]
- 49. Perez FA, Fligner CL & Yu EY (2009) Rapid clinical deterioration and leukemoid reaction after treatment of urothelial carcinoma of the bladder: possible effect of granulocyte colony‐stimulating factor. J Clin Oncol 27, e215–e217. [DOI] [PubMed] [Google Scholar]
- 50. Wetzler M, Estrov Z, Talpaz M, Markowitz A, Gutterman JU & Kurzrock R (1993) Granulocyte‐macrophage colony‐stimulating factor as a cause of paraneoplastic leukaemoid reaction in advanced transitional cell carcinoma. J Intern Med 234, 417–420. [DOI] [PubMed] [Google Scholar]
- 51. Aliper AM, Frieden‐Korovkina VP, Buzdin A, Roumiantsev SA & Zhavoronkov A (2014) A role for G‐CSF and GM‐CSF in nonmyeloid cancers. Cancer Med 3, 737–746. [DOI] [PMC free article] [PubMed] [Google Scholar]
- 52. Roda JM, Wang Y, Sumner LA, Phillips GS, Marsh CB & Eubank TD (2012) Stabilization of HIF‐2alpha induces sVEGFR‐1 production from tumor‐associated macrophages and decreases tumor growth in a murine melanoma model. J Immunol 189, 3168–3177. [DOI] [PMC free article] [PubMed] [Google Scholar]
- 53. Urdinguio RG, Fernandez AF, Moncada‐Pazos A, Huidobro C, Rodriguez RM, Ferrero C, Martinez‐Camblor P, Obaya AJ, Bernal T, Parra‐Blanco A et al (2013) Immune‐dependent and independent antitumor activity of GM‐CSF aberrantly expressed by mouse and human colorectal tumors. Cancer Res 73, 395–405. [DOI] [PubMed] [Google Scholar]
- 54. Liao JB, Swensen RE, Ovenell KJ, Hitchcock‐Bernhardt KM, Reichow JL, Apodaca MC, D'Amico L, Childs JS, Higgins DM, Buening BJ et al (2017) Phase II trial of albumin‐bound paclitaxel and granulocyte macrophage colony‐stimulating factor as an immune modulator in recurrent platinum resistant ovarian cancer. Gynecol Oncol 144, 480–485. [DOI] [PubMed] [Google Scholar]
- 55. Mookerjee A, Graciotti M & Kandalaft L (2018) A cancer vaccine with dendritic cells differentiated with GM‐CSF and IFNalpha and pulsed with a squaric acid treated cell lysate improves T cell priming and tumor growth control in a mouse model. Bioimpacts 8, 211–221. [DOI] [PMC free article] [PubMed] [Google Scholar]
- 56. Reggiani F, Labanca V, Mancuso P, Rabascio C, Talarico G, Orecchioni S, Manconi A & Bertolini F (2017) Adipose progenitor cell secretion of GM‐CSF and MMP9 promotes a stromal and immunological microenvironment that supports breast cancer progression. Cancer Res 77, 5169–5182. [DOI] [PubMed] [Google Scholar]
- 57. Spear P, Barber A, Rynda‐Apple A & Sentman CL (2012) Chimeric antigen receptor T cells shape myeloid cell function within the tumor microenvironment through IFN‐gamma and GM‐CSF. J Immunol 188, 6389–6398. [DOI] [PMC free article] [PubMed] [Google Scholar]
- 58. Montag M, Dyckhoff G, Lohr J, Helmke BM, Herrmann E, Plinkert PK & Herold‐Mende C (2009) Angiogenic growth factors in tissue homogenates of HNSCC: expression pattern, prognostic relevance, and interrelationships. Cancer Sci 100, 1210–1218. [DOI] [PMC free article] [PubMed] [Google Scholar]
- 59. Mueller MM & Fusenig NE (1999) Constitutive expression of G‐CSF and GM‐CSF in human skin carcinoma cells with functional consequence for tumor progression. Int J Cancer 83, 780–789. [DOI] [PubMed] [Google Scholar]
- 60. Pei XH, Nakanishi Y, Takayama K, Bai F & Hara N (1999) Granulocyte, granulocyte‐macrophage, and macrophage colony‐stimulating factors can stimulate the invasive capacity of human lung cancer cells. Br J Cancer 79, 40–46. [DOI] [PMC free article] [PubMed] [Google Scholar]
- 61. Wu W, Gao H, Li X, Peng S, Yu J, Liu N, Zhan G, Zhu Y, Wang K & Guo X (2019) beta‐hCG promotes epithelial ovarian cancer metastasis through ERK/MMP2 signaling pathway. Cell Cycle 18, 46–59. [DOI] [PMC free article] [PubMed] [Google Scholar]


