

Abstract
The HV1 voltage‐gated proton (HV1) channel is a key component of the cellular proton extrusion machinery and is pivotal for charge compensation during the respiratory burst of phagocytes. The best‐described physiological inhibitor of HV1 is Zn2+. Externally applied ZnCl2 drastically reduces proton currents reportedly recorded in Homo sapiens, Rattus norvegicus, Mus musculus, Oryctolagus cuniculus, Rana esculenta, Helix aspersa, Ciona intestinalis, Coccolithus pelagicus, Emiliania huxleyi, Danio rerio, Helisoma trivolvis, and Lingulodinium polyedrum, but with considerable species variability. Here, we report the effects of Zn2+ and Cd2+ on HV1 from Nicoletia phytophila, NpHV1. We introduced mutations at potential Zn2+ coordination sites and measured Zn2+ inhibition in different extracellular pH, with Zn2+ concentrations up to 1000 μm. Zn2+ inhibition in NpHV1 was quantified by the slowing of the activation time constant and a positive shift of the conductance–voltage curve. Replacing aspartate in the S3‐S4 loop with histidine (D145H) enhanced both the slowing of activation kinetics and the shift in the voltage–conductance curve, such that Zn2+ inhibition closely resembled that of the human channel. Histidine is much more effective than aspartate in coordinating Zn2+ in the S3‐S4 linker. A simple Hodgkin Huxley model of NpHV1 suggests a decrease in the opening rate if it is inhibited by zinc or cadmium. Limiting slope measurements and high‐resolution clear native gel electrophoresis (hrCNE) confirmed that NpHV1 functions as a dimer. The data support the hypothesis that zinc is coordinated in between the dimer instead of the monomer. Zinc coordination sites may be potential targets for drug development.
Keywords: HV1, ion channel, patch‐clamp, structure–function, zinc
Zinc is bound or coordinated by numerous enzymes. However, the amino acids, involved in zinc coordination, differ between the proteins. Zinc inhibition of the insect voltage‐gated proton channel (NpHV1) suggests binding at the dimer interface. Zinc competes with protons and is interlocking both monomers in a nonconductive state. The mechanism of inhibition is a nonelectrostatic binding and not a block of the proton permeation pathway through the channel.

Abbreviations
- Asp145
aspartate at position 145
- gH,max
maximal proton conductance
- gH,max/10
10% of the maximal proton conductance
- gH‐V
proton conductance–voltage relationship
- hHV1
human voltage‐gated proton channel
- HV1
voltage‐gated proton channel 1
- NpHV1
Nicoletia phytophila voltage‐gated proton channel 1
- pHi
pH inside the cell
- pHo
pH outside the cell
- TM
transmembrane domain
- TMA
tetramethylammonium
- TSA
Transcriptome Shotgun Assembly
- Vrev
reversal potential
- Vthreshold
threshold potential
Introduction
The voltage‐gated proton channel was discovered in 1982 by Thomas and Meech [1]. Since then, there has been an ever‐growing number of articles published, investigating this special ion channel. In 2006, two scientific groups independently discovered the gene coding for the voltage‐gated proton channel in mouse, human and Ciona intestinalis [2, 3]. This made it possible to screen the genetic code of other species for HV1s [4, 5, 6, 7, 8, 9, 10] and express the putative channels heterologously or measure the channel directly in isolated native cells. Until today, there is only one proton channel gene described per species investigated.
Voltage‐gated proton channels serve numerous tasks in cell physiology, pathophysiology, and pH homeostasis [11]. They control internal pH [4, 12, 13, 14], regulate external pH [15, 16, 17], are responsible for the charge compensation during the oxidative burst [18, 19, 20, 21, 22, 23, 24, 25, 26], allow sperm maturation [27], control histamine release in basophils [28], are connected with invasiveness of cancer cells [29, 30, 31, 32], play a role in B‐cell receptor function [33], are enriched in malignant B cells [34], function in mast cells [35], influence the outcome of stroke [36], regulate pH in alveolar epithelium [37], acidify mucosa in asthma [38], control microglial [39] ROS production in the brain [40], set membrane potential in activated eosinophils [41], sustain calcium entry in neutrophils [26], inhibit immature B‐cell maturation if overexpressed [42], and trigger bioluminescence [8, 9]. All these physiological tasks depend on the biophysical properties of the channel, several of which are unique to voltage‐gated proton channels.
The voltage‐gated proton channel has many properties that are unusual in comparison with the classic voltage‐gated ion channels. One of the hallmarks is their extreme selectivity for protons over other cations which is at least 106 [43]. Reversal potential measurements in several studies show perfect proton selectivity unchanged by other ions [1, 9, 44, 45, 46, 47]. Other highly selective channels do not show this exclusiveness for a cation. Voltage‐gated sodium channels for instance conduct protons with even 274‐fold higher permeability than sodium [48, 49]. Here, one has to take into account that the concentration of sodium is a million times higher than protons in physiological solutions. Thus, despite the high relative permeability of H+/Na+, a million sodium ions compete with one proton for permeation, which results in sodium being effectively conducted. Consequently, protons have a considerable disadvantage in numbers in physiological solutions, so that HV1 must compensate by extreme selectivity. Furthermore, HV1 is extraordinary, because its voltage dependence is strongly dependent on internal and external pH. This property is unique in comparison with the voltage‐gated sodium channels, which show smaller and more variable changes in voltage dependence by changes in pH [50]. HV1 adjusts its voltage dependence in accordance with the pH gradient across the membrane [51]. The dependence can be expressed in an equation V threshold = V slope × V rev + V offset. For proton channels, in general, this results in a 40 mV change in threshold per unit pH [52, 53]. The pH‐dependent voltage dependence allows the channel to conduct protons out of a cell but prohibits protons entering the cytoplasm. The function is comparable with an overpressure valve and makes HV1 an effective part in the proton extrusion machinery of the cell.
Until today, no specific blocker/inhibitor of the channel has been found. However, many interesting inhibitor candidates are under investigation [54, 55, 56, 57, 58, 59]. The well investigated is the transition metal zinc, which was given its modern name by the sixteenth‐century academic Paracelsus. Zn2+ competes with protons for binding sites on the extracellular part of the ion channel. Zn2+ therefore has strong effects in alkaline solutions, while in acidic solutions there is minimal inhibition of the channel current. Detailed analysis of the Rattus norvegicus proton channel showed a remarkable dependence on the pH that could be explained if Zn2+ competed with two or more externally exposed His [60]. As external protons and Zn2+ both slow activation and shift the g H‐V relationship positively, it was suggested that Zn2+ might bind at the sites that govern the ΔpH dependence of gating. However, a study investigating the pH dependence of a Zn2+‐insensitive human proton channel (hHV1 with mutation of two His that are critical for Zn2+ inhibition) observed normal ΔpH dependence, disproving this hypothesis [61]. Therefore, pH dependence of gating and Zn2+ inhibition are two independent properties of HV1, despite their remarkable similarities.
Zinc sensitivity of the human proton channel has been ascribed to two conserved histidines accessible at the external transmembrane domains of HV1 [2, 62]. However, there is an ongoing scientific discussion how the zinc is coordinated in the channel. An early suggestion was that zinc is coordinated between the monomers in the interface of the dimer, supported by the low zinc sensitivity of the HV1 monomer [62]. The crystal structure of a mouse chimeric channel suggested zinc binding in each monomer of the proton channel dimer [63]. Iwaki et al. [64] proposed that zinc is coordinated in the monomer. The restriction to binding in the monomer was supported by Qiu et al. [65]. De La Rosa et al. [66] report the binding of zinc exclusively in the monomer. In the present study, we hope to clarify amino acids involved in zinc binding as well as the nature of the coordination.
Several organisms live in an environment with zinc concentrations ranging from low to almost no zinc. Others have zinc concentrations in their blood that are higher than in humans or mice [6]. Therefore, adaptation of the zinc sensitivity is necessary to ensure the functionality of HV1 in these species. Teleologically, one would expect that zinc binding of HV1 is not highly conserved in the phylogeny. However, in species with high zinc sensitivity one could suspect the voltage‐gated proton channel might, in addition to being a proton extruder, serve as an external zinc sensor for the cell.
Our focus in this study is on an insect proton channel (NpHV1) discovered in 2016 by Chaves et al. In contrast to the human or mouse voltage‐gated proton channel, NpHV1 lacks the second histidine in the S3‐S4 loop. Instead, it has an aspartate at the corresponding position (Fig. 3). Therefore, we were interested in investigating in detail how zinc would affect the channel at various zinc concentrations and at pHo ranging from 5 to 8. Our findings confirm that NpHV1 is much less zinc sensitive than human, rat, and mouse HV1 channels. Furthermore, the Zn2+ sensitivity of several mutants of NpHV1 reveals that high‐affinity binding of Zn2+ to HV1 channels mainly depends on the presence of the two external histidines. The aspartate in the S3‐S4 external loop of the channel contributes minimally to zinc inhibition, but does not coordinate zinc as effectively as a histidine at the same position. We additionally investigated histidine substitution mutants with limiting slope and instantaneous current relationship to elucidate zinc sensitivity of NpHV1, and we used high‐resolution clear native electrophoresis and SDS gels to determine oligomerization. We generated a simple Hodgkin Huxley model of NpHV1. Cadmium inhibition in WT NpHV1 was recorded and compared to zinc inhibition. The model suggests that zinc and cadmium preferentially decrease the rate of channel opening implying binding to the resting channel. Taken together, the evidence supports NpHV1 existing as a dimer and cadmium and zinc are probably coordinated in the dimer interface.
Fig. 3.
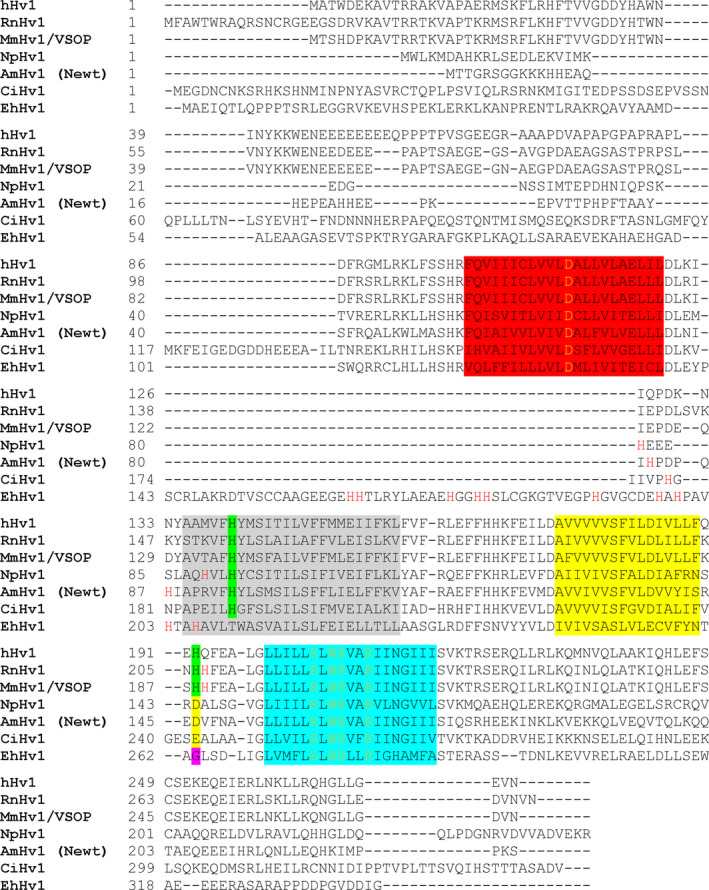
Alignment of human, rat, mouse, insect, newt, sea squirt, and algae proton channels. Alignment of the seven voltage‐gated proton channels. Location of the transmembrane domains is highlighted S1 = red, S2 = gray, S3 = yellow, S4 = turquoise. Potential zinc‐coordinating residues are highlighted green. Externally accessible histidines are colored red if not highlighted. The aspartate responsible for selectivity is colored yellow, and the signature sequence for proton channels RxWRxxR is colored orange. Aspartate 145 of NpHV1 is shaded yellow at the corresponding position of histidines, and glycine is labeled too. The proton channels are abbreviated as the following: hHV1 = human, RnHV1 = rat, MmHV1/VSOP = mouse, NpHV1 = Nicoletia phytophila, AmHV1 = Ambystoma mexicanum[95], CiHV1 = Ciona intestinalis, and EhHV1 = Emiliania huxleyi.
Results
Zn2+ inhibition of NpHV1 WT proton current
Zinc inhibition is one of the hallmarks of voltage‐gated proton channels. The effect of zinc has been described as an allosteric inhibition of the channel outside of the conduction pathway for protons. Analysis of the zinc inhibition showed slowing of τact and a positive g H‐V shift of the proton currents. Both effects are interconnected, and thus, strong slowing of the activation kinetics results in a considerable positive shift of the g H‐V. Zn2+ binding promotes a closed state, greater depolarization is required to open channels, and the resulting opening kinetics is slowed. Physiologically, this means that the extrusion of protons from the cell through HV1 is greatly impaired, which would result in cytosolic proton accumulation and a pHi drop.
We cloned NpHV1 and its mutants into the pQBI25‐fC3 plasmid, which is the same plasmid we use to express the human channel. This allows us to compare our results directly with the results from hHV1 [62]. Expression of both WT and mutant NpHV1 in tsA201 cells was very reliable. NpHV1 WT and mutant currents had a mean conductance of 1.5 nS·pF−1. Transfected tsA201 cell capacity was 9.6 ± 3.7 pF (SD) in 65 cells analyzed. Mean conductance density of all analyzed cells 1.44 nS·pF−1.
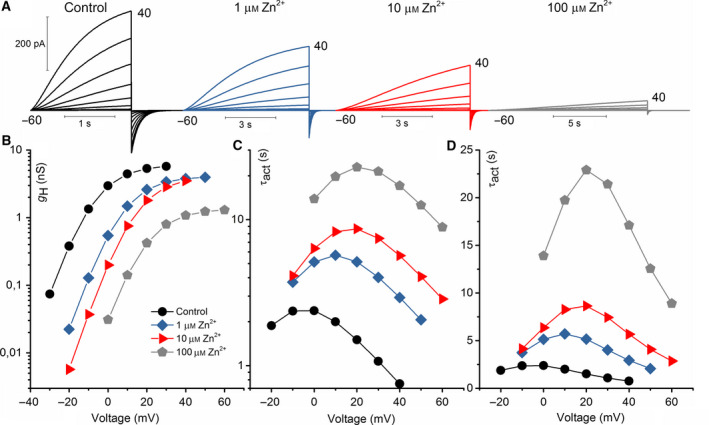
Figure 1A shows the effects of various zinc concentrations ranging from 0 to 100 μm at pHo 7 on WT NpHV1. There is a detectable shift in the g H‐V. While at concentrations of 1 μm Zn2+ and 10 μm Zn2+ g H‐V shifts are small, at 100 μm Zn2+ the g H‐V shift is around 30 mV (Fig. 1B). The slowing of activation kinetics is already measurable at low concentrations of Zn2+. Elevated [Zn2+] slows the activation kinetics of the channel greatly, as can be seen in the changed timebases. Fig. 1C shows the time constants of activation, revealing slowing at all voltages. In Fig. 1C, the voltage dependence of τact can be deduced with a slope of −0.0343 e‐fold sec/mV for all [Zn2+], which translates into 29 mV/e‐fold change. Although τact is extremely temperature‐dependent [73], its voltage dependence of gating is unaffected by temperature within the physiological range [73, 74]. Therefore, without analyzing the temperature dependence of NpHV1, we conclude that the 29 mV/e‐fold change represents the voltage dependence of channel opening kinetics. Furthermore, the steepness of the voltage dependence of gating is not modulated by [Zn2+] (Fig. 1B).
Fig. 1.
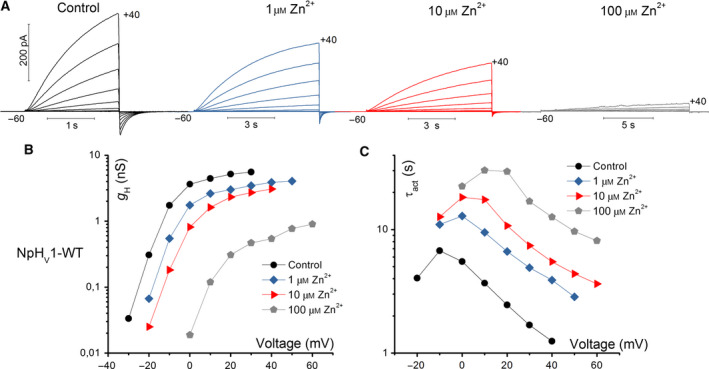
WT NpHV1 voltage‐gated proton channel is inhibited by zinc. (A) Whole‐cell voltage‐clamp current measurement in the same cell at three zinc concentrations pHo 7.0//pHi 6.5. Pulses were applied in 10 mV increments up to the voltage shown up to +40 mV. The holding potential was −60 mV and the first pulse at −50 mV. (B) Conductance determined by single exponential fits of the activation kinetics (C). Activation kinetics at indicated [Zn2+].
pH dependence of Zn2+ inhibition
The inhibition of rat HV1 by zinc is dependent on the external pH. Therefore, we recorded zinc inhibition of NpHV1 at pHo ranging from 5 to 8. Figure 2 shows typical measurements for the different conditions. Zinc was applied as 1, 10, 100, and 1000 μm. Zinc‐induced channel inhibition is most potent at pHo 8. While at pHo 5, NpHV1 is insensitive to zinc inhibition up to 1 mm. Zinc inhibition of the channel at pHo 6 was less pronounced than at pHo 7. This can be seen in Fig. 2 by comparing the g H‐V shift and the slowing of τact at pHo 6 and pHo 7. The ordinate shows the g H‐V shift between zinc‐inhibited and control conductance (Fig. 2B) or the quotient between τact in zinc and control τact (Fig. 2C). Compared to the g H‐V shifts in rat HV1 (RnHV1) [60], the g H‐V shift of NpHV1 at pHo = 6 is almost negligible. At 1 mm, Zn2+ NpHV1 shifts about 12 mV, while the rat HV1 is shifted over 40 mV. Activation kinetics was slowed by Zn2+. 100 μm zinc slowed NpHV1 twofold at pHo 6. The rat HV1 was slowed already twofold at 10 μm Zn2+, indicating at least a tenfold difference between the slowing of rat and insect channel. One caveat in this study is that zinc affects the channel less than rat or human channel. Therefore, we applied analysis of initial and last control to differentiate the inhibition by low zinc concentration from small changes of the patch, for example, by improved access (in Material and methods).
Fig. 2.
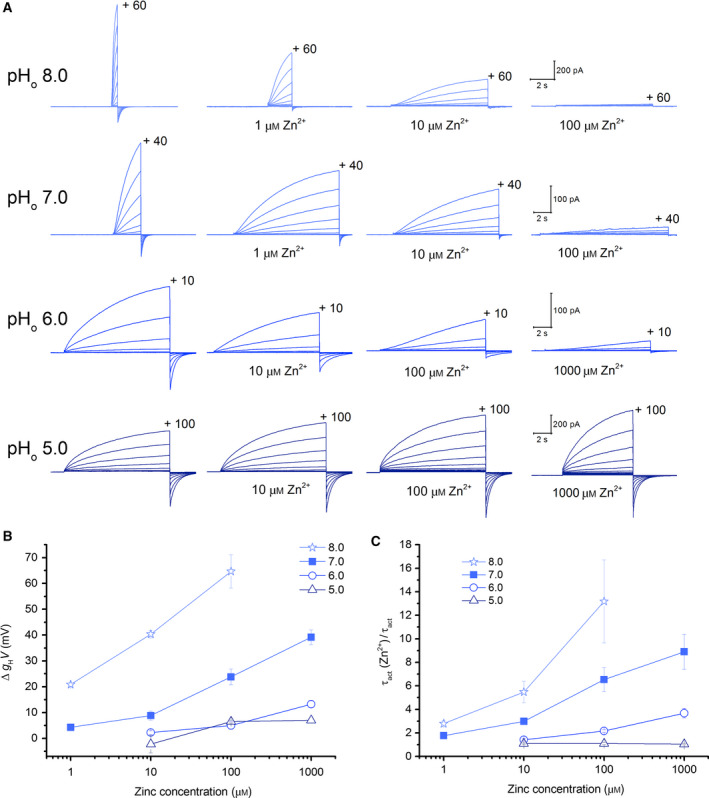
Zinc inhibition of NpHV1 WT in pHo 5.0, pHo 6.0, pHo 7.0, and pHo 8.0. (A) Comparison of the zinc inhibition at four different pHo measured in the absence (left‐most family) and presence of Zn2+, as indicated. The data in each row are from the same cell, and the calibration bars apply to each row. The internal pH was 7.5 for pHo 8.0, 6.5 for pHo 7.0, and pHi 5.5 for pHo 6.0 and pHo 5.0. The cell at pHo 7 was held at −60 mV, and pulses applied in 10 mV increments from −50 to +40 mV. This is the same cell shown in Fig. 1. The cell at pHo 8 was held at −40 mV, and pulses applied in 10 mV increments. The cell at pHo 6.0 was held at −60 mV, and pulses applied in 10 mV increments from −50 to +10 mV. The cell at pHo 5.0 was held at −20 mV, and pulses applied in 10 mV increments from −10 to +100 mV. (B) Effects of [Zn2+] on the g H‐V rightward shifts analyzed with control measurements at 10% of the g H,max. The data are displayed as mean ± SEM. (C) The slowing of the activation kinetics due to [Zn2+] compared to control is shown. Plotted is the mean ± SEM. Slowing by [Zn2+] decreases drastically at lower pHo. τact was determined as the average of the same three consecutive voltage steps of the τact–voltage curve for all [Zn2+]. Number of the cells studied in B and C pHo 8.0 n = 5–9, pHo 7.0 n = 4–8, pHo 6.0 n = 4–8, and pHo 5.0 n = 2–4. The current families at pHo 7.0 are the same as in Fig. 1.
Overall, it can be deduced that NpHV1 is much less zinc sensitive than the RnHV1. Comparable to RnHV1, however, the effects of Zn2+ in NpHV1 were competitively reduced by protons.
Gain and loss of function due to histidine substitutions at position 92 and 145
In mammalian cells [2, 60, 62], the inhibiting effect of zinc was attributed to two histidines at the external part of the HV1 channel. Our investigation showed that in NpHV1 zinc inhibition is titratable by external protons (Fig. 2). However, zinc inhibition of NpHV1 is less pronounced than zinc effects in the previously mentioned rat or human HV1. We aligned the human, rat, and insect channels to compare the differences in primary structure (Fig. 3). In contrast to the mammalian channels, the insect channel lacks the histidine in the S3‐S4 loop. An aspartate can be found instead at the very same position. An exchange from histidine to an acidic residue is also shared by the Ciona intestinalis HV1, which expresses a glutamate at the respective position (E241 in CiHV1). The striking insensitivity of NpHV1 to [Zn2+] at pHo = 5 (Fig. 2) lets us to speculate about the function of D145 at lower pHo. One might have expected that the divalent zinc might be very well attracted by an acidic residue. Thus, the low pK a of aspartate (pK a = 3.65) should allow zinc coordination even at pHo below 5. However, our results do not support the hypothesis. We decided to substitute the aspartate 145 with a histidine to reproduce the configuration in the S3‐S4 extracellular loop of the mammalian HV1. Figure 4 shows a typical measurement with the D145H mutant. Both the slowing of the activation time constant and the conductance–voltage shift were enhanced profoundly. Figure 4B summarizes the effects of zinc on the g H‐V shift. In comparison with NpHV1 WT, the mutant is shifted significantly more at 1 μm Zn2+ and at all higher Zn2+ concentrations. In comparison with hHV1, in D145H, the g H‐V shift in response to zinc appears overall somewhat smaller. Figure 4C shows the τact(Zn2+)/τact ratio increased at all Zn2+ concentrations. Our results are in contrast to the results of Qiu et al. [65] who report no difference in zinc affinity by introducing a histidine for the glutamate at position 241 in CiHV1.
Fig. 4.
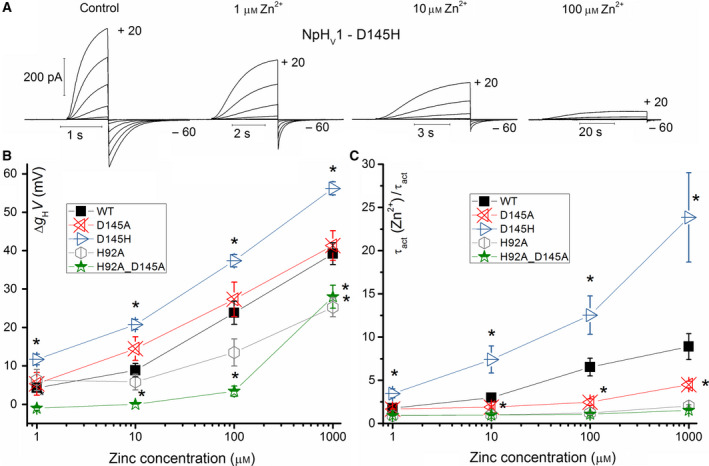
Substitution of the aspartate at position 145 with histidine strongly increases zinc inhibition. (A) Whole‐cell measurement of the D145H mutant at pHo 7 with increasing [Zn2+]. Pulses were applied in 10 mV increments up to +20 mV. The holding potential was −60 mV. The raw data show the immense slowing of the channel due to zinc (note the changing calibration bars). (B) Shift of the conductance–voltage curve in all recorded mutants due to increasing [Zn2+]. The conductance was determined by single exponential fit of the activation kinetic. Data are depicted as mean ± SEM. (C) Slowing of τact displayed as a ratio τact (Zn2+)/ τact corrected for the g H‐V shift. Data are depicted as mean ± SEM. Number of cells analyzed in B and C, WT n = 3–8, D145A n = 3–6, D145H n = 3–8, H92A n = 3–6, and H92A_D145A n = 3–8.
The pronounced effect of introducing a histidine at position 145 led us to test the substitution of the aspartate by an alanine. In the D145A mutant, we replaced a titratable residue with a nonpolar residue. We reasoned that alanine would not be expected to coordinate Zn2+, and thereby, we can discern the contribution of the aspartate to Zn2+ inhibition in NpHV1. Figure S3B shows that the g H‐V shift of D145A is comparable to WT. At concentrations from 1 to 100 μm Zn2+, in the D145A construct, the g H‐V shift is slightly stronger than WT; however, Student’s t test did not reveal a statistical difference between WT and D145A. To our surprise, these data provide no evidence of zinc coordination ability to D145. Figure S3C depicts τact(Zn2+)/τact in D145A. Hereafter, the correction for the g H‐V shift the activation kinetics of D145A is less slowed by Zn2+ than WT NpHV1. Since the most obvious zinc effect on NpHV1 is the slowing of the τact, these data support a contribution of the aspartate to zinc coordination. However, if we analyze without correction of the g H‐V shift, zinc affected WT and D145A almost identical (Fig. S2). We showed a typical D145A measurement in Fig. S3. We recorded during the 2‐h measurement controls at two different time points. Control 2 shows the progression of the patch independent of zinc. Initial analysis reveals no clear difference in zinc inhibition of the WT recording in Fig. 1 and D145A (Fig. S3).
We decided to investigate the other histidine attributable to coordinate zinc binding in NpHV1. In the S1‐S2 loop, there are three histidines, His81, His89, and His92 (Fig. 3). The human proton channel and the rat channel contain exclusively one histidine, at position 140 (human) and 154 (rat). His92 in NpHV1 aligns with the His140 in the human channel. We substituted His92 with an alanine, confirming that it contributes to Zn2+ binding. At 10 µm and higher zinc concentrations, the g H‐V of H92A shifted significantly (P < 0.05) less than WT. Furthermore, the slowing of τact was almost completely abolished. That the remaining Zn2+ effects are so small suggests that the aspartate at position 145 contributes on its own to a very small extent to zinc inhibition in NpHV1. This finding corroborates the conclusion from the D145A mutant. Moreover, this is the only mutant where the effects on slowing by zinc are less pronounced than the effects on the g H‐V shift in comparison with WT. Speculatively, the zinc coordination at the S3‐S4 loop might be more involved in slowing or overall dominating the effects of zinc inhibition. Although there are still two other histidines in the S1‐S2 loop of H92A NpHV1, our data suggest that the entire effect on τact in NpHV1 is controlled by histidine in S2, His92. The other two histidines at positions 81 and 89 might participate in zinc inhibition but were not analyzed in this study. We decided to investigate the double alanine mutant H92A_D145A to further elucidate the contributions of D145 and H92. Both alanine mutants H92A_D145A and H92A showed no slowing of the activation kinetics due to zinc. The H92A_D145A had a g H‐V shift less than all other mutants. The channel is literally unaffected by zinc in terms of activation time constants and g H‐V shift.
Architecture of NpHV1
The initial report on the insect proton channel NpHV1 did not resolve its tertiary structure [5]. We applied bioinformatics to predict whether NpHV1 assembles as a monomer or as a multimer. However, it was unclear whether NpHV1 has sufficient coiled‐coil motif in the C terminus (responsible for dimerization) to conclude. We took two approaches to decipher the oligomerization.
First, we used a biochemical approach to evaluate the oligomerization of NpHV1 by high‐resolution clear native gel electrophoresis (hrCNE) [71] and SDS/PAGE under reducing and nonreducing conditions. NpHV1‐GFP protein was heterologously expressed in tsA201 cells, and whole‐cell lysates were prepared. This construct was used in both the biochemical and electrophysiological experiments. GFP‐tagged NpHV1 was visualized either by fluorescence scanning of a gel or after western blot analysis. A mutation (A206K) was introduced into GFP to prevent GFP dimerization [68], and a C‐terminal extension of NpHV1‐GFP with a deca‐His Tag or StrepTagII was used to demonstrate full‐length protein expression by western blotting.
SDS/PAGE analysis of the NpHV1‐GFP proteins showed a protein band with an apparent MW of 45 kDa, well below the calculated MW of 56 kDa of NpHV1‐GFP. This finding might be due to either the aberrant running behavior of the proteins or non‐full‐length expression (Fig. 5A). In the absence of β‐mercaptoethanol, a second band with higher molecular weight appeared presumably representing NpHV1 dimers. The appearance of the high molecular weight protein band might signify redox‐dependent effects, for example, cysteine disulfide bridges holding the dimer together. High‐resolution CNE analysis of the same samples displayed both monomeric and dimeric NpHV1‐GFP proteins (Fig. 5B). Since this method omits SDS and β‐mercaptoethanol to retain the native confirmation of the protein, these results suggest a cysteine‐supported dimerization of NpHV1‐GFP (cysteine 197 and 201). Comparable results were reported for the mouse voltage‐gated proton channel [75]. We used western blot analysis to verify full‐length protein expression of NpHV1‐GFP proteins and demonstrate aberrant running behavior (Fig. 5C). Samples were heated for 3 min at 95 °C (Δ) and resolved in SDS gels along with nonheated protein samples. The heating of the protein abolishes folding dependent running behavior. Proteins were either labeled for the N terminally located GFP with specific anti‐GFP antibodies or against the extended C terminus of the proteins with anti‐His or anti‐StrepTag antibodies. After heating, the apparent MW of NpHV1‐GFP protein confirms its calculated MW (56 kDa). Additional bands detected by anti‐GFP antibodies eventually represent either proteolytic fragments or nonmaturated proteins below level for fluorescence scanning (Fig. 5A,C).
Fig. 5.
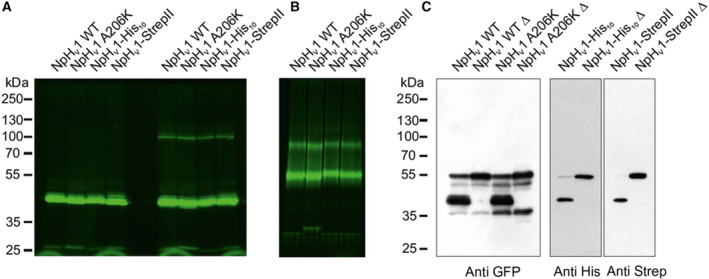
Biochemical analysis of NpHV1 architecture. (A) SDS/PAGE analysis of NpHV1‐GFP heterologously expressed in HEK 293T (tsA 201) cells. Protein samples were separated on a 10% SDS gel either in the presence (left) or in the absence (right) of β‐mercaptoethanol. In the absence of β‐mercaptoethanol, a second band of higher molecular weight appears presumably representing NpHV1 multimers (n = 9). (B) hrCNE analysis of the same protein constructs displaying both monomeric and dimeric NpHV1‐GFP. GFP‐tagged proteins were visualized by fluorescence scanning of the gels. C‐terminal extension of NpHV1 GFP with a deca‐His Tag or StrepTagII was used to demonstrate full‐length protein expression (n = 6). (C) Western blot analysis of heated (Δ) or nonheated protein samples (3 min at 95 °C) (n = 1). Without heating, there is a discrepancy in the calculated MW (56 kDa) and the apparent MW (45 kDa). After heating, the apparent MW confirms the calculated MW. The MW standard of A and C does not apply for B.
Secondly, a different approach to assessing monomer vs. dimer was to use limiting slope analysis to estimate the maximal gating charge transferred, before the first ionic current appears [76, 77]. The gating charge of the monomer has been described as being around e 0 = 2–3 [78, 79, 80] and of the dimer around e 0 = 4–6 [52, 53, 78, 79, 80, 81]. We applied voltage steps as small as 2 mV close to the threshold to resolve the g H‐V (Fig. 6). We analyzed with ten cells, six WT and four NpHV1 mutants with zinc concentrations from 1 to 100 μm. We measured a gating charge based on the limiting slope of the g H‐V relationship with e 0 = 4.7–6.1. Thus, NpHV1 might be a dimer, which is also suggested by the high‐resolution native gel experiments. Figure 6A shows a typical measurement of NpHV1’s limiting slope.
Fig. 6.

Limiting slope analysis and instantaneous currents of NpHV1. (A) Measurement of the limiting slope based on voltage steps near the threshold of 2 mV. Current families of pulse length from 2 to 30 s are plotted to show the full conductance–voltage curve. A linear fitting was applied to the steepest part of the conductance–voltage curve. This cell’s calculated gating charge was around 4.8 e 0. (B) Instantaneous current–voltage relationship of NpHV1 WT with Zn2+ concentrations ranging from 0 to 100 μm. While the traces with zinc 1–100 μm overlap, the currents for control conditions diverge mostly at higher voltages.
In our analysis, we observed similar gating charges independently of mutation and zinc concentration, showing that there is no effect of zinc on the amount of gating charge moved. Moreover, zinc slows channel opening, but does not abolish gating per se. The assumption from Cherny and DeCoursey [60], that zinc binds to RnHV1 and keeps it at the closed state, seems to apply also for NpHV1. We can furthermore deduce from the slope of the voltage dependence of gating that with or without zinc the limiting slope remains unchanged.
Figure 6B displays instantaneous current–voltage curves. Instantaneous currents were used to identify voltage‐dependent block of the ion channel pore [82, 83]. Our data do not suggest any voltage‐dependent block by zinc. The instantaneous current measurements imply that zinc’s primary action is to prevent the opening of the channel. This can be deducted from the very reasonable overlap of the scaled instantaneous currents traces at different zinc concentrations.
Modeling the effect of zinc and cadmium on NpHV1 WT currents
To elucidate in more detail the effects of zinc on NpHV1, we created a kinetic model. For that, we chose a simple kinetic model that would fit reasonably the currents at threshold and above threshold. The raw data currents at threshold and above showed a clear sigmoidal shape. However, voltage pulses at higher depolarizations do shorten the delay of the resulting currents and reduce to an exponential current shape. Thus, a two‐state kinetic model at threshold of activation with α (rate of channel opening), being identical in both steps and β (rate of channel closing) identical in both steps, resulted in a too pronounced delay. A one‐state kinetic model shows no delay at all and is discarded. Fujiwara et al. [84] determined in a kinetic analysis the power of WT mouse HV1 with n = 1.7. We found that n = 1.5 would describe the currents reasonably for NpHV1. Figure 7 shows modeled NpHV1 currents according to the rate constant equations (Appendix S1). To generate current families similar to the currents recorded under 1, 10, and 100 μm Zn2+, we aimed for minimal change in the rate constant equations. As the most obvious effect of Zn2+ on proton currents is a strong increase in the activation time constant, we focused on decreasing the rate of channel opening. Zinc inhibition could be mimicked with a simple reduction of α. However, at 100 μm zinc a slight reduction of β fitted the currents better. The conductance–voltage plot was generated from the rate constant equation and then scaled to the conductance values determined by the patch‐clamp measurements at the different metal concentrations. Interestingly, the steepness of the conductance to voltage relationship appeared too shallow in comparison with the patch‐clamp measurements. However, if the power was changed to n = 2.1 the fit of conductance was much better. The discrepancy could also be seen by Thomas et al. [85] and the fitting of single kinetic HH model. The time constant of activation seemed to be in a good agreement with the patch‐clamp data. Overall, they are slightly faster. This is intrinsic to the model, where the activation time constant is dependent on the power. We determined the time constant by a simple exponential fit and did not take into account the delay.
Fig. 7.
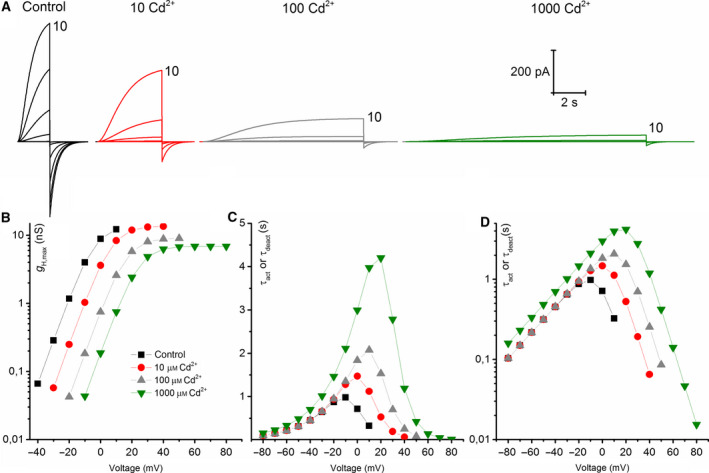
Model of zinc inhibition based on Fig. 1. (A) Modeled current families with pulses from −60 to +40 mV in 10 mV increments. The left‐most family was compiled using a kinetic model with rate constants determined from the control family in Fig. 1. Currents close to threshold and above were best fitted to the power of 1.5. The other three families were then generated by mainly changing the rate of channel opening. Except in the last family also the rate constant of closing was decreased twice. (B) Conductance–voltage curves showing the effects of changing rate constant of opening by scaling to the g H values of Fig. 1. (C) Activation kinetics is given by the model in the logarithmic scale. (D) Activation kinetics is given by the model in a linear scale.
Cadmium is another transition metal that has been widely used to inhibit proton currents. Its inhibiting effect on proton currents is weaker than that of zinc [60]. Cadmium inhibition in detail was recorded in rat alveolar epithelial cells. We recorded the effect of cadmium on NpHV1. Figure 8 shows a typical recording. Cadmium was also less inhibiting in NpHV1 than zinc. Furthermore, 1 μm of Cd2+ did not show a pronounced effect on the currents. However, 10–1000 μm Cd2+ inhibited the currents noticeably. Higher concentrations of Cd2+ show both a shift in the conductance–voltage relationship (Fig. 8C,D) and a substantial slowing of the activation kinetics (Fig. 8B,E). Our initial impression was that zinc appeared around ten times more potent than cadmium. We created a model (Fig. 9) from the measurements in Fig. 8. Since we had the discrepancy between conductance–voltage relationship steepness and the current shape, we generated the rate constant equations by reproducing the patch‐clamp control measurement and primarily fitted the conductance–voltage curve. If the main goal is to match conductance–voltage curves, then we had to make the activation time constant steeper than the deactivation time constant. This is not seen in Fig. 8 in the patch‐clamp data where activation time constant is less steep than deactivation time constant. The power of the kinetic equation was n = 2. However, again a decrease in α was adequate to reflect all changes induced by cadmium except for 1 mm cadmium where we slightly decreased β too. As with the zinc inhibition model, we left all other parameters unchanged and constructed the model exclusively from the rate constant equations. Our calculations suggest the same mechanism applying for the kinetic model for zinc and cadmium. We compared the effects of 100 μm of Cd2+ and Zn2+ on NpHV1 in the same cell. Figure 10 shows the measurement. Remarkably, Cd2+ and Zn2+ have an almost identical effect on the g H‐V shift (Fig. 10b), while in the slowing of the activation kinetics they are markedly different (Fig. 10c).
Fig. 8.
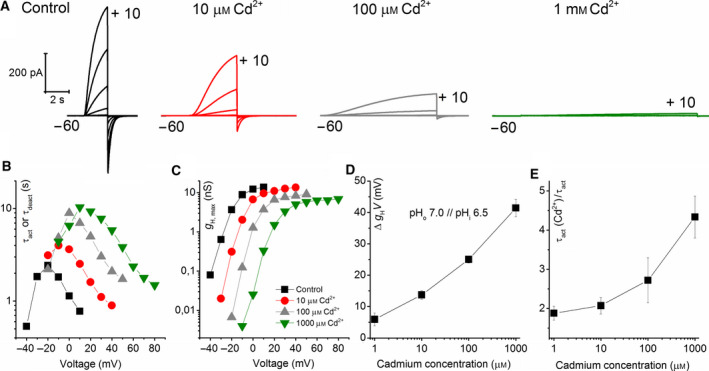
Cadmium inhibits NpHV1 WT channel. (A) Current families with pulses from −60 to +10 mV and a 10 mV increment. Measurements were conducted in pHo = 7.0 pHi = 6.5. Cadmium concentration is indicated. (B) Decreasing of activation kinetics by four concentrations of Cd2+. (C) Proton conductance at increasing Cd2+ concentration. (D) Shift of g H relative to control conductance n = 3–8. (E) Activation kinetic slowed and corrected for g H‐V shift in comparison with control n = 3–8. All error bars are SEM Legend in C applies to C and B.
Fig. 9.
Model of cadmium inhibition based on Fig. 8. (A) Control model family was compiled using α and β rate constants determined from the control family of Fig. 8. At 1 mm, Cd2+ β was decreased additional to α. (B) Conductance–voltage plot, g H scaled to the values from Fig. 8 for each Cd2+ concentration. (C) Activation kinetics–voltage graph including the deactivation kinetics given by the model. (D) Activation kinetics vs. voltage depicted on a half logarithmic plot.
Fig. 10.
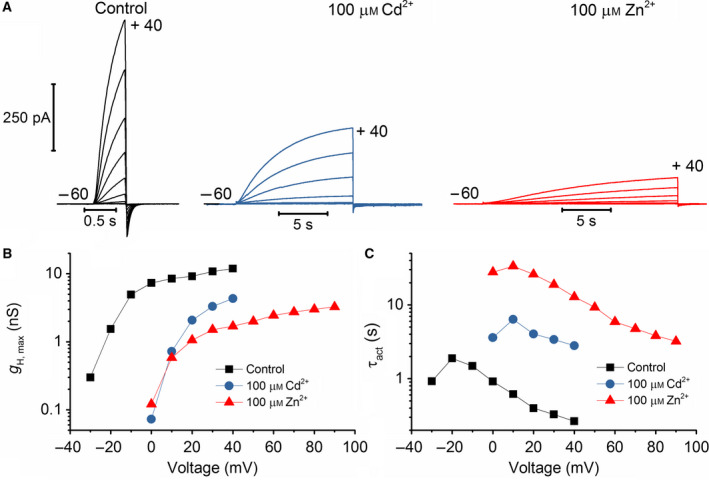
Direct comparison of 100 μm Cd2+ and 100 μm Zn2+ effects on NpHV1 WT. (A) Comparison of Zn2+ inhibition and Cd2+ inhibition of NpHV1 at identical metal concentrations, in the same cell. Voltage pulses are form −60 to +40 mV in 10 mV increments, pHo 7.0, pHi 6.5. (B) Conductance–voltage plot shows both metals shift the conductance identically to the right. (C) Activation kinetics is slowed less by Cd2+ than by Zn2+.
Discussion
Zinc sensitivity of NpHV1
The experiments show that NpHV1 is less sensitive to zinc inhibition than mammalian channels. However, NpHV1 is still inhibited by zinc. The main effects of Zn2+ are slowing of activation, a positive shift of the g H‐V relationship, and a reduction of g H,max. The slowing of the activation time constant is a reliable parameter of our measurements. The shifts in g H‐V curve are very small and therefore hard to interpret except at high [Zn2+]. Similarly, although it appears that g H,max was reduced, this effect was noticeable at high [Zn2+]. It is clear that the g H‐V shift in NpHV1 is not as pronounced as in hHV1 [62] or RnHV1 [60]. We can exclude that the species difference is a stoichiometric effect. Both rat and human HV1 are dimers. Our analysis in high‐resolution native gel electrophoresis and the limiting slope results showed that NpHV1 is most likely a dimer too.
Similarities between NpHV1 and CiHV1
An alignment of the CiHV1 and NpHV1 sequences (Fig. 3) shows a surprising similarity between the two channels concerning the histidines accessible from the outside. Both channels have a histidine near the top (outer end) of the S2 helix, and both have additional histidines in the S1‐S2 loop. When histidine is substituted by alanine at the first position H92 in NpHV1 and H188 in CiHV1, in both cases zinc sensitivity is almost completely lost [65]. Thus, it seems that the position at which the histidine must be located is well defined. However, in EhHV1, which contains ten histidines in the S1‐S2 region, mutation of the two histidines H197 and H203 individually to alanine abolishes zinc sensitivity [4]. In our hands, in NpHV1 the single mutation H92A is sufficient to eliminate most inhibition by zinc. This seems to be the case for H188A mutant in CiHV1 too.
The second similarity between NpHV1 and CiHV1 is that neither expresses a histidine accessible from the outside in the S3‐S4 linker, the location of the second His that is critical for Zn2+ sensitivity in mammalian HV1. We show in this study that introducing a histidine into the S3‐S4 linker increased zinc sensitivity drastically so that the mutant generally recapitulates the zinc sensitivity of mammalian HV1 channels. Qiu et al. [65]. tried the analogous mutation in CiHV1 but were unable to detect more pronounced zinc inhibition. In contrast, we record significant differences in both τ act slowing and the g H‐V shift. The result suggests that the histidine in S3‐S4 plays a key role in zinc inhibition in mammals.
Effects of D145
The crystal structure of the mouse chimera mHV1cc contained a zinc atom apparently coordinated between two His and Glu115 and Asp119, both located in S1 [63] (Table 1). Simultaneous mutation of Glu115 and Asp119 detectably reduced zinc inhibition of the chimera, suggesting that in addition to the histidines, these two acid residues contribute to zinc coordination [63]. De La Rosa et al. [66] mutated a glutamate E119 in S1 seven amino acids away from the selectivity filter of hHV1. They found that E119H drastically increased zinc affinity of hHV1. The additional substitution H140A barely affected zinc affinity, and H193A decreased the zinc affinity to WT level. However, E119H with H140A and H193A substitutions shows WT like zinc affinity. Three more substitutions D123H, D130H, and D185H did not show increase in zinc sensitivity. They concluded that E119 is an essential amino acid for zinc coordination. Qiu et al. [65] detected three acidic residues in CiHV1 that contribute to zinc binding: E167, D160, and D233. E167 is located at exactly the same position as E115 in mHV1cc. In contrast, D233 is in S3 in CiHV1 and not in S1. Coincidentally, we found an acidic residue in NpHV1 exactly at the position of the histidine responsible for zinc inhibition in the hHV1 channel and MmHV1. The zinc inhibition of NpHV1 at pHo 7 is weaker than of mammalian HV1. Our screen of the pH dependence of the zinc inhibition does not suggest that the acidic residue (aspartate) will increase zinc inhibition at low pHo in NpHV1 compared to the mammalian HV1. D145 is at the same position as E243 in CiHV1, H193 in hHV1, and H189 in MmHV1. Others have shown directly or indirectly that this position is accessible from the outside [2, 3, 60, 86, 87, 88, 89]. Therefore, it is unlikely that the pK a is changed massively because of the amino acid being embedded in lipid. Our results show that an acidic residue at this position makes an ambiguous contribution to zinc binding. Even at pHo lower than the pK a of histidine but above the pK a of aspartate, we are unable to detect a pronounced zinc effect. Substitution to alanine does indicate minor involvement of D145 in the slowing of τact, but little effect on the g H‐V relationship shift.
Table 1.
Numerical key of residues connected to zinc coordination in five different species. The table shows six positions to which zinc coordination has been attributed in five species. The highlighted residues have been shown by mutation to contribute to Zn2+ sensitivity. Yellow highlighted, zinc‐sensitive residue suggested by Qui et al. Green, acidic residues. Red, residues in S3 contributing to zinc sensitivity. Gray, E119 suggested by De La Rosa et al. Turquoise, histidines connected with zinc coordination, conserved throughout the species.
| Species | Residue‐Transmembrane domain | Reference | |||||
|---|---|---|---|---|---|---|---|
| hHV1 | D112‐S1 | E119‐S1 | D123‐S1 | H140‐S2 | D185‐S3 | H193‐S3 | [2, 62, 66] |
| mHV1cc | D108‐S1 | E115‐S1 | D119‐S1 | H136‐S2 | D181‐S3 | H189‐S3 | [63] |
| CiHV1 | D160‐S1 | E167‐S1 | D171‐S1 | H188‐S2 | D233‐S3 | E243‐S3 | [65] |
| NpHV1 | D66‐S1 | E73‐S1 | D77‐S1 | H92‐S2 | D137‐S3 | D145‐S3 | This paper |
| MmHV1/VSOP | D108‐S1 | E115‐S1 | D119‐S1 | H136‐S2 | D181‐S3 | H189‐S3 | [6] |
Limiting slope analysis
This is the first gating charge analysis of NpHV1. Our results indicate that 4.7–6.1 elementary charges (e 0) are the lower limit of the gating charge transferred in the WT channel. Because it has been proposed that Zn2+ binding prevents channel opening [60], we also tested gating charge in the mutants D145A and H92A in various zinc concentrations and could not detect any difference from WT. The gating charge is constant under various pH conditions. As it can be seen in Fig. 1B, the steepest slope between the measurements in the g H‐V diagram of NpHV1 appears identical. Thus, one could postulate that the mechanism how NpHV1 gates is not affected by zinc. Gating is dependent on zinc binding. The channel is unable to open as long as zinc is bound. Once zinc leaves the channel gating is not hindered in any way. Based on previous studies, we might deduce whether NpHV1 is a dimer or monomer from its gating charge. Previous gating charge measurements of voltage‐gated proton channels were around 6 e 0. This and the measurement of the gating charges for monomers defined as 3 e 0 might allow us to suggest that NpHV1 is a dimer. A multimeric structure most probably a dimer is the result of our high‐resolution native gels analysis. In respect of the gathered data, NpHV1 is a multimeric channel with weak zinc sensitivity. However, if we introduce a histidine at position 145, zinc sensitivity is augmented.
Comparison with previous models
The general hypothesis is that weaker Zn2+ effects at lower pHo can be explained by the channel having two or three sites that coordinate Zn2+ that can be protonated in competition with a single Zn2+ [60]. Since there are two histidines in hHV1 and three in RnHV1 accessible from the outside this estimation, seven years before the gene was identified appears very accurate. From the model of Cherny and DeCoursey [60], simple competition of one proton for a single zinc ion at the binding site would show a smaller decrease in apparent Zn2+ potency than the competition with two or three protons. The shift of the Zn2+ sensitivity of both g H‐V curves and the τact(Zn2+)/τact of NpHV1 is around 102 between pHo 7 and pHo 6. The shift of the Zn2+ sensitivity of the g H‐V curves is around 102 between pHo 8 and pHo 7. At pHo 5, [Zn2+] up to 1 mm affects neither slowing nor g H‐V shift. In NpHV1, there are three histidines in the S1‐S2 loop, but there is no histidine in the S3‐S4 loop. However, since the mutation of H92 abolishes almost all zinc inhibition, we consider H92 as the most important and therefore single histidine in S2 responsible for zinc inhibition. Having exclusively one histidine a model for simple competition 1 proton for 1 zinc ion would apply. The simple model would predict the shifts according to the applied pHo of at most 101. We are recording already a 102 shift between pHo 6, pHo 7, and pHo 8. One answer to this riddle may be that zinc is coordinated between two histidines in the dimer instead of a zinc ion coordinated with one histidine in the monomer. The almost complete zinc insensitivity of NpHV1 at pHo 5 is increasing the shift further. This is consistent with multiple protonation sites.
Hoch et al. [90] report that histidines control the binding selectivity of Zn2+ over Cd2+ in ZnT transporters, while two histidines combined with two acidic residues create a barrier for cadmium binding. The affinities for zinc and cadmium binding are more similar for the one histidine and three acidic residues site. In the case of NpHV1 WT, we measured the difference between zinc and cadmium inhibition. The g H‐V shift seems to be almost identical, while the activation kinetics is more increased due to zinc binding compared to cadmium binding, at equal concentrations (Fig. 10). Thomas et al. [85] showed that cadmium and zinc effects are comparable between NpHV1 and the snail proton channel HtHV1. In conclusion, Hoch et al. report no difference on ZnT transport if the zinc binding pocket has two or just one histidine. In ZnT, the overall transport of cadmium is less if a second histidine is introduced. The maximal transport rate (V max) of ZnT is increased drastically (> 5.5) for cadmium transport by the second introduced histidine, while the affinity is reduced considerably (33‐fold). Here, one should remember that affinity for a ligand and activity of a protein is not necessarily the same.
Ohana et al. [91] worked with the same ZnT as Hoch et al. Interestingly, eliminating an essential aspartate in the binding pocket of the zinc transporter abolished overall zinc transport. The D145A mutant of NpHV1 has a small effect on zinc inhibition. One tentative conclusion may be that NpHV1 has two binding sites for zinc, one positioned around H92 the other around D145. Furthermore, for a bacterial zinc transporter YiiP it is suggested that the binding of zinc is located in the dimer interface [92]. However, all the comparison is done between two different proteins, one that transports zinc and functions if zinc is bound (ZnT), and one that translocates protons and is inhibited by zinc binding (HV1).
Metal binding effects on ion channels have been described by Elinder and Århem [93] in detail. They suggest four basic mechanisms of metal ion action: screening, electrostatic effects/binding, nonelectrostatic effects/binding, and pore block. Pore block is voltage‐dependent and can be described as an additional gate of the channel. We have excluded the voltage‐dependent block via instantaneous currents and the analysis of the voltage dependence of gating. To differentiate between the other three mechanisms, g H‐V shift and closing and opening kinetics are used. Activation time constants are clearly increased due to zinc inhibition of NpHV1. The mechanism called ‘nonelectrostatic effects/binding’ involves binding of the metal to the channel’s surface allosterically. It is measurable as an increase in the activation kinetics of the currents, but deactivation kinetics may be unchanged or even slowed (not shifted by voltage). NpHV1 exhibits closing kinetics with small voltage shift while opening kinetics shift profoundly, and the result favors ‘Nonelectrostatic effects/binding’ and is declining screening as a mechanism [94]. State‐dependent binding is one clue of the nonelectrostatic effects. Zinc as an atom has special properties and is described as exclusively binding the closed state of a voltage‐gated ion channel [82]. Screening might be seen in double‐mutation D145A H92A, which exhibits a tiny effect by zinc to the g H‐V shift and no detectable slowing up to 100 µm Zn2+. Introducing the substitution D145H drastically increases activation kinetics and pronounces the conductance–voltage shift. Since D145H is close to the arginines in the S4, its effect might be more electrostatic (increased g H‐V shift), than stabilizing the closed state of the channel even further, suggesting different actions of H92 and D145 on zinc inhibition. However, we could not quantify conclusively if one effect dominates. A second hypothesis is that the D145H mutation may provide an additional strong binding site for zinc with pK a or pK M different from the first (H92) binding site. Two strong binding sites would couple the monomers tighter together in the dimer. D145A mutant shifts g H‐V comparable to NpHV1 WT. However, τact(Zn2+)/τact values are less slowed than NpHV1 WT, indicating that there is an improved influence on the voltage sensor and probably less stabilizing of the closed state. Structurally, this conclusion is hard to integrate whether exclusively the arginines are responsible for the voltage‐sensing.
In Musset et al. [62], a difference between zinc inhibition in the monomer compared with the dimer could be seen by shifting the τact(Zn2+)/τact for the g H‐V shift. As a result, it was obvious that if the channel is monomerized by truncation of both C terminus and N terminus (in mouse) or just C terminus (in human), its slowing can be compensated by adjusting for the g H‐V shift. The effect of slowing is very much diminished to the extent that in mouse there was no additional slowing after correction for the g H‐V shift. In this work, we did this shift by default. Still, NpHV1 WT slows considerably after correction. The slowing is even enhanced after correction in the D145H mutant. We might suspect that the channel is a dimer for this reason, and maybe, it is further hint that zinc is coordinated in between the dimer, not in each monomer. Our NpHV1 cadmium inhibition recordings show one more interesting thing. Cadmium and zinc are equally affecting g H‐V shift, but the activation kinetics are markedly different. However, if we correct for g H‐V shift, then cadmium still affects the activation kinetics stronger than effects on the kinetics based on a pure g H‐V shift. We hypothesize that cadmium and/or zinc bind in between the monomers and increase the rigidity of the system. The metals couple both subunits to each other and therefore hinder the opening of the channel. The stronger coupling is expressed as slowing of the activation time constant. Cadmium creates a less effective tie than zinc.
Two recent studies suggest two binding models. Qiu et al. [65] published two distinct binding sites for zinc. Site 1 prevents the channel from opening, and no permeation pathway for protons is opened, whereas site 2 is accessible in the closed state and prevents movement of the voltage‐sensing domain S4. In both sites, D233, a residue in S3; H188, a residue in S2 (same position as H92 in NpHV1); and D167, a residue in S1 (same position as E119 in hHV1), play key roles. De La Rosa et al.[66] found a substitution E119H in S1 sufficient to reproduce all zinc effects in hHV1. E119H makes H140 and H193 obsolete. However, H193 together with E119H increases zinc sensitivity above hHV1 WT. Our data show that histidines in S2 and S3 are essential for zinc inhibition. Zinc inhibition is abolished by the replacement of these residues by alanine in NpHV1, as it has been shown in hHV1. We have not tested the comparable residue to E119H in NpHV1. However, a full histidine scan was never focused on this study.
De La Rosa et al. [66] reported that an interruption of the hydrogen bond network by substitution of E153A (residue at the cytosolic end of S2) reduces drastically zinc inhibition. This amino acid is exclusively accessible from the cytosol. Therefore, a direct interaction with zinc ions from the external milieu is impossible. However, E153 (E105 in NpHV1) stabilizes the closed state of the channel. Removal of the charge at this position allows the channel to open more readily. We performed a series of zinc inhibition measurements of E105A NpHV1 (Fig. S4). The gH‐V shift of E105A compared with WT and with our most sensitive mutant D145H (Fig. S4B) showed that zinc affects the conductance more in E105A than in any other channel tested in our study. We could not record the same effect of zinc that was seen in E153A hHV1.
Comparison with human and rat, further isoforms
The data from western blot analysis with the GFP antibody show many labeled bands. Interestingly, it seems as if a smaller fraction of the labeled protein is always below the more pronounced band. This result might be interpreted as a shorter isoform of NpHV1, also seen for the human channel [34]. Another explanation would be protein fractions that are degraded but are still connected to the GFP at the N terminus. To our surprise, we could not detect multiple bands screening for the C‐terminal tags. Here, the explanation of having not fully formed channels or degraded channels might be valid. However, the signal of the smaller MW bands was always less pronounced than the signal of the main bands. An interpretation might be that the affinity of the other tag antibodies was not as efficient as that of the GFP antibody. Since our main aim was to explain the aberrant running behavior of the protein and the oligomerization of the channel, we did not investigate this result further.
The slowing of NpHV1 even after the correction for the conductance–voltage shift seems very pronounced. The time constant for activation kinetics in human and rat HV1 zinc studies was not ‘corrected’ for the g H‐V shift. Therefore, we added two graphs in the supplement showing a summary of the ‘uncorrected data’ (Figs S1 and S2).
Conclusion
In conclusion, we report that the aspartate at position D145 in NpHV1 contributes very mildly to zinc inhibition. The histidine at position H92 is responsible for most inhibitory effects of zinc. The substitution of D145 for a histidine greatly increases zinc inhibition of NpHV1. The degree of Zn2+ sensitivity is dependent on whether there are zero, one, or two histidines at two specifically defined external positions. NpHV1 is inserted in the cell membrane as a dimer. This has been verified by biochemical analysis and limiting slope measurements. The marked shift in our τact(Zn2+)/ τact and g H‐V shifts at the different pHo points in the direction that there are still at least two titratable residues competing with zinc for binding. One possibility would be the coordination of zinc in the dimer interface instead of coordinating zinc in each monomer. Additionally, we have shown that the main effect of zinc and cadmium is the slowing of the rate constant of activation and NpHV1 currents and metal inhibition are reproduced via a simple kinetic model. In NpHV1, zinc changes neither the limiting slope nor does it change the steepness of the voltage dependence of gating. Instantaneous current analysis does not support the hypothesis of a voltage‐dependent block. The analyzed parameters support the hypothesis that zinc binds in the closed state of the channel. Comparison with other metal ion effects on ion channels concluded in zinc resembling a nonelectrostatic effect due to binding. Cadmium showed comparable effects to zinc on the g H‐V shift but increased the time constant of activation less. We believe that this study will further help to advance the deciphering of structure–function relationship and contribute to the development of novel‐specific inhibitors of HV1 channels, as, for example, an inhibiting protein C6 targets the S3‐S4 loop [59] too.
Material and methods
Gene expression
For gene expression, the NpHV1 gene was synthesized commercially (Eurofins Genomics, Ebersberg, Germany); then, the synthesized DNA including a 5′ BamHI and 3′ EcoRI restriction site was cloned into a pEX‐A2 plasmid. We subcloned the gene by restriction sites into a pQBI25‐fC3 or pcDNA3.1 using 5′BamHI and 3′ EcoRI restriction sites. Site‐directed mutagenesis was performed using an overlapping PCR procedure. Clones were sequenced commercially to confirm mutations.
tsA201 (human kidney cell line) cells were grown to 85% confluency in 35‐mm culture dishes. Cells were transfected with 1.3 μg plasmid DNA using polyethyleneimine (Sigma, St. Louis, MO, USA). After 12 h at 37 °C in 5% CO2, cells were trypsinized and replated onto glass coverslips at low density for patch‐clamp recording the same day and the next day. We selected green cells under fluorescence for recoding. Whole‐cell patch‐clamp showed no other voltage‐ or time‐dependent conductance under our recording conditions. tsA201 cells showed no native proton conductance without transfection‐induced expression of a protein by these cells. The level of expression of all mutants studied here was sufficiently high so that potential contamination by native HV1 currents was negligible.
Electrophysiology
Whole‐cell patch‐clamp or excised patch recordings were done as described in [53]: In brief, patch‐clamp amplifiers EPC 10 (HEKA, Lambrecht, Germany) and Axopatch 200b (Molecular Devices, Sunnyvale, CA, USA) were used. Recordings were stored on hard disks and analyzed with origin (Origin 2017, Northampton, MA, USA). Patch pipettes were made from borosilicate capillaries GC 150TF‐10 (Harvard Apparatus, Holliston, MA, USA) and pulled using Flaming Brown automatic pipette puller P‐1000 (Sutter Instruments, Novato, CA, USA). Pipettes were heat polished to a tip resistance ranging typically from 5 to 9 MΩ with pipette solutions used. Electrical contact with the pipette solution was achieved by a chloride silver wire and connected to the bath with an agar bridge made with Ringer’s solution. Seals were formed with Ringer’s solution (in mm 160 NaCl, 4.5 KCl, 2 CaCl2, 1 MgCl2, 5 HEPES, pH 7.4) in the bath, and the potential zeroed after the pipette was placed above the cell. Whole‐cell solutions (pipette and bath) included 100 mm buffer close to its pK a with tetramethylammonium (TMA+) and methanesulfonate (CH3SO3 −) as the main ions, 1 mm EGTA, and 1–2 mm Mg2+ with an osmolarity of 300 Osm. Buffers were HOMOPIPES at pH 4.5 and pH 5.0, MES at pH 5.5 and pH 6.0, Bis‐Tris at pH 6.5, PIPES at pH. 7.0, HEPES at pH 7.5, and HEPES at pH 8.0. EGTA was omitted from zinc‐containing solutions. Previously prepared ZnCl2 solutions of 1, 10, 100, and 1000 μm and controlled pH were used for solution exchange and measurement. The data are shown without corrections for buffer binding. We avoided using BES because of its high affinity for transition metals. The resistance of the seals was usually > 3 GΩ. Currents are shown without correction for leak or liquid junction potentials. Data were collected between 18 and 23 °C. Currents were fitted to a rising exponential to obtain the activation time constant (τact). The proton conductance (g H) was calculated from the steady‐state current (the fitted current extrapolated to infinite time) using reversal potentials (V rev) measured in each solution in each cell. In these fits, the initial delay was ignored; the remaining current usually fitted a single exponential well. The reversal potential was measured by two methods. If the threshold was negative to the V rev, it could be readily determined by the zero current. If V rev was negative to V thres, then V rev was determined with the tail current method [67]. The magnitude of g H‐V shift was determined by comparing the values of 10% of the maximal proton conductance, V(gH,max/10). Overexpression of the channels in small cells resulted in large proton currents that removed enough protons from the cell to change pHi greatly. Proton channel gating kinetics depends strongly on pH; therefore, proton depletion is a significant source of error. To minimize this problem, families with different pulse lengths were applied. Longer pulses were used to determine pulses close to V thres where τact is slow, while shorter pulses were used at more positive voltages. Since with the application of zinc the slowing of activation in some mutants was drastic, pulses lasting up to 1.5 min were necessary. Accumulation of the pulse length from 0.5 to 90 s in multiple current families to include all Zn2+ concentrations demanded the patch to survive for several hours.
Recording multiple control measurements to dissect zinc effects from patch progression
Patch progression was recorded frequently and was usually minimal. However, the zinc inhibition of NpHV1 is less than in HV1 of other species, and therefore, we recorded with multiple reference/control measurements to quantify best the amount of zinc‐induced changes.
Between the measurements of defined zinc concentrations, zinc‐free solutions were applied and control current families were recorded. The cell was washed with solution containing 1 mm EGTA, to ensure full removal of zinc from the channel, before applying nominally zinc‐free solution without EGTA. This was done to monitor possible changes of the patch which could be misinterpreted as zinc inhibition. Zinc inhibition was analyzed and compared to the last control measurement (at the end of the experiment) recorded. Figure 2A shows the last controls for pHo 7 and pHo 6. However, the pHo 5 families do not show the last control but the initial control to better display the progression of the patch. The current families in Fig. 2A exhibit no detectable effect of even 1 mm Zn2+ at pHo 5. In fact, due to better access to the cells during the experiment, the activation kinetics appears to be slightly faster than at the initial state. This effect also manifests as larger currents late in experiments when higher [Zn2+] was applied and is independent of the reversal potential, which was constant throughout the recording. Furthermore, we compared our analysis solely taking the initial control measurement (at the beginning of the experiment) into account and not correcting for the gH‐V shift (Figs S1 and S2). Initial control data underestimate the zinc effect at high concentrations. This is the case if current kinetics in the initial control is increased (slow) and is going to decrease (faster) by the progression of the patch (Fig. S3). Usually, an experiment starts with applying low concentrations of zinc, zinc is washed with control solution, and then, zinc concentrations are increased with intermediate washing steps. Therefore, a comparison of the initial control data with the low zinc concentrations describes the zinc effect, of low concentrations, well. Qualitatively, the effects at pHo 5 and pHo 6 were comparable in both ways of analysis. The measurements at pHo 8 show the initial control; here, the channel was drastically affected by zinc outweighing small changes of the patch.
Analysis of activation kinetics
The quotient τact/control τact was determined graphically. τact curves were shifted according to the g H‐V shift measured in the conductance–voltage plots to isolate the effects on kinetics from a pure voltage shift due to g H‐V modification. Then, at three consecutive voltage steps (e.g., 20, 30, 40 mV) the values of all zinc concentrations were taken and the quotients per voltage step calculated. The mean/average of the 3 quotients represented slowing at its zinc concentration.
Instantaneous current–voltage curves
After a defined prepulse, voltage steps from −100 to +100 mV were applied and the initial current measured. We plotted the instantaneous current against voltage and normalized the currents at the potential of +50 mV. The normalized currents of control and [Zn2+] reasonably overlapped for most of the voltage range. At positive voltages above +70 mV instantaneous, normalized currents inhibited by zinc were larger than currents without zinc (control). However, the small discrepancy in the instantaneous I‐V curves is due to the depletion of protons in the absence of Zn2+. As the change in V rev during the pulse would affect both the gating and the current amplitude, we did not try to compensate for depletion by scaling in relation to the depletion at prepulse.
Biochemical analysis
Construction of expression plasmids and heterologous expression
For high‐resolution clear native gel electrophoresis (hrCNE), we introduced a point mutation A206K using overlapping PCR to prevent GFP dimerization [68]. We additionally attached a His10‐tag or a StrepTagII sequence at the 3′end of the coding sequence of NpHV1‐GFP to demonstrate full‐length protein expression. HEK293T (tsA201) cells were transfected with 2.5 µg of Obi25‐fc3GFP/NpHV1 or the altered DNA using the calcium phosphate method. All experiments were performed 24 h after transfection.
High‐resolution clear native electrophoresis
Transfected HEK293T cells were treated as described in [69]. Briefly, cells were washed with ice‐cold phosphate‐buffered saline and lysed in a buffer containing 0.1 m sodium phosphate, pH 8.0, 0.5% digitonin, protease inhibitors, and 20 mm iodoacetamide for 15 min and transferred into a reaction tube. After a clear spin at 4 °C, an aliquot of the resulting whole‐cell lysate (approx. 10 µg) was loaded on a native gel. 4–14% acrylamide gradient gels were prepared as described [70, 71]. The anode buffer contained 25 mm imidazole/HCl, pH 7.0, and cathode buffer 50 mm Tricine, 7.5 mm imidazole, pH 7.0. Cathode buffer was supplemented with the anionic detergent DOC (0.05%) and the nonionic detergent DDM (0.01%) [71]. Gels were run in the cold (8 °C), and the original voltage was set to 100 V. After 1 h, the voltage was raised to 150 V. The electrophoresis was stopped after an additional 2 h.
Gels were scanned on a fluorescence gel scanner (Typhoon FLA 9500, GE Healthcare, Freiburg, Germany) at 100‐µm resolution. GFP was excited at 473 nm, and its emission recorded using a 530/20 bandpass filter. Gel images were visualized using fiji software [72].
Simple kinetic model
We used the approach from Hodgkin and Huxley [67] and reproduced the NpHV1 currents via a kinetic model. To determine the rate constant for the parameters α and β, we fitted the proton conductance of the control measurements over time and determined the activation kinetics and the maximal conductance per voltage. Deactivation kinetics was fitted the same way. Out of the values for α and β, we generated rate constant equations that allowed us to describe the proton conductance properties over a wide range of voltages. Small adjustments to the rate constant equations were made since the extreme negative and positive voltages allowed a better estimation of β or α, respectively. Zinc or cadmium rate constant equations were modified exclusively by additionally dividing by a factor. The resulting calculated current families of the ‘slowed’ rate constant equations overlapped the measured current families well. Exclusively, with concentrations of 100 μm Zn2+ or 1 mm Cd2+ β rate constant equation was slowed too. This can be readily seen in the deactivation kinetics. All calculations were done with origin (Origin 2017). Tail current amplitude of the modeled currents was much higher than in the actual patch‐clamp measurements. This might be partially attributed to analog filtering at 20 Hz during the measurement and partially due to the fact that HH model seemed to underestimate the steepness of the conductance of NpHV1.
Conflict of interest
The authors declare no conflict of interest.
Author contributions
GC performed and designed patch‐clamp experiments. SB conducted protein biochemistry and wrote parts of the manuscript, and AF generated mutants. IM conducted cell culture, and BM performed and designed experiments, and wrote the manuscript.
Supporting information
Fig. S1. Kinetic changes NpHV1 analyzed using the initial control without gH‐V shift correction.
Fig. S2. Kinetic changes NpHV1 analyzed without gH‐V shift correction.
Fig. S3. D145A NpHV1 inhibition by zinc.
Fig. S4. E105A NpHV1 inhibition by zinc.
Appendix S1. Equations used to create the models for zinc inhibition and cadmium inhibition!
Acknowledgments
We have to thank Photini Drummer for the excellent support. We thank Petra Thelen for the excellent support. Prof. T.E. DeCoursey for helpful discussion. This study was supported by DFG grant MU 3574/4‐1 to BM. W. Lutz‐Stiftung grant to GC.
References
- 1. Thomas RC & Meech RW (1982) Hydrogen ion currents and intracellular pH in depolarized voltage‐clamped snail neurones. Nature 299, 826–828. [DOI] [PubMed] [Google Scholar]
- 2. Ramsey IS, Moran MM, Chong JA & Clapham DE (2006) A voltage‐gated proton‐selective channel lacking the pore domain. Nature 440, 1213–1216. [DOI] [PMC free article] [PubMed] [Google Scholar]
- 3. Sasaki M, Takagi M & Okamura Y (2006) A voltage sensor‐domain protein is a voltage‐gated proton channel. Science 312, 589–592. [DOI] [PubMed] [Google Scholar]
- 4. Taylor AR, Chrachri A, Wheeler G, Goddard H & Brownlee C (2011) A voltage‐gated H+ channel underlying pH homeostasis in calcifying coccolithophores. PLoS Biol 9, e1001085. [DOI] [PMC free article] [PubMed] [Google Scholar]
- 5. Chaves G, Derst C, Franzen A, Mashimo Y, Machida R & Musset B (2016) Identification of an HV 1 voltage‐gated proton channel in insects. FEBS J 283, 1453–464. [DOI] [PubMed] [Google Scholar]
- 6. Ratanayotha A, Kawai T, Higashijima SI & Okamura Y (2017) Molecular and functional characterization of the voltage‐gated proton channel in zebrafish neutrophils. Physiol Rep 5, e13345. [DOI] [PMC free article] [PubMed] [Google Scholar]
- 7. Sakata S, Miyawaki N, McCormack TJ, Arima H, Kawanabe A, Ozkucur N, Kurokawa T, Jinno Y, Fujiwara Y & Okamura Y (2016) Comparison between mouse and sea urchin orthologs of voltage‐gated proton channel suggests role of S3 segment in activation gating. Biochim Biophys Acta 1858, 2972–2983. [DOI] [PubMed] [Google Scholar]
- 8. Rodriguez JD, Haq S, Bachvaroff T, Nowak KF, Nowak SJ, Morgan D, Cherny VV, Sapp MM, Bernstein S, Bolt A et al (2017) Identification of a vacuolar proton channel that triggers the bioluminescent flash in dinoflagellates. PLoS ONE 12, e0171594. [DOI] [PMC free article] [PubMed] [Google Scholar]
- 9. Smith SM, Morgan D, Musset B, Cherny VV, Place AR, Hastings JW & DeCoursey TE (2011) Voltage‐gated proton channel in a dinoflagellate. Proc Natl Acad Sci USA 108, 18162–18167. [DOI] [PMC free article] [PubMed] [Google Scholar]
- 10. Taylor AR, Brownlee C & Wheeler GL (2012) Proton channels in algae: reasons to be excited. Trends Plant Sci 17, 675–684. [DOI] [PubMed] [Google Scholar]
- 11. DeCoursey TE (2015) The voltage‐gated proton channel: A riddle, wrapped in a mystery, inside an enigma. Biochemistry 54, 3250–3268. [DOI] [PMC free article] [PubMed] [Google Scholar]
- 12. Baud C & Barish ME (1984) Changes in membrane hydrogen and sodium conductances during progesterone‐induced maturation of Ambystoma oocytes. Dev Biol 105, 423–434. [DOI] [PubMed] [Google Scholar]
- 13. Pantazis A, Keegan P, Postma M & Schwiening CJ (2006) The effect of neuronal morphology and membrane‐permeant weak acid and base on the dissipation of depolarization‐induced pH gradients in snail neurons. Pflugers Arch 452, 175–187. [DOI] [PubMed] [Google Scholar]
- 14. Morgan D, Capasso M, Musset B, Cherny VV, Rios E, Dyer MJ & DeCoursey TE (2009) Voltage‐gated proton channels maintain pH in human neutrophils during phagocytosis. Proc Natl Acad Sci USA 106, 18022–18027. [DOI] [PMC free article] [PubMed] [Google Scholar]
- 15. Fischer H, Widdicombe JH & Illek B (2002) Acid secretion and proton conductance in human airway epithelium. Am J Physiol Cell Physiol 282, C736–C743. [DOI] [PubMed] [Google Scholar]
- 16. Iovannisci D, Illek B & Fischer H (2010) Function of the HVCN1 proton channel in airway epithelia and a naturally occurring mutation, M91T. J Gen Physiol 136, 35–46. [DOI] [PMC free article] [PubMed] [Google Scholar]
- 17. Fischer H & Widdicombe JH (2006) Mechanisms of acid and base secretion by the airway epithelium. J Membr Biol 211, 139–150. [DOI] [PMC free article] [PubMed] [Google Scholar]
- 18. Murphy R & DeCoursey TE (2006) Charge compensation during the phagocyte respiratory burst. Biochim Biophys Acta 1757, 996–1011. [DOI] [PubMed] [Google Scholar]
- 19. DeCoursey TE (2003) Interactions between NADPH oxidase and voltage‐gated proton channels: why electron transport depends on proton transport. FEBS Lett 555, 57–61. [DOI] [PubMed] [Google Scholar]
- 20. DeCoursey TE, Morgan D & Cherny VV (2003) The voltage dependence of NADPH oxidase reveals why phagocytes need proton channels. Nature 422, 531–534. [DOI] [PubMed] [Google Scholar]
- 21. Henderson LM, Chappell JB & Jones OT (1988) Internal pH changes associated with the activity of NADPH oxidase of human neutrophils. Further evidence for the presence of an H+ conducting channel. Biochem J 251, 563–567. [DOI] [PMC free article] [PubMed] [Google Scholar]
- 22. Musset B, Cherny VV & DeCoursey TE (2012) Strong glucose dependence of electron current in human monocytes. Am J Physiol Cell Physiol 302, C286–C295. [DOI] [PMC free article] [PubMed] [Google Scholar]
- 23. Ramsey IS, Ruchti E, Kaczmarek JS & Clapham DE (2009) Hv1 proton channels are required for high‐level NADPH oxidase‐dependent superoxide production during the phagocyte respiratory burst. Proc Natl Acad Sci USA 106, 7642–7647. [DOI] [PMC free article] [PubMed] [Google Scholar]
- 24. Okochi Y, Sasaki M, Iwasaki H & Okamura Y (2009) Voltage‐gated proton channel is expressed on phagosomes. Biochem Biophys Res Commun 382, 274–279. [DOI] [PubMed] [Google Scholar]
- 25. Zhu X, Mose E & Zimmermann N (2013) Proton channel HVCN1 is required for effector functions of mouse eosinophils. BMC Immunol 14, 24. [DOI] [PMC free article] [PubMed] [Google Scholar]
- 26. El Chemaly A, Okochi Y, Sasaki M, Arnaudeau S, Okamura Y & Demaurex N (2010) VSOP/Hv1 proton channels sustain calcium entry, neutrophil migration, and superoxide production by limiting cell depolarization and acidification. J Exp Med 207, 129–139. [DOI] [PMC free article] [PubMed] [Google Scholar]
- 27. Lishko PV, Botchkina IL, Fedorenko A & Kirichok Y (2010) Acid extrusion from human spermatozoa is mediated by flagellar voltage‐gated proton channel. Cell 140, 327–337. [DOI] [PubMed] [Google Scholar]
- 28. Musset B, Morgan D, Cherny VV, MacGlashan DW Jr, Thomas LL, Rios E & DeCoursey TE (2008) A pH‐stabilizing role of voltage‐gated proton channels in IgE‐mediated activation of human basophils. Proc Natl Acad Sci USA 105, 11020–5. [DOI] [PMC free article] [PubMed] [Google Scholar]
- 29. Wang Y, Li SJ, Pan J, Che Y, Yin J & Zhao Q (2011) Specific expression of the human voltage‐gated proton channel Hv1 in highly metastatic breast cancer cells, promotes tumor progression and metastasis. Biochem Biophys Res Commun 412, 353–359. [DOI] [PubMed] [Google Scholar]
- 30. Wang Y, Li SJ, Wu X, Che Y & Li Q (2012) Clinicopathological and biological significance of human voltage‐gated proton channel Hv1 protein overexpression in breast cancer. J Biol Chem 287, 13877–13888. [DOI] [PMC free article] [PubMed] [Google Scholar]
- 31. Wang Y, Wu X, Li Q, Zhang S & Li SJ (2013) Human voltage‐gated proton channel hv1: a new potential biomarker for diagnosis and prognosis of colorectal cancer. PLoS ONE 8, e70550. [DOI] [PMC free article] [PubMed] [Google Scholar]
- 32. Wang Y, Zhang S & Li SJ (2013) Zn(2+) induces apoptosis in human highly metastatic SHG‐44 glioma cells, through inhibiting activity of the voltage‐gated proton channel Hv1. Biochem Biophys Res Commun 438, 312–317. [DOI] [PubMed] [Google Scholar]
- 33. Capasso M, Bhamrah MK, Henley T, Boyd RS, Langlais C, Cain K, Dinsdale D, Pulford K, Khan M, Musset B et al (2010) HVCN1 modulates BCR signal strength via regulation of BCR‐dependent generation of reactive oxygen species. Nat Immunol 11, 265–272. [DOI] [PMC free article] [PubMed] [Google Scholar]
- 34. Hondares E, Brown MA, Musset B, Morgan D, Cherny VV, Taubert C, Bhamrah MK, Coe D, Marelli‐Berg F, Gribben JG et al (2014) Enhanced activation of an amino‐terminally truncated isoform of the voltage‐gated proton channel HVCN1 enriched in malignant B cells. Proc Natl Acad Sci USA 111, 18078–18083. [DOI] [PMC free article] [PubMed] [Google Scholar]
- 35. Kuno M, Kawawaki J & Nakamura F (1997) A highly temperature‐sensitive proton current in mouse bone marrow‐derived mast cells. J Gen Physiol 109, 731–740. [DOI] [PMC free article] [PubMed] [Google Scholar]
- 36. Wu LJ, Wu G, Akhavan Sharif MR, Baker A, Jia Y, Fahey FH, Luo HR, Feener EP & Clapham DE (2012) The voltage‐gated proton channel Hv1 enhances brain damage from ischemic stroke. Nat Neurosci 15, 565–573. [DOI] [PMC free article] [PubMed] [Google Scholar]
- 37. Murphy R, Cherny VV, Morgan D & DeCoursey TE (2005) Voltage‐gated proton channels help regulate pHi in rat alveolar epithelium. Am J Physiol Lung Cell Mol Physiol 288, L398–L408. [DOI] [PubMed] [Google Scholar]
- 38. Cho DY, Hajighasemi M, Hwang PH, Illek B & Fischer H (2009) Proton secretion in freshly excised sinonasal mucosa from asthma and sinusitis patients. Am J Rhinol Allergy 23, e10–e13. [DOI] [PMC free article] [PubMed] [Google Scholar]
- 39. Morihata H, Nakamura F, Tsutada T & Kuno M (2000) Potentiation of a voltage‐gated proton current in acidosis‐induced swelling of rat microglia. J Neurosci 20, 7220–7227. [DOI] [PMC free article] [PubMed] [Google Scholar]
- 40. Eder C & DeCoursey TE (2001) Voltage‐gated proton channels in microglia. Prog Neurogibol 64, 277–305. [DOI] [PubMed] [Google Scholar]
- 41. Femling JK, Cherny VV, Morgan D, Rada B, Davis AP, Czirjak G, Enyedi P, England SK, Moreland JG, Ligeti E et al (2006) The antibacterial activity of human neutrophils and eosinophils requires proton channels but not BK channels. J Gen Physiol 127, 659–672. [DOI] [PMC free article] [PubMed] [Google Scholar]
- 42. Suenaga T, Arase H, Yamasaki S, Kohno M, Yokosuka T, Takeuchi A, Hattori T & Saito T (2007) Cloning of B cell‐specific membrane tetraspanning molecule BTS possessing B cell proliferation‐inhibitory function. Eur J Immunol 37, 3197–3207. [DOI] [PubMed] [Google Scholar]
- 43. DeCoursey TE (2013) Voltage‐gated proton channels: molecular biology, physiology, and pathophysiology of the HV family. Physiol Rev 93, 599–652. [DOI] [PMC free article] [PubMed] [Google Scholar]
- 44. Gordienko DV, Tare M, Parveen S, Fenech CJ, Robinson C & Bolton TB (1996) Voltage‐activated proton current in eosinophils from human blood. J Physiol 496 (Pt 2), 299–316. [DOI] [PMC free article] [PubMed] [Google Scholar]
- 45. Kapus A, Romanek R & Grinstein S (1994) Arachidonic acid stimulates the plasma membrane H+ conductance of macrophages. J Biol Chem 269, 4736–4745. [PubMed] [Google Scholar]
- 46. Cherny VV, Thomas LL & DeCoursey TE (2001) Voltage‐gated proton currents in human basophils. Biol Membrany 18, 458–465. [Google Scholar]
- 47. DeCoursey TE & Cherny VV (1996) Voltage‐activated proton currents in human THP‐1 monocytes. J Membr Biol 152, 131–140. [DOI] [PubMed] [Google Scholar]
- 48. Mozhayeva GN & Naumov AP (1983) The permeability of sodium channels to hydrogen ions in nerve fibres. Pflügers Arch 396, 163–173. [DOI] [PubMed] [Google Scholar]
- 49. Mozhayeva GN, Naumov AP & Negulyaev YA (1982) Interaction of H+ ions with acid groups in normal sodium channels. Gen Physiol Biophys 1, 5–19. [Google Scholar]
- 50. Hille B (1968) Charges and potentials at the nerve surface. Divalent ions and pH. J Gen Physiol 51, 221–236. [DOI] [PMC free article] [PubMed] [Google Scholar]
- 51. Cherny VV, Markin VS & DeCoursey TE (1995) The voltage‐activated hydrogen ion conductance in rat alveolar epithelial cells is determined by the pH gradient. J Gen Physiol 105, 861–896. [DOI] [PMC free article] [PubMed] [Google Scholar]
- 52. DeCoursey TE & Cherny VV (1997) Deuterium isotope effects on permeation and gating of proton channels in rat alveolar epithelium. J Gen Physiol 109, 415–434. [DOI] [PMC free article] [PubMed] [Google Scholar]
- 53. Musset B, Cherny VV, Morgan D, Okamura Y, Ramsey IS, Clapham DE & DeCoursey TE (2008) Detailed comparison of expressed and native voltage‐gated proton channel currents. J Physiol 586, 2477–2486. [DOI] [PMC free article] [PubMed] [Google Scholar]
- 54. Hong L, Kim IH & Tombola F (2014) Molecular determinants of Hv1 proton channel inhibition by guanidine derivatives. Proc Natl Acad Sci USA 111, 9971–9976. [DOI] [PMC free article] [PubMed] [Google Scholar]
- 55. Hong L, Singh V, Wulff H & Tombola F (2015) Interrogation of the intersubunit interface of the open Hv1 proton channel with a probe of allosteric coupling. Sci Rep 5, 14077. [DOI] [PMC free article] [PubMed] [Google Scholar]
- 56. Alabi AA, Bahamonde MI, Jung HJ, Kim JI & Swartz KJ (2007) Portability of paddle motif function and pharmacology in voltage sensors. Nature 450, 370–375. [DOI] [PMC free article] [PubMed] [Google Scholar]
- 57. Hong L, Pathak MM, Kim IH, Ta D & Tombola F (2013) Voltage‐sensing domain of voltage‐gated proton channel Hv1 shares mechanism of block with pore domains. Neuron 77, 274–287. [DOI] [PMC free article] [PubMed] [Google Scholar]
- 58. Rennhack A, Grahn E, Kaupp UB & Berger TK (2017) Photocontrol of the Hv1 proton channel. ACS Chem Biol 12, 2952–2957. [DOI] [PubMed] [Google Scholar]
- 59. Zhao R, Kennedy K, De Blas GA, Orta G, Pavarotti MA, Arias RJ, de la Vega‐Beltran JL, Li Q, Dai H, Perozo E et al (2018) Role of human Hv1 channels in sperm capacitation and white blood cell respiratory burst established by a designed peptide inhibitor. Proc Natl Acad Sci USA 115, E11847–E11856. [DOI] [PMC free article] [PubMed] [Google Scholar]
- 60. Cherny VV & DeCoursey TE (1999) pH‐dependent inhibition of voltage‐gated H+ currents in rat alveolar epithelial cells by Zn2+ and other divalent cations. J Gen Physiol 114, 819–838. [DOI] [PMC free article] [PubMed] [Google Scholar]
- 61. Musset B, Smith SM, Rajan S, Morgan D, Cherny VV & DeCoursey TE (2011) Aspartate 112 is the selectivity filter of the human voltage‐gated proton channel. Nature 480, 273–277. [DOI] [PMC free article] [PubMed] [Google Scholar]
- 62. Musset B, Smith SM, Rajan S, Cherny VV, Sujai S, Morgan D & DeCoursey TE (2010) Zinc inhibition of monomeric and dimeric proton channels suggests cooperative gating. J Physiol 588, 1435–1449. [DOI] [PMC free article] [PubMed] [Google Scholar]
- 63. Takeshita K, Sakata S, Yamashita E, Fujiwara Y, Kawanabe A, Kurokawa T, Okochi Y, Matsuda M, Narita H, Okamura Y & et al (2014) X‐ray crystal structure of voltage‐gated proton channel. Nat Struct Mol Biol 21, 352–357. [DOI] [PubMed] [Google Scholar]
- 64. Iwaki M, Takeshita K, Kondo HX, Kinoshita K, Okamura Y, Takano Y, Nakagawa A & Kandori H (2018) Zn(2+)‐binding to the voltage‐gated proton channel Hv1/VSOP. J Phys Chem B 122, 9076–9080. [DOI] [PubMed] [Google Scholar]
- 65. Qiu F, Chamberlin A, Watkins BM, Ionescu A, Perez ME, Barro‐Soria R, Gonzalez C, Noskov SY & Larsson HP (2016) Molecular mechanism of Zn2+ inhibition of a voltage‐gated proton channel. Proc Natl Acad Sci USA 113, E5962–E5971. [DOI] [PMC free article] [PubMed] [Google Scholar]
- 66. De La Rosa V, Bennett AL & Ramsey IS (2018) Coupling between an electrostatic network and the Zn(2+) binding site modulates Hv1 activation. J Gen Physiol 150, 863–881. [DOI] [PMC free article] [PubMed] [Google Scholar]
- 67. Hodgkin AL & Huxley AF (1952) A quantitative description of membrane current and its application to conduction and excitation in nerve. J Physiol 117, 500–544. [DOI] [PMC free article] [PubMed] [Google Scholar]
- 68. Zacharias DA, Violin JD, Newton AC & Tsien RY (2002) Partitioning of lipid‐modified monomeric GFPs into membrane microdomains of live cells. Science 296, 913–916. [DOI] [PubMed] [Google Scholar]
- 69. Guzman RE, Bungert‐Plumke S, Franzen A & Fahlke C (2017) Preferential association with ClC‐3 permits sorting of ClC‐4 into endosomal compartments. J Biol Chem 292, 19055–19065. [DOI] [PMC free article] [PubMed] [Google Scholar]
- 70. Nicke A, Rettinger J, Mutschler E & Schmalzing G (1999) Blue native PAGE as a useful method for the analysis of the assembly of distinct combinations of nicotinic acetylcholine receptor subunits. J Recept Signal Transduct Res 19, 493–507. [DOI] [PubMed] [Google Scholar]
- 71. Wittig I, Karas M & Schagger H (2007) High resolution clear native electrophoresis for in‐gel functional assays and fluorescence studies of membrane protein complexes. Mol Cell Proteomics 6, 1215–1225. [DOI] [PubMed] [Google Scholar]
- 72. Schneider CA, Rasband WS & Eliceiri KW (2012) NIH image to ImageJ: 25 years of image analysis. Nat Methods 9, 671–675. [DOI] [PMC free article] [PubMed] [Google Scholar]
- 73. DeCoursey TE & Cherny VV (1998) Temperature dependence of voltage‐gated H+ currents in human neutrophils, rat alveolar epithelial cells, and mammalian phagocytes. J Gen Physiol 112, 503–522. [DOI] [PMC free article] [PubMed] [Google Scholar]
- 74. Cherny VV, Morgan D, Musset B, Chaves G, Smith SM & DeCoursey TE (2015) Tryptophan 207 is crucial to the unique properties of the human voltage‐gated proton channel, hHV1. J Gen Physiol 146, 343–356. [DOI] [PMC free article] [PubMed] [Google Scholar]
- 75. Fujiwara Y, Takeshita K, Nakagawa A & Okamura Y (2013) Structural characteristics of the redox‐sensing coiled coil in the voltage‐gated H+ channel. J Biol Chem 288, 17968–17975. [DOI] [PMC free article] [PubMed] [Google Scholar]
- 76. Almers W (1978) Gating currents and charge movements in excitable membranes. Rev Physiol Biochem Pharmacol 82, 96–190. [DOI] [PubMed] [Google Scholar]
- 77. Sigg D & Bezanilla F (1997) Total charge movement per channel. The relation between gating charge displacement and the voltage sensitivity of activation. J Gen Physiol 109, 27–39. [DOI] [PMC free article] [PubMed] [Google Scholar]
- 78. Fujiwara Y, Kurokawa T, Takeshita K, Kobayashi M, Okochi Y, Nakagawa A & Okamura Y (2012) The cytoplasmic coiled‐coil mediates cooperative gating temperature sensitivity in the voltage‐gated H(+) channel Hv1. Nat Commun 3, 816. [DOI] [PubMed] [Google Scholar]
- 79. Gonzalez C, Koch HP, Drum BM & Larsson HP (2010) Strong cooperativity between subunits in voltage‐gated proton channels. Nat Struct Mol Biol 17, 51–56. [DOI] [PMC free article] [PubMed] [Google Scholar]
- 80. Gonzalez C, Rebolledo S, Perez ME & Larsson HP (2013) Molecular mechanism of voltage sensing in voltage‐gated proton channels. J Gen Physiol 141, 275–285. [DOI] [PMC free article] [PubMed] [Google Scholar]
- 81. DeCoursey TE & Cherny VV (1996) Effects of buffer concentration on voltage‐gated H+ currents: does diffusion limit the conductance? Biophys J 71, 182–193. [DOI] [PMC free article] [PubMed] [Google Scholar]
- 82. Gilly WF & Armstrong CM (1982) Divalent cations and the activation kinetics of potassium channels in squid giant axons. J Gen Physiol 79, 965–996. [DOI] [PMC free article] [PubMed] [Google Scholar]
- 83. Vandenberg CA & Bezanilla F (1991) Single‐channel, macroscopic, and gating currents from sodium channels in the squid giant axon. Biophys J 60, 1499–1510. [DOI] [PMC free article] [PubMed] [Google Scholar]
- 84. Fujiwara Y, Kurokawa T, Takeshita K, Nakagawa A, Larsson HP & Okamura Y (2013) Gating of the designed trimeric/tetrameric voltage‐gated H+ channel. J Physiol 591, 627–640. [DOI] [PMC free article] [PubMed] [Google Scholar]
- 85. Thomas S, Cherny VV, Morgan D, Artinian LR, Rehder V, Smith SME & DeCoursey TE (2018) Exotic properties of a voltage‐gated proton channel from the snail Helisoma trivolvis . J Gen Physiol 150, 835–850. [DOI] [PMC free article] [PubMed] [Google Scholar]
- 86. Kurokawa T & Okamura Y (2014) Mapping of sites facing aqueous environment of voltage‐gated proton channel at resting state: a study with PEGylation protection. Biochim Biophys Acta 1838, 382–387. [DOI] [PubMed] [Google Scholar]
- 87. Gonzalez C & Larsson HP (2010) Permeation mechanism in voltage‐activated proton channels: a new glimpse. Proc Natl Acad Sci USA 107, 1817–1818. [DOI] [PMC free article] [PubMed] [Google Scholar]
- 88. Morgan D, Musset B, Kulleperuma K, Smith SM, Rajan S, Cherny VV, Pomes R & DeCoursey TE (2013) Peregrination of the selectivity filter delineates the pore of the human voltage‐gated proton channel hHV1. J Gen Physiol 142, 625–640. [DOI] [PMC free article] [PubMed] [Google Scholar]
- 89. Demaurex N, Grinstein S, Jaconi M, Schlegel W, Lew DP & Krause KH (1993) Proton currents in human granulocytes: regulation by membrane potential and intracellular pH. J Physiol 466, 329–344. [PMC free article] [PubMed] [Google Scholar]
- 90. Hoch E, Lin W, Chai J, Hershfinkel M, Fu D & Sekler I (2012) Histidine pairing at the metal transport site of mammalian ZnT transporters controls Zn2+ over Cd2+ selectivity. Proc Natl Acad Sci USA 109, 7202–7207. [DOI] [PMC free article] [PubMed] [Google Scholar]
- 91. Ohana E, Hoch E, Keasar C, Kambe T, Yifrach O, Hershfinkel M & Sekler I (2009) Identification of the Zn2+ binding site and mode of operation of a mammalian Zn2+ transporter. J Biol Chem 284, 17677–17686. [DOI] [PMC free article] [PubMed] [Google Scholar]
- 92. Wei Y & Fu D (2006) Binding and transport of metal ions at the dimer interface of the Escherichia coli metal transporter YiiP. J Biol Chem 281, 23492–23502. [DOI] [PubMed] [Google Scholar]
- 93. Elinder F & Århem P (2003) Metal ion effects on ion channel gating. Q Rev Biophys 36, 373–427. [DOI] [PubMed] [Google Scholar]
- 94. Armstrong CM & Cota G (1990) Modification of sodium channel gating by lanthanum. Some effects that cannot be explained by surface charge theory. J Gen Physiol. 96, 1129–40. [DOI] [PMC free article] [PubMed] [Google Scholar]
- 95. Barish ME & Baud C (1984) A voltage‐gated hydrogen ion current in the oocyte membrane of the axolotl, Ambystoma. J Physiol 352, 243–263. [DOI] [PMC free article] [PubMed] [Google Scholar]
Associated Data
This section collects any data citations, data availability statements, or supplementary materials included in this article.
Supplementary Materials
Fig. S1. Kinetic changes NpHV1 analyzed using the initial control without gH‐V shift correction.
Fig. S2. Kinetic changes NpHV1 analyzed without gH‐V shift correction.
Fig. S3. D145A NpHV1 inhibition by zinc.
Fig. S4. E105A NpHV1 inhibition by zinc.
Appendix S1. Equations used to create the models for zinc inhibition and cadmium inhibition!