

Abstract
Background
The objective of this study was to determine whether neurotoxic kynurenine metabolites, induced by inflammation, in plasma and cerebrospinal fluid (CSF) are associated with symptom severity and nigral pathology in Parkinson's disease (PD).
Methods
Clinical and MRI data were obtained from 97 PD and 89 controls. We used ultra‐performance liquid chromatography to quantify kynurenine metabolites and high‐sensitivity multiplex assays to quantify inflammation in plasma and CSF. We evaluated group‐wise differences as well as associations between the biomarkers, motor and nonmotor symptoms, and nigral R2* (MRI metric reflecting iron content).
Results
PD subjects had >100% higher 3‐hydroxykynurenine and 14% lower 3‐hydroxyanthranilic acid in plasma. The 3‐HK in plasma was closely associated with both symptom severity and disease duration. PD subjects also had 23% lower kynurenic acid in the CSF. Higher CSF levels of the excitotoxin quinolinic acid were associated with more severe symptoms, whereas lower levels of the neuroprotective kynurenic acid were linked to olfactory deficits. An elevated quinolinic acid/picolinic acid ratio in the CSF correlated with higher R2* values in the substantia nigra in the entire cohort. Plasma C‐reactive protein and serum amyloid alpha were associated with signs of increased kynurenine pathway activity in the CSF of PD patients, but not in controls.
Conclusions
In PD, the kynurenine pathway metabolite levels are altered in both the periphery and the central nervous system, and these changes are associated with symptom severity. Replication studies are warranted in other cohorts, and these can also explore if kynurenine metabolites might be PD biomarkers and/or are involved in PD pathogenesis. © 2020 The Authors. Movement Disorders published by Wiley Periodicals LLC on behalf of International Parkinson and Movement Disorder Society.
Keywords: cerebrospinal fluid, inflammation, kynurenine metabolites, Parkinson's disease, tryptophan
Parkinson's disease (PD) is a common, progressive movement disorder that also features debilitating nonmotor symptoms. The neurodegenerative features of PD include the loss of dopaminergic neurons in the substantia nigra pars compacta, the formation of α‐synuclein‐containing Lewy bodies and increased neuroinflammation. 1 , 2 Current therapies only temporarily reduce PD symptoms and do not stop disease progression. The mechanisms responsible for neuronal death in PD are not fully understood, which has made the development of disease‐modifying therapies a challenge. Furthermore, there is a lack of biomarkers that could predict PD development or reflect disease severity.
Increased metabolism of tryptophan via the kynurenine pathway (Fig. 1) is a consequence of inflammation. 3 , 4 A number of intermediate metabolites of this pathway have potent neuroactive and inflammatory properties. Quinolinic acid (QUIN) is an N‐methyl‐D‐aspartate (NMDA)–receptor agonist and excitotoxin. In the presence of high levels of QUIN, overactivation of glutamate receptors leads to increased cytoplasmic levels of Ca2+, which may initiate a range of toxic processes. In addition to its direct action at the NMDA receptor, QUIN can cause increased neuronal glutamate release, decreased glutamate uptake by astrocytes, and activation of microglia and neuroinflammation. 5 Another kynurenine pathway metabolite is 3‐hydroxykynurenine (3‐HK), which can induce cell death by the generation of free radicals and oxidative stress and can act in synergy with QUIN. 6 Other metabolites, such as kynurenic and picolinic acids, counteract the effects of QUIN and 3‐HK and thereby can be neuroprotective. 4 Because changes in the kynurenine pathway metabolites can lead to neurodegeneration, this metabolic pathway has been suggested to be part of the PD pathogenesis. 7 Multiple lines of evidence based on both clinical observations and findings in experimental models support this idea. Several large‐scale genome‐wide association studies 8 , 9 have identified single‐nucleotide polymorphisms associated with PD risk in regulatory regions of 2‐amino‐3‐carboxymuconic‐6‐semialdehyde decarboxylase (ACMSD), an enzyme in the kynurenine pathway that directly regulates the production of QUIN. Moreover, point mutations 10 and deletions 11 within the ACMSD gene itself have been found in sporadic PD and a familial syndrome with tremor and parkinsonism, respectively. Recent studies have detected activation of the kynurenine pathway in the plasma of PD patients, 12 , 13 , 14 but did not reveal if the changes were associated with symptom severity, ongoing systemic inflammation, or changes in brain as detected by MRI imaging in PD.
FIG. 1.
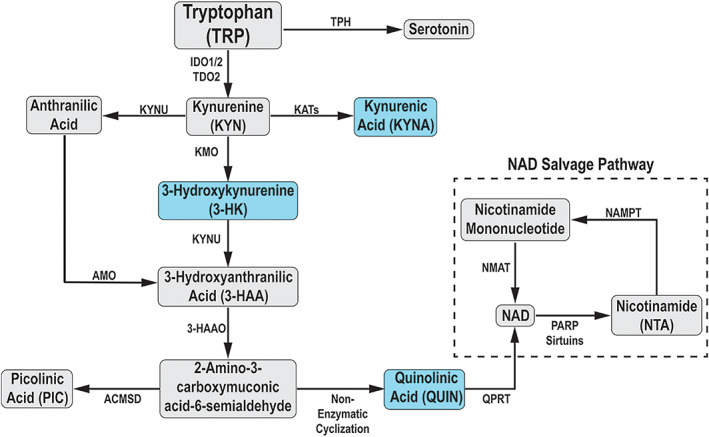
Simplified schematic of the kynurenine pathway. IDO, indoleamine 2,3‐dioxygenase; TDO, tryptophan 2,3‐dioxygenase; KAT, kynurenine amino transferase; KYNU, kynureninase; KMO, kynurenine 3‐monooxygenase; 3‐HAO, 3‐hydroxyanthranilic acid 3,4‐dioxygenase; ACMSD, α‐amino‐β‐carboxymuconate‐ε‐semialdehyde decarboxylase; QPRT, quinolinate phosphoribosyl transferase; NAD, nicotinamide dinucleotide. Metabolites shaded in blue are known to have neuroactive properties. Metabolites with abbreviations were analyzed in this study. [Color figure can be viewed at wileyonlinelibrary.com]
Thus, in the present study we examined a large and clinically well‐characterized cohort to establish how/if the levels of kynurenine metabolites and inflammatory factors in plasma and CSF differ between PD subjects and age‐ and sex‐matched healthy controls. We hypothesized that PD subjects would exhibit increased activation of the kynurenine pathway with an accumulation of the neurotoxic metabolites QUIN and 3‐HK and that these changes would associate with the severity of clinical symptoms as well as with neuroimaging metrics reflecting PD‐related neuropathology in the substantia nigra.
Methods
Participants
We obtained clinical and MRI data from 100 PD and 90 control subjects who participated in the National Institute of Neurological Disorders and Stroke PD Biomarker Program (NINDS PDBP) at Pennsylvania State University between 2012 and 2015. PD diagnosis was confirmed by movement disorders specialists. 15 , 16 Three patients were excluded due to other neuropathological diagnoses postmortem, leaving 97 patients. One control received a postmortem neurological diagnosis and was excluded, leaving 89 controls. All 186 included participants were free of major medical issues and neurological conditions other than PD. Demographic data are provided in Supplemental Table 1. Disease duration was defined as years between date of first PD diagnosis by a medical professional and the study visit date.
Clinical Assessments
The NINDS PDBP used NINDS common data elements for collection of clinical data. We used the UPDRS scores (obtained for PD participants in the “on‐medication” state) to assess nonmotor and motor severity. Montreal Cognitive Assessment (MoCA) 17 and University of Pennsylvania Smell Identification Test (UPSIT) 18 scores were used to assess cognitive functioning and olfaction.
Blood and CSF Sampling
Biological samples were drawn in the morning before 10 am. Fasting blood was obtained in BD Vacutainer Glass Blood Collection Tubes with K3‐ethylenediaminetetraacetic acid (Fisher Scientific, Hampton, NH), centrifuged at 1700g for 10 minutes, followed by aspiration, ensuring that none of the buffy coat contaminated the plasma. CSF samples were available for a subset (30 controls and 25 PD patients). Lumbar punctures were performed by an experienced neurologist following sterile PDBP procedures that used a 24/22G Sprotte atramatic, introducer, and 22G hypodermic needles, along with a plastic syringe (6 mL) to draw the CSF. Within 15 minutes of collection, the samples were transferred to 15 mL of conical tubes and centrifuged at 2000g for 10 minutes at room temperature. For both plasma and CSF, 1‐mL aliquots were banked at Pennsylvania State University in a −80°C freezer with CO2 backup and 24/7/365 monitoring. For the current project, the samples were stored at −80°C for 4–7 years, then thawed once, when aliquoted for shipment to the Van Andel Institute on dry ice for analysis.
Preparation of Plasma and CSF Samples for UPLC Analysis
Plasma samples were mixed with internal standard diluent and centrifuged. The supernatant was removed and dried under reduced pressure conditions by Savant Speedvac SPD131DDA (Thermo Fisher Scientific, Waltham, MA). Samples were resuspended in 0.6% formic acid in Milli‐Q water, centrifuged through a COSTAR Spin‐X 0.22‐μm filter tube and transferred to an amber vial (Agilent) containing a glass insert. CSF samples were combined 1:2 with a solution containing 500 nM 2H4‐KYN, 2H5‐KA, 2H4‐picolinic acid (PIC), 13C6‐nicotinamide (NTA), 2H3‐QUIN, 13C2.15N‐3HK, 2H3‐3HAA (5000 nM 2H3‐TRP) 1.2% formic acid in Milli‐Q water, vortexed and centrifuged through a COSTAR Spin‐X 0.22‐μm filter tube, and transferred to an amber vial (Agilent) containing a glass insert.
Quantification of Kynurenine Metabolites
Kynurenine pathway metabolites (KYN, KYNA, 3‐HK, 3‐HAA, QUIN, PIC, NTA), tryptophan, and serotonin (see Fig. 1) were quantified from plasma and CSF using a Waters Acquity ultra‐high‐performance liquid chromatography (UPLC) I class and Xevo triple‐quadrupole mass spectrometry system. Ten‐microliter samples were injected into an Acquity HSS T3 column conjugated with a Vanguard HSS T3 guard column and eluted using a mobile phase, 0.6% formic acid in Milli‐Q water (Sslvent A), and 0.6% formic acid in analytical‐grade methanol (solvent B), at an isocratic flow rate of 0.3 mL/min for plasma samples and 0.4 mL/min for CSF samples. Intra‐assay coefficients of variability (CV) for plasma analytes were: TRP, 4.7%; KYN, 3.7%; KYNA, 4.7%; 3‐HK, 2.5%; 3‐HAA, 6.1%; QUIN, 2.6%; PIC, 4.1%; NTA, 6.0%; and 5‐HT, 5.5%. Intra‐assay CVs for CSF analytes were: TRP, 0.8%; KYN, 2.4%; KYNA, 14.6%; 3‐HK, 9.1%; QUIN, 5.0%; PIC, 5.2%; and NTA, 12.9%. Data for CSF PIC was discarded for one control due to technical error. Lower limits of detection (LLOD) in both plasma and CSF were 0.05 nM for all metabolites except TRP, which was 5 nM.
Quantification of Inflammatory Factors
C‐reactive protein (CRP) and serum amyloid alpha (SAA) levels were analyzed on a Meso Scale Discovery Sector 6000 imager, according to the manufacturer's instructions (Meso Scale Diagnostics LLC, Rockville, MD). All samples were run in duplicate, and the average value of each sample was used for statistical analysis. Intra‐assay CVs for the analytes measured in plasma were: CRP, 5.2%; and SAA, 4.2%. Intra‐assay CVs for the analytes measured in CSF were: CRP, 4.2%; and SAA, 3.9%. Lower limit of quantification (LLOQ) for analytes measured in plasma were: CRP, 1.68 pg/mL; and SAA, 8.98 pg/mL. LLOQ for analytes measured in CSF were: CRP, 2.25 pg/mL; and SAA, 13.80 pg/mL.
MRI Acquisition and Analysis
As part of the NINDS PDBP at Penn State, T1‐weighted, T2‐weighted, and multigradient‐echo magnetic resonance images were acquired on a 3T Siemens scanner for each subject. Detailed scan parameters are described in a previous study. 19 Mean R2* values from the substantia nigra pars compacta (including both sides) were calculated for individual subjects. For the purposes of this study, R2* values that were generated previously were used for correlation analysis with the kynurenine pathway metabolites.
Statistical Analyses
Statistical analyses were performed using IBM's Statistical Package for the Social Sciences (SPSS v.25). Comparisons of demographic variables were made using Student t tests for continuous variables and chi‐square tests for categorical variables. Group‐wise comparisons between PD subjects and controls were performed using the Mann‐Whitney U test on the raw data, visualized in Figure 2. Biomarkers were transformed by the natural logarithm to enable adjustment for sex and age, and the association with clinical and imaging metrics was analyzed using Pearson's correlation. The age‐ and sex‐adjusted Z scores were generated from linear regression models. As exploratory outcomes, we determined the relationship between plasma and CSF kynurenine metabolites and inflammatory markers, as well as between plasma and CSF biomarkers and disease duration, by Pearson's correlation using the age‐ and sex‐adjusted Z scores. To correct for multiple comparisons, significance was determined using a false discovery rate (FDR) at 10% as described by Benjamini‐Hochberg. 20 This rate was selected a priori to improve our probability of detecting true differences in the exploratory analyses, understanding that ~10% of them will still be false‐positives. Future research will help to clarify which, if any, of these identified markers was a false discovery, but for now yields a comprehensive set of screened markers to focus on in subsequent studies. Both original and FDR‐adjusted P values are presented in Supplemental Tables 3 and 4. For visualization, Z scores are plotted in Figures 3, 4, 5.
FIG. 2.
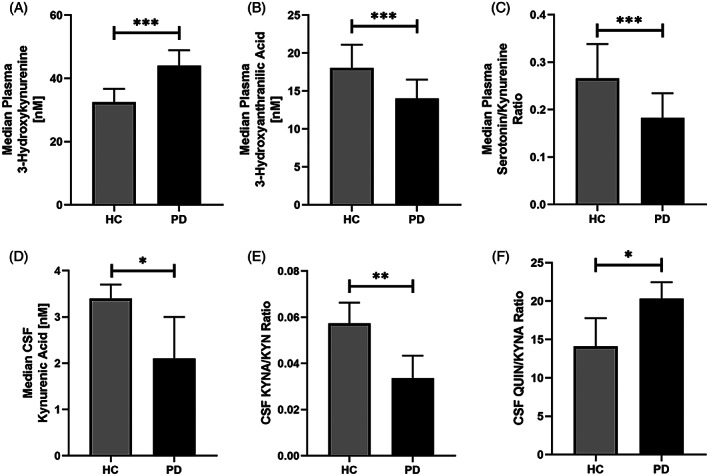
Comparison of kynurenine metabolite levels in HC and PD subjects. Median plasma levels of 3‐hydroxykynurenine (A), 3‐hydroxyanthranilic acid (B), serotonin/kynurenine ratio (C), and CSF kynurenic acid levels (D), kynurenic acid/kynurenine ratio (E), and quinolinic acid/kynurenic acid ratio (F) in healthy controls (n = 89) and Parkinson's disease subjects (n = 97). Error bars represent 95% confidence interval of the median. Significance was determined using the Mann‐Whitney U test. ***P < 0.001, **P < 0.005, *P < 0.05.
FIG. 3.

Kynurenine metabolite correlations with UPDRS scores. Scatterplot correlations between (A) plasma 3‐hydroxykynurenine (3‐HK) levels and Unified Parkinson's Disease Rating Scale (UPDRS) I scores, (B) plasma 3‐HK and UPDRS II scores, (C) CSF quinolinic acid (QUIN) levels and UPDRS II scores, (D) CSF QUIN levels and UPDRS III scores, (E) CSF QUIN/KYNA ratio and UPDRS scores, and (F) CSF kynurenic acid (KYNA) levels and UPSIT scores in PD subjects (n = 25). The plotted Pearson correlation coefficients and P values derive from the PD cohort after adjusting for age and sex. Filled circles represent patients, and stars denote healthy control data points. Dashed lines indicate the 95% confidence interval for the line of best fit.
FIG. 4.
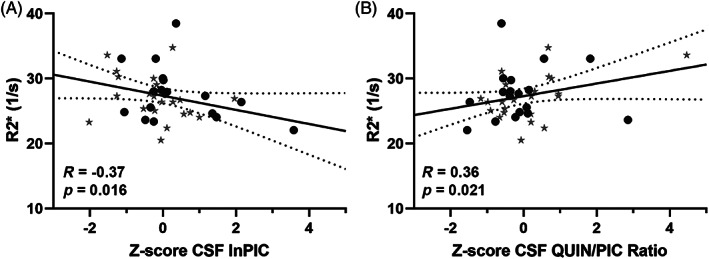
Correlation of R2* values with CSF kynurenine metabolites. Scatterplot correlations between (A) CSF picolinic acid (PIC) levels and (B) CSF QUIN/PIC ratios and R2* values in the substantia nigra pars compacta. Data from controls are plotted as stars and from patients as filled circles. Pearson correlation coefficients and P values are from partial correlation analysis performed after adjusting for age and sex on the entire data set (n = 41). Dashed lines indicate the 95% confidence interval for the line of best fit.
FIG. 5.
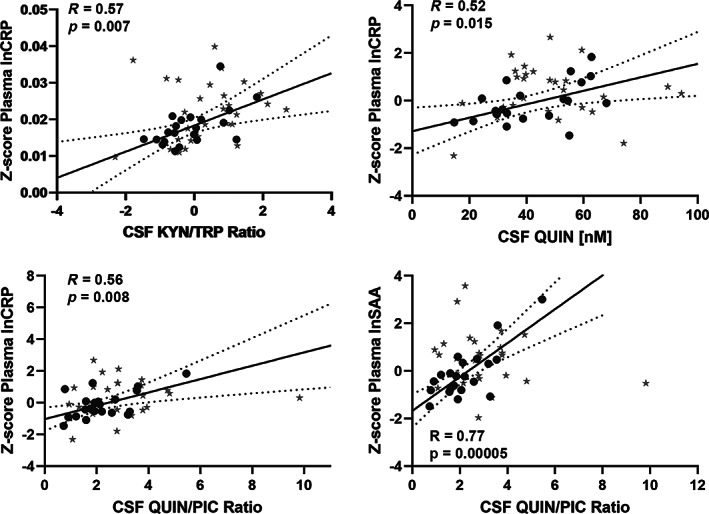
Correlation of peripheral inflammatory markers and CSF kynurenine metabolites in PD patients. Scatterplot correlations between (A) plasma C‐reactive protein (CRP) levels and CSF quinolinic acid (QUIN) levels, (B) plasma CRP levels and CSF kynurenine/tryptophan (KYN/TRP) ratio, (C) plasma CRP levels and CSF QUIN/PIC ratio, (D) plasma serum amyloid alpha (SAA) levels and CSF QUIN/PIC ratio in PD subjects (n = 25). Data from healthy controls are represented by stars and patients by filled circles. The plotted Pearson correlation coefficients and P values after adjusting for age and sex, are for the patient cohort analyzed separately. Dashed lines indicate the 95% confidence interval for the line of best fit.
Standard Protocol Approvals, Registrations, and Patient Consents
All participants gave written informed consent in accordance with the Declaration of Helsinki. The study was approved by the Pennsylvania State University Hershey Institutional Review Board and the Van Andel Institute Review Board.
Data Availability
All data generated or analyzed during this study are included in this published article.
Results
Demographics
The demographics of the plasma cohort are described in Supplemental Table 1. Subjects and controls did not differ in respect to age (66.9 vs 66.6 years), body mass index (27.5 vs 28.1 kg/m2), years of education (15 vs 15 years), or sex (49% women vs 53% women). As expected, PD subjects had significantly higher UPDRS I–III scores, lower MoCA and UPSIT scores, and higher R2* values compared with controls (Supplemental Table 1).
Plasma Kynurenine Pathway Metabolites Are Changed in PD
PD subjects had significantly higher plasma levels of 3‐HK compared with controls (n = 185, P = 0.000005; Fig. 2A) and lower levels of the subsequent metabolite in the pathway, 3‐HAA (P = 0.008; Fig. 2B), as well as lower NTA (P = 0.05), an end product of the kynurenine pathway. There were no significant differences in the absolute plasma levels of TRP, KYN, KYNA, QUIN, or PIC between PD and control subjects (data shown in Supplemental Table 2). PD subjects also displayed a lower 5‐HT/KYN ratio (P = 0.001; Fig. 2C).
CSF Metabolites Are Altered in PD Versus Controls
PD subjects had significantly lower levels of the neuroprotective metabolite KYNA in the CSF compared with controls (n = 55, P = 0.029; Fig. 2D). Furthermore, the KYNA/KYN ratio was lower in PD (P = 0.002; Fig. 2E), indicating a reduced formation of KYNA from KYN and instead a shift toward an increased neurotoxic ratio, QUIN/KYNA (P = 0.046; Fig. 2F). There were no differences in the absolute CSF levels of TRP, KYN, 3‐HK, QUIN, PIC, or NTA between PD and controls (Supplemental Table 2).
Association Between Plasma Analytes and Symptom Severity
We assessed the capacity of peripheral levels of 3‐HK and 3‐HAA to reflect symptom severity by establishing the association between the age‐ and sex‐adjusted variables with UPDRS I–III symptom severity. Plasma 3‐HK was significantly associated with UPDRS I (R = 0.28, P = 0.005; Fig. 3A), UPDRS II (R = 0.33, P = 0.001; Fig. 3B), and UPDRS III (R = 0.24, P = 0.02) in patients (n = 97). The 3‐HK was not associated with symptoms within the controls. The 3‐HAA was not linked to any symptoms in patients or controls.
Association Between CSF Analytes and Symptom Severity
We next assessed the association between age‐ and sex‐adjusted CSF levels of kynurenines and symptoms. In PD patients (n = 25), higher CSF levels of QUIN were significantly associated with higher total UPDRS II (motor aspects of daily living [ADLs]) and UPDRS III (motor examination) scores (R = 0.48, P = 0.015; Fig. 3C; and R = 0.46, P = 0.021; Fig. 3D, respectively). Increased activation of the first step of the pathway, the KYN/TRP ratio, was also associated with higher ADL and motor scores (UPDRS II: R = 0.41, P = 0.042; UPDRS III: R = 0.40, P = 0.05). Higher scores on these scales indicate more severe symptoms.
The QUIN/PIC (R = 0.66, P = 0.0003) and QUIN/3‐HK (R = 0.52, P = 0.008) ratios were both strongly associated with increasing severity of ADL symptoms in the PD subjects (UPDRS II total score). The QUIN/KYNA ratio (R = 0.43, P = 0.034; Fig. 3E), often denoted the neurotoxic ratio, 21 was linked to higher scores on the nonmotor aspects of activities of daily living symptoms (UPDRS I total score). None of these correlations were present in the controls (data for patients and controls shown in Fig. 3).
Higher CSF levels of KYNA were associated with higher UPSIT scores. Higher scores on this scale indicate better olfaction, which thus correlated with high levels of the neuroprotective KYNA (R = 0.49, P = 0.013; Fig. 3F). The correlation was not detected in controls.
Kynurenine Metabolites and R2* in the Substantia Nigra
We have previously shown that elevated R2* in the substantia nigra pars compacta, reflecting iron content, is associated with PD progression 19 and related pathological processes 22 in our cohort. In the entire cohort (n = 41), there was a correlation between lower levels of the iron chelator PIC and higher R2* in the substantia nigra pars compacta (R = −0.37, P = 0.016; Fig. 4A). Similarly, an increasing QUIN/PIC ratio was associated with higher R2* (R = 0.36, P = 0.021; Fig. 4B). When separated into controls and patients, the data were significant only in the 23 controls (PIC R = −0.47, P = 0.023; and QUIN/PIC R = 0.55, P = 0.006).
Changes of Inflammatory Markers in PD Plasma and CSF
Median levels of the acute‐phase proteins were lower in both CSF and plasma of the PD patients compared with controls (Supplemental Table 2). CRP was significantly lower in the plasma (P = 0.001), and there was a trend toward lower SAA in both the CSF (P = 0.07) and plasma (P = 0.08) of PD patients (Supplemental Table 2).
Because inflammation is known to activate the kynurenine pathway, we examined the association between inflammatory markers in plasma with the kynurenine metabolites in the CSF of PD subjects (n = 25) and controls (n = 30); see Supplemental Table 3. In the PD patients, we found that plasma CRP and SAA were associated with the CSF KYN/TRP ratio (R = 0.57, P = 0.007; Fig. 5A; and R = 0.52, P = 0.016; respectively), suggesting a potential connection between peripheral inflammation and central tryptophan metabolism in PD subjects. Higher plasma CRP and SAA were also linked with higher CSF QUIN (R = 0.52, P = 0.015; Fig. 5B; and R = 0.50, P = 0.02, respectively) and with the QUIN/PIC ratio (R = 0.56, P = 0.008; Fig. 5C; and R = 0.77, P = 0.00005; Fig. 5D, respectively). In contrast, there were no associations between plasma levels of inflammatory markers and kynurenine metabolites in the CSF of controls (Supplemental Table 3). Plasma and CSF CRP and SAA were closely associated across the blood–brain barrier in both patients and controls (patients: CRP in plasma vs CSF, R = 0.90, P = 0.000005; SAA in plasma vs CSF, R = 0.82, P = 0.000002).
Association of Biomarkers With Disease Duration
We investigated the association between PD disease duration and the biomarkers, adjusted for sex and age. Plasma 3‐HK (R = 0.33, P = 0.001) as well as the CSF levels of the acute‐phase proteins SAA (R = 0.71, P = 0.000075) and CRP (R = 0.51, P = 0.01) correlated with disease duration. Adjusting for sex only did not alter these results (not shown). The correlation with disease duration is presented in full in Supplemental Table 4.
Discussion
We found that the metabolite patterns in both CSF and plasma from PD patients were consistent with inflammatory activation of the kynurenine pathway. Specifically, PD subjects had higher amounts of the neurotoxic metabolite 3‐HK in plasma and an increased QUIN/KYNA ratio in the CSF compared with controls. The acute‐phase proteins CRP and SAA were associated with the induction of the pathway (KYN/TRP ratio) and QUIN levels in the CSF. Higher levels of neurotoxic kynurenine metabolites in both plasma and CSF correlated with more severe symptoms. Together, these data suggest that kynurenine metabolites may serve as novel biomarkers and/or are involved in the PD pathological process.
We observed higher plasma 3‐HK in PD subjects, in line with a recent study that found elevated 3‐HK in a small group of PD subjects with dyskinesias (n = 12). 12 The majority of patients in our study were free from dyskinesias, suggesting that elevated plasma 3‐HK is not a feature exclusively of PD subjects with dyskinesias. We also found that plasma 3‐HK was associated with disease duration and symptom severity on UPDRS I–III, suggesting that 3‐HK might serve as a peripheral biomarker for PD severity and/or progression. This finding is also interesting in the context of PD pathogenetic mechanisms because 3‐HK has neurotoxic properties and induces mitochondrial dysfunction and oxidative stress. 23 , 24 , 25 , 26 We also found lower 3‐HAA, a downstream product of 3‐HK in the kynurenine pathway. This suggests that the accumulation of 3‐HK could result from reduced activity of kynureninase, the enzyme that converts 3‐HK to 3‐HAA. In spite of the changes in peripheral 3‐HK, we did not find any alterations in 3‐HK in CSF. This could indicate that the peripheral and central compartments differ in 3‐HK production and metabolism, or be because the number of CSF samples was smaller in our study.
In PD CSF samples, we detected a reduction of the neuroprotective metabolite KYNA. 27 , 28 This result is consistent with earlier smaller studies showing reduced plasma and CSF KYNA 14 , 29 and brain‐region‐specific reductions in KYNA in postmortem PD brain tissue. 30 Because we also observed an increased QUIN/KYNA ratio in the CSF of PD subjects, the reduced KYNA could result from an increased metabolic flux through the QUIN‐producing branch of the kynurenine pathway. This shift in enzymatic activity at the expense of KYNA and serotonin (5‐HT) is known to occur during inflammatory and infectious conditions. 31 , 32 Although 5‐HT is produced from tryptophan, it is not a kynurenine pathway metabolite (Fig. 1). Consistent with the idea of shifting enzymatic activities between the serotonin‐kynurenine pathway, our patients also had a lower 5‐HT/KYN ratio in plasma compared with controls.
We did not observe elevated levels of acute‐phase proteins in PD, but CSF CRP and SAA levels correlated with disease duration, even when correcting for age, suggesting that inflammation is associated with disease progression. In addition, the acute‐phase reactants correlated closely between plasma and CSF in both PD patients and controls. This is interesting because the communication of the acute‐phase reactants across the blood–brain barrier is still poorly understood. Intriguingly, only in PD patients did the acute‐phase proteins correlate with the CSF QUIN, QUIN/PIC, and KYN/TRP ratios, suggesting a disease‐specific kynurenine pathway activation. The mechanism underlying this is unclear, and we speculate that the kynurenine pathway is more sensitive to activation by inflammation in PD.
Our study is the first to describe an association between CSF kynurenine metabolites and PD motor and nonmotor symptoms. We and others previously reported that subjects with depression and suicidality exhibit inflammation and increased QUIN/KYNA ratios. 31 , 32 , 33 , 34 Up to 90% of PD subjects exhibit depression or anxiety, and further studies are needed to investigate whether inflammation and kynurenine metabolites are directly involved in the specific psychiatric symptoms of PD. 35 , 36 Furthermore, our study is the first to explore the potential relationship between kynurenine metabolites in CSF and the neuroimaging metric R2*. In PD, R2* was elevated in the substantia nigra, reflecting elevated iron content. 19 , 22 When examining both PD and control subjects together, we found that the R2* values in the substantia nigra pars compacta correlated with higher CSF QUIN/PIC ratios. The QUIN/PIC ratio is regulated by the enzyme ACMSD generating PIC (at the expense of QUIN), which is a well‐known iron chelator, and therefore reduced ACMSD activity could contribute to the iron accumulation in the substantia nigra. 37
The strengths of our study include a clinically well‐characterized cohort, measures of kynurenine metabolites and inflammatory markers in both plasma and CSF, and imaging data from the substantia nigra. As a limitation, this cross‐sectional study was associative, and therefore causality could not be demonstrated. In addition, the PD subjects were on medication and were evaluated in the ON state, as defined per the PDBP study protocol. Therefore, we could not rule out that the observed effects were impacted by medication. Finally, because of the number of analyses performed, there is always a risk of reporting spurious results. Thus, replication in an independent cohort is necessary, as well as studies of kynurenine metabolites in medication‐free subjects with early PD or in the defined OFF state.
In summary, we found evidence of an inflammation‐associated activation of the kynurenine pathway in both plasma and CSF in PD patients. We observed altered absolute levels of 3‐HK, 3‐HAA, and KYNA in PD, together with changes in several neurotoxic/neuroprotective ratios, indicating that tryptophan metabolism is disrupted in PD. In addition, we found that plasma and CSF levels of kynurenine metabolites were closely associated with worsening of symptoms in PD. Further replication studies are warranted, and these can also explore if kynurenine metabolites can serve as novel biomarkers and/or are involved in PD pathogenesis, which might lead to the identification of novel therapeutic targets.
Supporting information
SUPPLEMENTAL TABLE 1 Subject demographics.
MoCA, Montreal Cognitive Assessment; UPSIT, University of Pennsylvania Smell Identification Test; R2*, relaxation rates in the substantia nigra pars compacta; N/A; not available.
All values are reported as mean ± SD.1
aStudent t test.
bChi‐square test.
cANCOVA, with age and sex as covariates.
SUPPLEMENTAL TABLE 2 Median levels of metabolites and inflammatory markers. All values are reported as Median (IQR).
aMann‐Whitney U test.
SUPPLEMENTAL TABLE 3 Correlations over the blood–brain barrier (BBB)
Pearson correlation coefficients and P values after adjusting for sex and age.
FDR‐adjusted P values are listed in separate columns.
SUPPLEMENTAL TABLE 4 Correlation of biological analytes with disease duration in years. Pearson correlation coefficients and P values after adjusting for sex and age. FDR‐adjusted P values are listed in separate columns.
Acknowledgments
We thank all the participants in this study for volunteering to provide biofluid samples and undergo MRI analysis, as well as clinical assessments. We acknowledge the RTSF Mass Spectrometry and Metabolomics Core at Michigan State University (Dr. Tony Schmiller, Dr. Dan Jones, and Lijun Chen) for their expertise and assistance with measuring kynurenine metabolites.
Appendix 1 1.
| Name | Location | Role | Contribution |
|---|---|---|---|
| Patrick L. Heilman, PhD | Van Andel Institute, Center For Neurodegenerative Sciences, Grand Rapids, MI | Author | Data collection, data analysis, drafting of the initial article |
| Ernest W. Wang | Penn State University, Milton S. Hershey Medical Center, Hershey, PA | Author | Data analysis, review of statistical analysis, critical review of the article |
| Mechelle M. Lewis, PhD | Penn State University, Milton S. Hershey Medical Center, Hershey, PA | Author | Study concept and design, clinical data collection, clinical data analysis, review of statistical analysis, critical review of the article |
| Stanislaw Krzyzanowski | Van Andel Institute, Center For Neurodegenerative Sciences, Grand Rapids, MI | Author | Data collection, data analysis, critical revision of the article |
| Colt D. Capan | Van Andel Institute, Center For Neurodegenerative Sciences, Grand Rapids, MI | Author | Data analysis, critical revision of the article |
|
Amanda R. Burmeister, PhD |
Van Andel Institute, Center For Neurodegenerative Sciences, Grand Rapids, MI | Author | Critical revisions of the manuscript, including statistical calculations. |
| Guangwei Du, MD, PhD | Penn State University, Milton S. Hershey Medical Center, Hershey, PA | Author | Study concept and design, development of MRI methodology, MRI data analysis, critical revision of the article |
| Martha L. Escobar Galvis, PhD | Van Andel Institute, Center For Neurodegenerative Sciences, Grand Rapids, MI | Author | Study concept and design, critical revision of the article |
| Patrik Brundin, MD, PhD | Van Andel Institute, Center For Neurodegenerative Sciences, Grand Rapids, MI | Author | Study concept and design, critical revision of the article |
| Xuemei Huang, MD, PhD | Penn State University, Milton S. Hershey Medical Center, Hershey, PA | Author | Study concept and design, clinical examination of patients, data analysis, critical revision of the article, obtaining funding |
| Lena Brundin, MD, PhD | Van Andel Institute, Center For Neurodegenerative Sciences, Grand Rapids, MI | Author | Study concept and design, data analysis, review of statistical analysis, drafting the initial manuscript, obtaining funding |
Relevant conflicts of interest/financial disclosures: Dr. Lena Brundin has received funding from the National Institute of Mental Health, the United States Department of Veterans Affairs, and the Michael J. Fox Foundation for Parkinson's Research. Dr. Huang and Dr. Lewis have received funding from the National Institutes of Health (R01 ES019672, U01 NS082151, U01 NS112008), the Michael J. Fox Foundation, Alzheimer's Association, Alzheimer's Research UK, the Weston Brain Institute, Bristol Myers Squibb/Biogen, Pfizer, and the Department of Defense. Dr. Huang and Dr. Lewis also have a patent covering the use of novel imaging metrics to diagnose PD and monitor its progression. Dr. Du received funding from the National Institutes of Health (R01 ES019672, U01 NS082151, U01 NS112008), the Michael J. Fox Foundation for Parkinson's Research, Alzheimer's Association, Alzheimer's Research UK, and the Weston Brain Institute. Dr. Du also has a patent covering the use of novel imaging metrics to diagnose PD and monitor its progression. Dr. Patrik Brundin has received funding from the National Institutes of Health, the MJ Fox Foundation, the US Department of Defense, as well as commercial support as a consultant from Axial Biotherapeutics, CuraSen, Fujifilm‐Cellular Dynamics International, IOS Press Partners, Lundbeck A/S, and Living Cell Technologies LTD. He has received commercial support for research from Lundbeck A/S and Roche. He has ownership interests in Acousort AB and Axial Biotherapeutics and is on the steering committee of the NILO‐PD trial. Mr. Wang received funding from the National Institutes of Health (1 F30 ES030607 01). Dr. Burmeister, Dr. Escobar Galvis, Dr. Heilman, Mr. Capan. and Mr. Krzyzanowski have no conflicts of interest to disclose.
Funding agencies: Supported by the Michael J. Fox Foundation (14939); L. Brundin and X. Huang (co‐PIs).
Contributor Information
Xuemei Huang, Email: xuemei@psu.edu.
Lena Brundin, Email: lena.brundin@vai.org.
References
- 1. Chitnis T, Weiner HL. CNS inflammation and neurodegeneration. J Clin Invest 2017;127:3577–3587. [DOI] [PMC free article] [PubMed] [Google Scholar]
- 2. Tufekci KU, Meuwissen R, Genc S, Genc K. Inflammation in Parkinson's disease. Adv Protein Chem Struct Biol 2012;88:69–132. [DOI] [PubMed] [Google Scholar]
- 3. Moffett JR, Namboodiri MA. Tryptophan and the immune response. Immunol Cell Biol 2003;81:247–265. [DOI] [PubMed] [Google Scholar]
- 4. Schwarcz R, Bruno JP, Muchowski PJ, Wu H‐Q. Kynurenines in the mammalian brain: when physiology meets pathology. Nat Rev Neurosci 2012;13:465–477. [DOI] [PMC free article] [PubMed] [Google Scholar]
- 5. Guillemin GJ. Quinolinic acid, the inescapable neurotoxin. FEBS J 2012;279:1356–1365. [DOI] [PubMed] [Google Scholar]
- 6. Stone TW. Endogenous neurotoxins from tryptophan. Toxicon 2001;39:61–73. [DOI] [PubMed] [Google Scholar]
- 7. Lim CK, Fernandez‐Gomez FJ, Braidy N, et al. Involvement of the kynurenine pathway in the pathogenesis of Parkinson's disease. Prog Neurobiol 2017;155:76–95. [DOI] [PubMed] [Google Scholar]
- 8. Nalls MA, Plagnol V, Hernandez DG, et al. Imputation of sequence variants for identification of genetic risks for Parkinson's disease: a meta‐analysis of genome‐wide association studies. Lancet 2011;377:641–649. [DOI] [PMC free article] [PubMed] [Google Scholar]
- 9. Nalls MA, Pankratz N, Lill CM, et al. Large‐scale meta‐analysis of genome‐wide association data identifies six new risk loci for Parkinson's disease. Nat Genet 2014;46:989–993. [DOI] [PMC free article] [PubMed] [Google Scholar]
- 10. Vilas D, Fernandez‐Santiago R, Sanchez E, et al. A novel p.Glu298Lys mutation in the ACMSD gene in sporadic Parkinson's disease. J Parkinsons Dis 2017;7:459–463. [DOI] [PubMed] [Google Scholar]
- 11. Martí‐Massó JF, Bergareche A, Makarov V, et al. The ACMSD gene, involved in tryptophan metabolism, is mutated in a family with cortical myoclonus, epilepsy, and parkinsonism. J Mol Med 2013;91:1399–1406. [DOI] [PMC free article] [PubMed] [Google Scholar]
- 12. Havelund JF, Andersen AD, Binzer M, et al. Changes in kynurenine pathway metabolism in Parkinson patients with L‐DOPA‐induced dyskinesia. J Neurochem 2017;142:756–766. [DOI] [PubMed] [Google Scholar]
- 13. Widner B, Leblhuber F, Fuchs D. Increased neopterin production and tryptophan degradation in advanced Parkinson's disease. J Neural Transm 2002;109:181–189. [DOI] [PubMed] [Google Scholar]
- 14. Chang K‐H, Cheng M‐L, Tang H‐Y, Huang C‐Y, Wu Y‐R, Chen C‐M. Alternations of metabolic profile and kynurenine metabolism in the plasma of Parkinson's disease. Mol Neurobiol 2018;55:6319–6328. [DOI] [PubMed] [Google Scholar]
- 15. Hughes AJ, Daniel SE, Lees AJ. Improved accuracy of clinical diagnosis of Lewy body Parkinson's disease. Neurology 2001;57:1497–1499. [DOI] [PubMed] [Google Scholar]
- 16. Hughes AJ, Daniel SE, Kilford L, Lees AJ. Accuracy of clinical diagnosis of idiopathic Parkinson's disease: a clinico‐pathological study of 100 cases. J Neurol Neurosurg Psychiatry 1992;55:181–184. [DOI] [PMC free article] [PubMed] [Google Scholar]
- 17. Nasreddine ZS, Phillips NA, Bedirian V, et al. The Montreal Cognitive Assessment, MoCA: a brief screening tool for mild cognitive impairment. J Am Geriatr Soc 2005;53:695–699. [DOI] [PubMed] [Google Scholar]
- 18. Doty RL, Shaman P, Dann M. Development of the University of Pennsylvania Smell Identification Test: a standardized microencapsulated test of olfactory function. Physiol Behav 1984;32:489–502. [DOI] [PubMed] [Google Scholar]
- 19. Du G, Lewis MM, Sica C, et al. Distinct progression pattern of susceptibility MRI in the substantia nigra of Parkinson's patients. Mov Disord 2018;33:1423–1431. [DOI] [PMC free article] [PubMed] [Google Scholar]
- 20. Benjamini Y, Hochberg Y. Controlling the False Discovery Rate: a practical and powerful approach to multiple testing. J R Stat Soc Ser B 1995;57:289–300. [Google Scholar]
- 21. Stone TW. Neuropharmacology of quinolinic and kynurenic acids. Pharmacol Rev 1993;45:309–379. [PubMed] [Google Scholar]
- 22. Lewis MM, Du G, Baccon J, et al. Susceptibility MRI captures nigral pathology in patients with parkinsonian syndromes. Mov Disord 2018;33:1432–1439. [DOI] [PMC free article] [PubMed] [Google Scholar]
- 23. Okuda S, Nishiyama N, Saito H, Katsuki H. Hydrogen peroxide‐mediated neuronal cell death induced by an endogenous neurotoxin, 3‐hydroxykynurenine. Proc Natl Acad Sci 1996;93:12553–12558. [DOI] [PMC free article] [PubMed] [Google Scholar]
- 24. Dias V, Junn E, Mouradian MM. The role of oxidative stress in Parkinson's disease. J Parkinsons Dis 2013;3:461–491. [DOI] [PMC free article] [PubMed] [Google Scholar]
- 25. Reyes Ocampo J, Lugo Huitrón R, González‐Esquivel D, et al. Kynurenines with neuroactive and redox properties: relevance to aging and brain diseases. Oxid Med Cell Longev 2014;2014:646909. [DOI] [PMC free article] [PubMed] [Google Scholar]
- 26. Guidetti P, Schwarcz R. 3‐Hydroxykynurenine potentiates quinolinate but not NMDA toxicity in the rat striatum. Eur J Neurosci 1999;11:3857–3863. [DOI] [PubMed] [Google Scholar]
- 27. Lee DY, Lee K‐S, Lee HJ, et al. Kynurenic acid attenuates MPP(+)‐induced dopaminergic neuronal cell death via a Bax‐mediated mitochondrial pathway. Eur J Cell Biol 2008;87:389–397. [DOI] [PubMed] [Google Scholar]
- 28. Urenjak J, Obrenovitch TP. Neuroprotective potency of kynurenic acid against excitotoxicity. Neuroreport 2000;11:1341–1344. [DOI] [PubMed] [Google Scholar]
- 29. Sorgdrager FJH, Vermeiren Y, Van Faassen M, et al. Age‐ and disease‐specific changes of the kynurenine pathway in Parkinson's and Alzheimer's disease. J Neurochem 2019;151:656–668. [DOI] [PMC free article] [PubMed] [Google Scholar]
- 30. Ogawa T, Matson WR, Beal MF, et al. Kynurenine pathway abnormalities in Parkinson's disease. Neurology 1992;42:1702– 1706. [DOI] [PubMed] [Google Scholar]
- 31. Bay‐Richter C, Linderholm KR, Lim CK, et al. A role for inflammatory metabolites as modulators of the glutamate N‐methyl‐D‐aspartate receptor in depression and suicidality. Brain Behav Immun 2015;43:110–117. [DOI] [PubMed] [Google Scholar]
- 32. Wurfel BE, Drevets WC, Bliss SA, et al. Serum kynurenic acid is reduced in affective psychosis. Transl Psychiatry 2017;7:e1115. [DOI] [PMC free article] [PubMed] [Google Scholar]
- 33. Dong X, Wang Y, Qin Z. Molecular mechanisms of excitotoxicity and their relevance to pathogenesis of neurodegenerative diseases. Acta Pharmacol Sin 2009;30:379–387. [DOI] [PMC free article] [PubMed] [Google Scholar]
- 34. Erhardt S, Lim CK, Linderholm KR, et al. Connecting inflammation with glutamate agonism in suicidality. Neuropsychopharmacology 2013;38:743–752. [DOI] [PMC free article] [PubMed] [Google Scholar]
- 35. Reijnders JSAM, Ehrt U, Weber WEJ, Aarsland D, Leentjens AFG. A systematic review of prevalence studies of depression in Parkinson's disease. Mov Disord 2008;23:183–189. [DOI] [PubMed] [Google Scholar]
- 36. Goodarzi Z, Mrklas KJ, Roberts DJ, Jette N, Pringsheim T, Holroyd‐Leduc J. Detecting depression in Parkinson disease: a systematic review and meta‐analysis. Neurology 2016;87:426–437. [DOI] [PMC free article] [PubMed] [Google Scholar]
- 37. Grant RS, Coggan SE, Smythe GA. The physiological action of picolinic acid in the human brain. Int J Tryptophan Res 2009;2:71–79. [DOI] [PMC free article] [PubMed] [Google Scholar]
Associated Data
This section collects any data citations, data availability statements, or supplementary materials included in this article.
Supplementary Materials
SUPPLEMENTAL TABLE 1 Subject demographics.
MoCA, Montreal Cognitive Assessment; UPSIT, University of Pennsylvania Smell Identification Test; R2*, relaxation rates in the substantia nigra pars compacta; N/A; not available.
All values are reported as mean ± SD.1
aStudent t test.
bChi‐square test.
cANCOVA, with age and sex as covariates.
SUPPLEMENTAL TABLE 2 Median levels of metabolites and inflammatory markers. All values are reported as Median (IQR).
aMann‐Whitney U test.
SUPPLEMENTAL TABLE 3 Correlations over the blood–brain barrier (BBB)
Pearson correlation coefficients and P values after adjusting for sex and age.
FDR‐adjusted P values are listed in separate columns.
SUPPLEMENTAL TABLE 4 Correlation of biological analytes with disease duration in years. Pearson correlation coefficients and P values after adjusting for sex and age. FDR‐adjusted P values are listed in separate columns.
Data Availability Statement
All data generated or analyzed during this study are included in this published article.