

Summary
Clarifying the coordination of leaf hydraulic traits with gas exchange across closely‐related species adapted to varying rainfall can provide insights into plant habitat distribution and drought adaptation.
The leaf hydraulic conductance (K leaf), stomatal conductance (g s), net assimilation (A), vein embolism and abscisic acid (ABA) concentration during dehydration were quantified, as well as pressure–volume curve traits and vein anatomy in 10 Caragana species adapted to a range of mean annual precipitation (MAP) conditions and growing in a common garden.
We found a positive correlation between Ψleaf at 50% loss of K leaf (K leaf P 50) and maximum K leaf (K leaf‐max) across species. Species from low‐MAP environments exhibited more negative K leaf P 50 and turgor loss point, and higher K leaf‐max and leaf‐specific capacity at full turgor, along with higher vein density and midrib xylem per leaf area, and a higher ratio of K leaf‐max : maximum g s. Tighter stomatal control mediated by higher ABA accumulation during dehydration in these species resulted in an increase in hydraulic safety and intrinsic water use efficiency (WUEi) during drought.
Our results suggest that high hydraulic safety and efficiency combined with greater stomatal sensitivity triggered by ABA production and leading to greater WUEi provides drought tolerance in Caragana species adapted to low‐MAP environments.
Keywords: abscisic acid (ABA), Caragana species, drought, gas exchange, leaf hydraulics, turgor loss point, vein
Introduction
Leaf hydraulic conductance (K leaf) decreases with soil water potential during drought stress, and/or in response to high evaporative demand due to high vapour pressure deficit (Scoffoni et al., 2012; Baer et al., 2016; Brodribb et al., 2016; Sack et al., 2016; Trifiló et al., 2016; Scoffoni & Sack, 2017). As a result, it has been suggested that decreasing K leaf induces stomatal closure and thus decreases photosynthetic rates, impacting plant growth (Blackman et al., 2009; Scoffoni et al., 2018; Wang et al., 2018; Trueba et al., 2019). Thus, maintaining leaf hydraulic function during soil and/or atmospheric drought can be an important feature which enables a species to thrive, particularly in low mean annual precipitation (MAP) environments (Blackman et al., 2012, 2014; Brodribb et al., 2014; Nardini & Luglio, 2014).
The leaf water potential (Ψleaf) at 50% loss of K leaf (K leaf P 50) has been widely used as an indicator of species resistance to leaf hydraulic decline (Scoffoni & Sack, 2017). However, only three studies, to our knowledge, have investigated the link between K leaf P 50 and climate. Across diverse species in Australian forests, K leaf P 50 was more negative in habitats with low precipitation (or high aridity) (Blackman et al., 2012, 2014). Additionally, a weak though significant positive correlation between K leaf P 50 and MAP was found across a meta‐analysis of 150 diverse species from sclerophyllous, temperate and tropical forests (Nardini & Luglio, 2014). Similarly, such trends have been observed at the stem level, with the water potential at 50% loss of stem hydraulic conductance (K stem P 50) strongly predicting species’ distribution across water availability gradients at local and global scales (Maherali et al., 2004; Choat et al., 2007; Choat et al., 2012). However, no studies to our knowledge have investigated how variation in K leaf vulnerability relates to habitat MAP across closely related species.
Past studies have shown a tradeoff between leaf hydraulic safety (K leaf P 50) and efficiency (maximum leaf hydraulic efficiency, K leaf‐max; Scoffoni et al., 2012; Nardini & Luglio, 2014; Scoffoni & Sack, 2017). Thus, if species from low‐MAP environments in their native habitats have more negative K leaf P 50, this tradeoff implies they would also have lower K leaf‐max. However, some studies have found that species growing in drier and/or warmer climates have a higher K leaf‐max compared to maximum stomatal conductance (g s‐max) to replace water loss and mitigate the greater evaporative loss (Brodribb & Jordan, 2008; Scoffoni et al., 2016, 2015). Therefore, it might be more adaptive for species to display both high hydraulic safety and high hydraulic efficiency in low‐MAP environments. But no study to our knowledge has investigated the coordination across species growing along a precipitation gradient. We hypothesized that species from low‐MAP environments would have more negative K leaf P 50 to tolerate low‐MAP climates, and higher hydraulic supply and, thus, higher ratios of K leaf‐max : g s‐max.
To better understand the association or coordination between traits, it is essential to elucidate the drivers behind physiological level trait diversity. Therefore, we also investigated the anatomical and biochemical determinants behind the trait differences observed across species from low‐ to high‐MAP environments. If species from low‐MAP habitats have more negative K leaf P 50 and higher K leaf‐max as hypothesized, how are they achieving these values? We first tested for a positive correlation between K leaf‐max and major and minor vein length per unit area (VLA), midrib xylem area per leaf area, and leaf‐specific capacitance at full turgor (C*FT). Indeed, studies have shown that an increase in VLA can cause an increase in leaf xylem hydraulic conductance and outside‐xylem hydraulic conductance (Scoffoni et al., 2011; Buckley et al., 2015; Scoffoni & Sack, 2017), that greater midrib xylem conduit sizes are related to high K leaf‐max (Nardini et al., 2012), and that an increase in C*FT contributes to high K leaf‐max (Sack et al., 2003; Xiong & Nadal, 2020). Using the optical method to record spatial and temporal patterns of embolism formation in the veins of dehydrated leaves (Brodribb et al., 2016), we tested whether the decrease observed in K leaf with dehydration was caused by vein xylem embolism (K x), or by changes in outside‐xylem pathways (K ox) (Brodribb et al., 2016; Scoffoni et al., 2017), and/or whether it was linked to turgor loss point (πtlp) (Scoffoni et al., 2014), which has also been shown to be a strong indicator of species tolerance to low‐MAP or arid environments (Bartlett et al., 2012).
To understand the response of stomata to dehydration, we investigated the role of foliar abscisic acid (ABA) accumulated during dehydration on stomatal closure (Brodribb & McAdam, 2013), and whether the difference in rates of ABA synthesis during dehydration across species could lead to differential hysteresis in stomatal closure (Seo & Koshiba, 2002; Lovisolo et al., 2008; Brodribb & McAdam, 2013; McAdam & Brodribb, 2015). Furthermore, if ABA synthesis causes early stomatal closure during dehydration, this could lead to increasing leaf intrinsic water use efficiency (net carbon assimilation/stomatal conductance, WUEi) (Negin & Moshelion, 2016).
Comparing hydraulic characteristics across distantly related species versus closely‐related species can give different, even strongly opposing, conclusions; therefore, to establish a true association of responses, tests must be made using closely‐related plants in well‐resolved lineages (Gleason et al., 2016; Scoffoni et al., 2016). In addition, common garden experiments, which maximally reduce trait plasticity, are useful in exposing genetic variation (Scoffoni et al., 2016; Jankowski et al., 2019; Ignazia et al., 2020). Therefore, in order to establish associations between leaf hydraulic traits and gas exchange, we investigated the hydraulic safety–efficiency trade‐off, the correlation between K leaf‐max and g s‐max (K leaf), and WUEi during dehydration in 10 Caragana species adapted to a range of MAP, from < 200 mm to > 1400 mm and growing in a common garden. We hypothesized that species from low‐MAP environments would display hydraulic strategies prioritizing hydraulic safety and would therefore exhibit the following characteristics: more negative K leaf P 50 and higher K leaf‐max, yielding a positive correlation between hydraulic safety and hydraulic efficiency across species; greater leaf WUEi driven by tighter stomatal control during dehydration as a result of a greater accumulation of ABA; more negative K leaf P 50 associated with a more negative πtlp rather than resistance to embolism formation in the leaf xylem; higher vein density, midrib xylem area per leaf area and leaf‐specific capacitance driving greater K leaf‐max values.
Materials and Methods
Plant materials
Caragana is a deciduous genus of great ecological and economical value in East Asia. Indeed, Caragana species dominate both the arid shrublands and temperate forests of East Asia (Zhang et al., 2009, 2015; Fang et al., 2017). Furthermore, species from this genus are widely used in the restoration of degraded land by fixing atmospheric nitrogen, forming shelterbelts for crops and pastures, providing supplemental livestock forage (leaves and flowers) and fuel energy (shoots) for local farmers, and assisting in the conservation of soil and water (Zhang et al., 2009, 2015; Fang et al., 2017). They are often selected for vegetation rehabilitation in returning farmland to woodland, and contribute to increasing forest cover in China (Fang et al., 2017; Chen et al., 2019). In this study, we collected 10 Caragana species (Caragana korshinskii, Caragana tibetica, Caragana roborovskyi, Caragana intermedia, Caragana microphylla, Caragana opulens, Caragana arborescens, Caragana boisi, Caragana stipitata, Caragana sinica) growing in regions varying between 110 and 1400 mm in MAP, and from 0.68 to 32.2 in aridity index (AI = potential evapotranspiration/MAP; Supporting Information Table S1). Notably, mean annual temperature (MAT) displays little variation throughout these regions, ranging from 2.6°C to 9.0°C (data from the China Meteorological Data Sharing Service System, http://data.cma.cn/; Table S1). While precipitation as snow in winter contributes to the soil water supply in spring as the snow melts, > 70% of the total annual precipitation occurs in the areas of collection as rainfall during the growing season from May to October; hereafter for convenience, we refer to species as growing in ‘low‐MAP’ (≤ 400 mm MAP) and ‘high‐MAP’ (≥ 400 mm) environments.
Seeds of the first nine species were collected as described by Fang et al. (2017). Caragana sinica is triploid and has no seeds, and tissue was cultured from > 100 individuals as described by Song et al. (2007). For details see Methods S1. The plants were grown in a common garden to disentangle genetic differences from environmentally‐based ones in a naturally‐lit glasshouse on the Yuzhong campus (lat. 35°51′N, long. 104°07′E; altitude 1620 m) of Lanzhou University, Lanzhou, Gansu Province, China.
Drought stress
On 1 June 2014, 16‐month‐old plants (n = 40) of each species with a height of 0.5–1.0 m and with > 120 compound leaves or palmate leaves were selected. Leaflets were taken to determine leaf dry mass per unit area (LMA) and anatomical traits, and shoots were removed to determine parameters of pressure–volume curves (see subsection ‘Leaf water relations from pressure–volume curves’, below). Then drought stress treatments were imposed: water was withheld such that every day over the first 10 d, individuals were re‐watered with one‐half of the volume of water transpired during the preceding day, by weight (Brodribb & McAdam, 2013). After 10 d, water was withheld completely for the next 40 d at which point the experiment was terminated. Every 1–3 d as the pots dehydrated, the predawn leaf water potential (Ψleaf) and the leaf hydraulic conductance (K leaf) were measured on the 10 study species to construct vulnerability curves. For a subset of six species (C. korshinskii, C. intermedia, C. microphylla, C. boisi, C. stipitata and C. sinica) selected to span the precipitation gradient, the gas exchange rates were measured every 1–3 d as the pots dehydrated. After each gas exchange measurement, the leaf was cut off the plant and the leaflets which were not used during the gas exchange measurement were divided in two. Half were weighed immediately and then dried to constant mass to determine the dry mass/fresh mass ratio, and the other half was also weighed immediately then placed in liquid nitrogen and stored in a freezer at −80°C to measure ABA content.
K leaf measurement
K leaf was measured between 04:30 and 06:30 h Beijing Standard Time (BST) using the evaporative flux method (EFM) after each predawn Ψleaf measurement (between 04:30 and 05:30 h BST Sack et al., 2002; Scoffoni et al., 2011; Sack & Scoffoni, 2012). Instead of constructing K leaf vulnerability curves from detached dehydrated branches, as is typically done, we constructed these from the dehydrating plants. Thus, throughout the 50‐day dehydration period, two leaves were excised at predawn to measure the initial Ψleaf using a pressure chamber (Plant Moisture Stress model 1000; PMS Instrument Co., Albany, OR, USA). A third leaf (typically the middle leaf) was excised immediately under double distilled water, and was connected to silicone tubing to determine the transpiration rate under a light source (1000 μmol m2 s−1 photosynthetically active radiation). The final Ψleaf (the driving force of the flow rate) was determined using the pressure chamber (Sack et al., 2002; Scoffoni et al., 2011; Sack & Scoffoni, 2012) at the end of the K leaf measurement. The vulnerability curve (the change in K leaf with Ψleaf) was obtained by plotting K leaf against the most negative Ψleaf (in our data this was always the predawn Ψleaf) (Sack & Scoffoni, 2012).
Gas exchange measurements
Stomatal conductance (g s) and the net assimilation rate (A) were measured on one upper fully‐expanded leaf adjacent to the leaf used for K leaf in the morning (07:00 and 08:30 h BST) using a portable open gas‐exchange system (LI‐6400, LiCor, Lincoln, NE, USA). The gas exchange chamber was supplied with a photosynthetic photon flux density of 1200 μmol m−2 s−1 provided by an LED source. Leaf temperature was maintained at 22 °C, CO2 was set at 400 ppm, and vapor‐pressure deficit (VPD) was set at about 1.5 kPa. The time of measurement was chosen as early morning because preliminary data showed that gas exchange values for the Caragana species were highest during those hours. Both g s and A were measured as the pots dehydrated (on four leaves from different individuals per species per d of measurement) for the six subsampled species listed in the ‘Drought stress’ subsection, above. Additionally, for the remaining four species, g s‐max and A max were measured in the well‐watered control pots (on four leaves from different individuals per species per d for 3 d in succession).
ABA determination
Leaf ABA concentration was determined following a previously described method (McAdam, 2015). The frozen leaf material was ground in a mortar with liquid nitrogen, and the ground sample was extracted with 5 ml of methanol/water (1 : 1, v/v, pH = 3 with formic acid) and left overnight at 4°C with added labelled ABA (D6‐ABA). The next day, samples were centrifuged and the supernatant was removed. The remaining pellets were extracted with methanol/water twice and the supernatants were combined. The collected supernatant was extracted with petroleum ether, extracted with an ester phase and dried under nitrogen gas using a Termovap Sample Concentrator (HP5106GD; Shanghai Eastern Analytical Instrument Co. Ltd, Shanghai, China). The residue was dissolved in chromatographic purity methanol for analysis with an ultra‐high performance liquid chromatography tandem mass spectrometer (OrbiTrap Fusion Lumos; Thermo Fisher, San Jose, CA, USA). The ABA concentration (ng g−1 dry weight) was calculated as the ABA concentration per leaf fresh mass × (leaf dry mass/leaf fresh mass) of adjacent leaflets to the leaflet sampled for ABA.
Leaf water relations from pressure–volume curves
Six shoots from different individuals of eight species (excluding C. tibetica and C. opulens with short petioles) were removed in the evening before the drought experiment and rehydrated overnight (Ψleaf > −0.3 MPa) to construct pressure–volume curves. One leaf of each shoot per species was removed and immediately scanned to calculate leaf area, and then Ψleaf and leaf mass were repeatedly measured as they dehydrated on the bench. Following standard pressure–volume curve analysis, the osmotic pressure at full turgor (πo), osmotic pressure at turgor loss point (πtlp), modulus of elasticity (ɛ), relative water content at turgor loss point (RWCTLP), saturated water content per unit dry mass (SWC), and the area‐based leaf‐specific capacity at full turgor (C*FT) were calculated (Turner, 1988; Sack et al., 2011).
Optical method
The optical method, which records spatial and temporal patterns of embolism formation in the veins of water‐stressed leaves (Brodribb et al., 2016), was used to determine vein embolism in the subset of six Caragana species. Cumulative embolism in 1° and 2° veins (embolized area/the total cumulative embolized area × 100%) was analyzed (see http://www. opensourceov.org for the detailed image analysis protocol) using a digital camera (EOS 5D Mark III; Canon, Tokyo, Japan) attached to a microscope (Ex30LED; Sunny Instruments, Ningbo, China). The majority of 3° veins and all high‐order veins were difficult to observe as these typically do not have bundle sheath extensions allowing light penetration. For details see Methods S1. The Ψleaf at which leaf conduits reached 12% cumulative embolism (quantifying the initial embolism formation; PLC major P 12) and 50% cumulative embolism (an index of resistance to embolism formation; PLC major P 50) in 1° and 2° vein orders (quantified by changes in pixel coloration as described in Methods S1) were obtained for three leaflets from different individuals per species.
Leaf mass per area and anatomical traits
Leaflets removed from well‐watered plants were scanned at 300 dpi and then oven‐dried at 70°C for 48 h, after which their dry mass was determined and LMA was calculated. Both major and minor vein lengths per area were determined following the method as described by Sack et al. (2002) after leaflets were cleared in 5% sodium hydroxide. Midrib xylem anatomical traits were determined on leaf cross‐sections obtained using a freeze‐microtome as described by Blackman et al. (2010) and Fang et al. (2014). We measured the entire area of the midrib xylem in cross sections using Imagej software (https://imagej.nih.gov/ij/). Midrib xylem area was then standardized per leaflet area. For details see Methods S1.
Statistical analyses
Differences between means of parameters across species were evaluated by one‐way ANOVAs (Duncan’s multiple range test), and differences between species from low‐ vs high‐MAP environments were evaluated with unpaired t‐tests. All statistical analyses were performed with Spss 15.0 (SPSS Inc., Chicago, IL, USA), and results were considered significant at P < 0.05. To construct hydraulic vulnerability curves, we selected the maximum likelihood function that best fitted our data for each species using the optim function in R 3.1.0 (https://www.r‐project.org/). Four functions were tested as described by Scoffoni et al. (2011): a linear function (Kz = aΨz+b), a three‐parameter sigmoidal function , a logistic function , and an exponential function . The Kz in the above functions represents either the K leaf, g s, or net assimilation (A), and Ψz represents leaf water potential. Functions were compared using the Akaike Information Criterion (AIC) corrected for low n. The function with the lowest AIC value (differences of > 2 considered) was chosen as the maximum likelihood function. The maximum and P 50 values were calculated from the best fit function for all three traits. For the four species for which g s and A vulnerability curves were not obtained, averages from leaves of fully hydrated plants were calculated to obtain maximum g s (g s‐max) and maximum A (A max). Trait–trait correlations were performed using the linear, polynomial (inverse first order), peak (gaussian) or sigmoidal function of sigmaplot 10.0 (Systat Software Inc., San Jose, CA, USA).
Data availability
The data for the morphological, anatomical and physiological traits that support the findings of this study are available in the form of a supplementary Excel file. Additional information is available from the corresponding authors upon reasonable request.
Results
Leaf hydraulic efficiency and safety
The Caragana species growing in a common garden showed fourfold variation in K leaf‐max (a measure of hydraulic efficiency), from 16.5 mmol m−2 s−1 in C. korshinskii, a species from low‐MAP environments (< 400 mm), to 4.2 mmol m−2 s−1 in C. arborescens, a species from high‐MAP environments (> 400 mm). Species from low‐MAP environments had significantly higher K leaf‐max than species from high‐MAP environments (t‐test, P = 0.011). K leaf‐max was negatively correlated with MAP across species (Fig. 1a). With decreasing predawn Ψleaf, K leaf decreased gradually, but in the five species from low‐MAP environments, K leaf was less sensitive to decreasing predawn Ψleaf than in the five species from high‐MAP environments (Fig. S1), so that K leaf P 50 (a measure of hydraulic safety) was lower (more negative) in the species from low‐MAP environments than those from high‐MAP environments (t‐test, P < 0.001) and was positively correlated to original habitat MAP across species (Fig. 1b). We found a significant positive relationship between hydraulic safety (more negative K leaf P 50) and hydraulic efficiency (higher K leaf‐max) (Fig. 1c). Notably, the range of K leaf P 50 and K leaf‐max of Caragana species overlapped with the range observed across 137 species in a recent meta‐analysis (Scoffoni & Sack, 2017) (Fig. 1d), though it exhibited a contrasting trend.
Fig. 1.

Hydraulic efficiency and safety. The relationships between (a) maximum leaf hydraulic conductance (K leaf‐max) and mean annual precipitation (MAP), (b) the leaf water potential at 50% loss of leaf hydraulic conductance (K leaf P 50) and MAP, and (c) K leaf‐max and K leaf P 50 across 10 Caragana species. The data from (c) falls within (d) the relationship between K leaf‐max and K leaf P 50 obtained for 137 angiosperm species in a recent meta‐analysis (grey symbols) (Scoffoni & Sack, 2017). The correlation coefficient (r 2) and probability (P) of the fitted linear regressions are given. Open symbols represent species from low‐MAP environments, and closed symbols represent species from high‐MAP environments: C. arborescens, closed inverted triangles; C. boisi, closed squares; C. intermedia, open diamonds; C. korshinskii, open circles; C. microphylla, open triangles; C. opulens, closed circles; C. roborovskyi, open squares; C. sinica, closed triangles; C. stipitata, closed diamonds; C. tibetica, inverted open triangles.
Gas exchange and water use efficiency
In contrast to K leaf‐max, g s‐max showed only a 1.6‐fold variation across 10 Caragana species, from 0.18 mol m−2 s−1 in C. stipitata to 0.29 mol m−2 s−1 in C. sinica (Fig. S2; Table S2), and g s‐max was not correlated with MAP (Fig. S3a) or K leaf‐max (Fig. S3b). As a result, K leaf‐max/g s‐max was significantly lower with increasing MAP and decreasing AI across species (Fig. 2a,b). After water was withheld, g s of species from low‐MAP environments was more sensitive to the decrease in predawn Ψleaf than species from high‐MAP environments (Fig. S2). As a result, species from low‐MAP environments had less negative values of g s P 50 than species from high‐MAP environments (t‐test, P = 0.009; Fig. S4), and g s‐max was not correlated with g s P 50 (r 2 = 0.011, P = 0.843). Similarly to g s‐max, A max showed little variation (1.3‐fold), from 12.6 mmol m−2 s−1 in C. stipitata to 16.1 mmol m−2 s−1 in C. intermedia. No significant differences were found in A max between species from low‐ vs high‐MAP environments (t‐test; P = 0.512), and A max was not correlated with K leaf‐max (r 2 = 0.025, P = 0.663) nor g s‐max (r 2 = 0.205, P = 0.189). A decreased with decreasing predawn Ψleaf after water was withheld across six Caragana species, and A max was not correlated with A P 50 (r 2 = 0.07, P = 0.616).
Fig. 2.

Correlation between hydraulic supply and demand with climate. The relationship between the ratio of maximum leaf hydraulic conductance (K leaf‐max) to maximum stomatal conductance (g s‐max) and mean annual precipitation (MAP) (a), and the aridity index (AI, potential evapotranspiration (PET)/MAP) (b), across 10 Caragana species. The correlation coefficients (r 2) and probabilities (P) for the fitted inverse first order regression (a) and logistic regression (b) are given. Open symbols represent species from low‐MAP environments, and closed symbols represent species from high‐MAP environments: C. arborescens, closed inverted triangles; C. boisi, closed squares; C. intermedia, open diamonds; C. korshinskii, open circles; C. microphylla, open triangles; C. opulens, closed circles; C. roborovskyi, open squares; C. sinica, closed triangles; C. stipitata, closed diamonds; C. tibetica, inverted open triangles.
Notably, A was less sensitive to decreasing predawn Ψleaf than gs (Fig. S5), with A P 50 values occurring −0.3 to −0.8 MPa below g s P 50 across species. This resulted in an increase in intrinsic leaf water use efficiency (WUEi = A/g s) before πtlp in species from low‐MAP environments, which showed greater sensitivity in g s but not A (Fig. 3). Maximum WUEi (calculated at the water potential when the value peaked across species; Fig. 3) was higher in species from low‐MAP environments (on average 200.2 ± 6.50) compared to species from high‐MAP environments (average 99.1 ± 2.72) (t‐test, P < 0.001). The WUEi in species from low‐MAP environments was 2.6, 1.6, and 2.2‐fold higher at K leaf P 50, g s P 50 and πtlp, respectively, compared to species from high‐MAP environments. Notably, WUEi values in well‐watered plants were similar across species, varying only 1.6‐fold from 44.8 to 73.7 (Table S2), and no correlation between K leaf P 50 and WUEi of well‐watered plants were found (r 2 = 0.551, P = 0.091). However, significant correlations were found between K leaf P 50 and WUEi at K leaf P 50, g s P 50 and πtlp (r 2 = 0.816–0.960, P = 0.001–0.014).
Fig. 3.

Drought‐induced intrinsic water use efficiency (WUEi, net photosynthesis/stomatal conductance). Relationship between WUEi and predawn leaf water potential (Ψleaf) in species from low mean annual precipitation (MAP) environments (a, c, e) and high‐MAP environments (b, d, f). The line indicates significant regressions (P < 0.05), and the correlation coefficient (r 2) and probability (P) of the fitted Gaussian regressions are listed in (a, c, e, f). The vertical dashed line represents the turgor loss point (πtlp) from the pressure–volume curve for each species.
Drought tolerance traits and anatomical and biochemical drivers
Species varied by 1.2‐ to 1.6‐fold in their πo, πtlp, SWC and C*FT values (one‐way ANOVA; P = 0.001–0.045). Additionally, species from low‐MAP environments displayed more negative πo and πtlp, and higher SWC and C*FT than species from high‐MAP environments (t‐test; P = 0.005–0.008; Tables S2, S3). The modulus of elasticity (ɛ) and LMA did not differ across species (P = 0.436–0.706; Tables S2, S3). Significant variation was found in venation and cross‐sectional anatomical traits across species (one‐way ANOVA; P = 0.005–0.008). Notably, major, minor and total VLA, and midrib xylem area per leaflet area were higher in species from low‐MAP environments than in species from high‐MAP environments (t‐test; P = 0.008–0.04; Fig. S6). Significant correlations between K leaf‐max and the C*FT, major VLA, minor VLA, and midrib xylem area per leaflet area were found (Fig. 4a–d), as well as between πtlp and K leaf P 50 (Fig. 4e).
Fig. 4.

Relationship between maximum leaf hydraulic conductance, leaf‐specific capacity and leaf venation structure, and between the leaf water potential at 50% loss of leaf hydraulic conductance and turgor loss point. The relationship (a) between the maximum leaf hydraulic conductance (K leaf‐max) and area‐based leaf‐specific capacity at full turgor (C*FT) (n = 8), (b–d) between K leaf‐max and major vein length per area (VLA) (b), minor VLA (c) and midrib xylem conduit area per leaflet area (d) (n = 10), and (e) between the leaf water potential at 50% loss of leaf hydraulic conductance (K leaf P 50) and osmotic potential at the turgor loss point (πtlp) (n = 8) in Caragana species. The correlation coefficients (r 2) and probabilities (P) of the fitted linear regressions are given. The bars are ± 1 SE of the mean (n = 6) when larger than the symbol. Open symbols represent species from low mean annual precipitation (MAP) environments, and closed symbols represent species from high‐MAP environments: C. arborescens, closed inverted triangles; C. boisi, closed squares; C. intermedia, open diamonds; C. korshinskii, open circles; C. microphylla, open triangles; C. opulens, closed circles; C. roborovskyi, open squares; C. sinica, closed triangles; C. stipitata, closed diamonds; C. tibetica, inverted open triangles.
The leaf ABA concentration increased linearly until the predawn Ψleaf reached −3.0 to −4.0 MPa across species, and then decreased (Fig. 5). However, the peak leaf ABA concentration was 1000–1500 ng g−1 dry weight (DW) in species from low‐MAP environments, vs 550–750 ng g−1 DW in species from high‐MAP environments (t‐test, P = 0.02; Fig. 5; Table S2). Species showed a significant negative correlation between g s and ABA concentration as Ψleaf decreased (Fig. 5 inset panels). The ABA concentration at g s P 50 only varied from 406 ng g−1 DW in C. stipitata to 670 ng g−1 DW in C. korshinskii, and no significant differences were observed between species of low‐ vs high‐MAP environments (t‐test; P = 0.111). Species from low‐MAP environments achieved higher ABA concentrations at higher values of Ψleaf than those from high‐MAP environments (Fig. 5) and g s P 50 was about −1.2 MPa in low‐MAP environments, whereas it was more negative in species from high‐MAP environments (about −1.9 MPa). Notably, the slopes of ABA accumulation with decreasing Ψleaf were not correlated with K leaf P 50 (r 2 = 0.007, P = 0.131).
Fig. 5.

Relationship between leaf ABA concentration, leaf water potential and stomatal conductance. The relationship between leaf abscisic acid (ABA) concentration and predawn leaf water potential (Ψleaf) in six Caragana species: (a) C. korshinskii, (b) C. intermedia, (c) C. microphylla, (d) C. boisi, (e) C. stipitate and (f) C. sinica. The inset panels show the relationship between stomatal conductance (g s) and leaf ABA concentration before ABA concentration decreased. The inset panels show the correlation coefficients (r 2) and probabilities (P) of the fitted inverse first order regressions (a–c) and the fitted linear regressions (d–f). The vertical dashed line represents Ψleaf at 50% loss of g s. The bars are ± 1 SE of the mean (n = 4) when larger than the symbol.
Optical embolisms
Discrete embolisms were not observed propagating in the midrib until Ψleaf reached c. −4.0 MPa in all six species (Fig. 6; Videos S1, S2). Embolisms then propagated from the midrib to the 2° vein. PLC major P 12 and PLC major P 50 ranged from −4.0 to −4.6 MPa and from −4.5 to −5.2 MPa, respectively (Fig. 6). On average, PLC major P 12 and PLC major P 50 were slightly more negative in three species from low‐MAP environments than in three species from high‐MAP environments (t‐test, P = 0.011–0.025; Fig. S7). PLC major P 12 did not correlate with Ψleaf at ABA peak (r 2 = 0.004, P = 0.902), and neither PLC major P 12 nor PLC major P 50 significantly correlated with K leaf‐max or K leaf P 50 across six Caragana species (Fig. S8).
Fig. 6.

Cumulative embolism with decreasing leaf water potential (Ψleaf) in 1° and 2° order veins. Leaf vein optical vulnerability curves of six Caragana species from (a–c) low mean annual precipitation (MAP) environments and (d–f) high‐MAP environments: (a) C. korshinskii, (b) C. intermedia, (c) C. microphylla, (d) C. boisi, (e) C. stipitata and (f) C. sinica. The cumulative embolism in 1° and 2° order veins (embolized pixels/total embolized pixels × 100%) is shown by the black line, in only the 1° order veins by the red line, and in only the 2° order veins by the green line. The vertical dashed and solid lines denote the Ψleaf at which leaf conduits reached 12% cumulative embolism (PLC major P 12) and 50% cumulative embolism (PLC major P 50) in 1° and 2° vein orders. The spatial distribution of embolisms are shown only for (g) C. korshinskii (from a low‐MAP environment) and (h) C. sinica (from a high‐MAP environment) (see Supporting Information Videos S1, S2).
Variation in physiological sequences of events during dehydration
Species from low‐ vs high‐MAP environments displayed different sequences of physiological events during dehydration (Fig. 7) and thus differed in their hydraulic safety margins (Table S2). In species from low‐MAP environments, a higher sensitivity of stomatal conductance (g s) to decreasing leaf water potential, triggered by increases in ABA, helps to optimize WUEi until the turgor loss point (Fig. 7). Species from high‐MAP environments still operated close to or below the turgor loss point, whereas species from low‐MAP environments had greater stomatal (g s P 50) and photosynthetic (A P 50) sensitivity before the turgor loss point (t‐tests, P ≤ 0.002; Table S2). Species from high‐MAP environments displayed greater hydraulic safety (K leaf P 50) before turgor loss point (t‐test; P = 0.02; Fig. 7; Table S2). However, no significant differences were found between stomatal and photosynthetic responses, with g s P 50 occurring on average across species 0.63 MPa before A P 50 (Table S2). Across all species, embolism formation occurred only under severe and prolonged drought (Fig. 7).
Fig. 7.
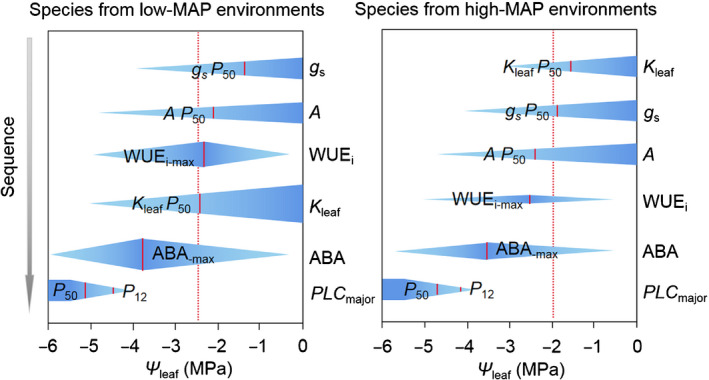
The sequence of physiological responses to leaf dehydration in Caragana from low and high mean annual precipitation environments. Changes in stomatal conductance (g s), net photosynthesis (A), intrinsic water‐use efficiency (WUEi), leaf hydraulic conductance (K leaf), leaf ABA concentration and cumulative embolism with decreasing leaf water potential (Ψleaf) in Caragana species from low‐ and high‐mean annual precipitation environments are shown. The vertical short solid red lines in each response variable represent the species mean Ψleaf at 50% loss of g s (g s P 50), Ψleaf at 50% loss of A (A P 50), Ψleaf at maximum WUEi (WUEi‐max), Ψleaf at 50% loss of K leaf (K leaf P 50), Ψleaf at peak ABA concentration (ABA‐max), Ψleaf at which leaf conduits reached 12% cumulative embolism (PLC major P 12) and 50% cumulative embolism (PLC major P 50) in 1° and 2° vein orders. The vertical dotted red line represents the species mean turgor loss point (πtlp).
Discussion
High leaf hydraulic efficiency and safety as a strategy to cope with aridity in Caragana species
Because of the important role that precipitation plays in shaping species’ distribution, in recent decades there has been a considerable interest in understanding the physiological adaptation of species to contrasting water availability (Pockman & Sperry, 2000; Maherali et al., 2004; Choat et al., 2012, 2007; Engelbrecht et al., 2007; Blackman et al., 2014). Common garden experiments have unraveled important correlations between hydraulic traits and environmental parameters from the species’ original habitat, suggesting a genetic basis to these physiological adaptations (Scoffoni et al., 2016; Jankowski et al., 2019; Ignazia et al., 2020). Here, we report that closely‐related species from habitats with varying MAP have diversified to exhibit both a high leaf hydraulic efficiency and safety under low water resource availability. Indeed, we found a strong significant positive correlation between water potential at 50% loss of leaf hydraulic conductance (K leaf P 50; i.e. hydraulic safety) and maximum leaf hydraulic conductance (K leaf‐max; i.e. hydraulic efficiency) across 10 Caragana species growing in a common garden. This high hydraulic safety and efficiency strategy would be particularly adaptive for species growing in arid environments: species can both resist drought‐induced hydraulic impairment and efficiently transport water when water is made available (i.e. after a rare rainfall event). Indeed, our results show a significant correlation between K leaf P 50 and original habitat MAP in these closely related species, with species from habitats with lower MAP exhibiting more negative K leaf P 50. These results are in accordance with data showing similar trends in a meta‐analysis and across diverse Australian species measured in situ studies (Blackman et al., 2012, 2014; Nardini & Luglio, 2014). Our results, combined with those that have been published previously, emphasize that K leaf P 50 is an important trait in shaping species’ distribution across water‐availability gradients; similar suggestions have been made for for K stem P 50 (Choat et al., 2012). Furthermore, K leaf‐max was also correlated with original habitat MAP, suggesting that species native to low‐MAP environments exhibit higher K leaf‐max. High efficiency and safety would be particularly advantageous in Caragana growing in these cold and low‐MAP environments. Indeed, the accumulation of snow in winter results in high soil water availability in the spring after the snow melts, and along with spring rainfall, provides plants with favorable soil moisture at the beginning of the growing season. A high K leaf‐max in these species would therefore help to keep stomata open during the day through changes in VPD (Scoffoni et al., 2018) and help the plant achieve a high photosynthetic rate during this short growing season to produce flowers and mature seeds before the severely dry summer that starts in July (Fang et al., 2017).
A positive trend between hydraulic safety and efficiency, such as that observed here across Caragana species, can be surprising at first glance given previous findings. A negative trend instead between hydraulic safety and efficiency has been reported in many studies. Previous studies showed closely‐related species did not possess a ‘safe’ stem hydraulic system (i.e. one that withstands a very negative K stem P 50) while being highly ‘efficient’ (i.e. a very high K stem) whereas no correlation was found in leaves (Chen et al., 2009; Hao et al., 2012). In meta‐analyses of diverse species, the trade‐off was observed in both leaves and stems, which pointed to a lack of data for species that would exhibit both extreme high hydraulic efficiencies and safety (Gleason et al., 2016; Scoffoni & Sack, 2017). In stems, lack of such a combination relates to limitations of the xylem, as characteristics of the pit membranes, lumen dimensions and the number of xylem conduits can impact the efficiency of water movement and safety from embolism (Wheeler et al., 2005; Sperry et al., 2006; Pittermann, 2010; Gleason et al., 2016; Pfautsch et al., 2016). In leaves, such a trade‐off might be driven by similar reasons to those for stems if the proportion of resistance in the leaf xylem pathways is higher than that in the outside‐xylem pathways. However, these two meta‐analyses pointed to the weakness of the trend, with species displaying strong variation in both maximum efficiencies and vulnerabilities of the hydraulic system (Gleason et al., 2016; Scoffoni & Sack, 2017). Thus, the strong variation in K leaf‐max for species with K leaf P 50 values > −3 MPa indicates that there is room for species to achieve high hydraulic efficiency and safety in a given system, as we report here in Caragana. High hydraulic efficiency and safety has also been reported across four genotypes of coffee (Nardini et al., 2014). This positive trend could reflect a diversity of drought resistance traits evolved in both the xylem and outside‐xylem pathways (Scoffoni & Sack, 2017). Our results confirm that evolving a xylem resistant to embolism formation did not limit maximum hydraulic efficiency. Indeed, we found no correlation between PLC major P 12, PLC major P 50 and K leaf‐max (P = 0.252–0.359).
Finally, we note that all our species are deciduous, thus eventually escaping the most intense/prolonged drought of the season. Such a life strategy could affect the hydraulic strategies described here. Indeed, previous studies have found that evergreen species tend to have lower maximum stem specific hydraulic conductance than deciduous ones, but more negative Ψleaf at 50% loss of stem hydraulic conductance (Choat et al., 2005; Kröber et al., 2014). However, at the leaf level this relationship remains unclear. Indeed, a recent meta‐analysis found that across 215 angiosperm woody species, evergreen species had more negative K leaf P 50 values than deciduous ones (Scoffoni & Sack, 2017). Our analysis of the 46 angiosperm deciduous and 84 evergreen deciduous species from Scoffoni & Sack (2017) showed no significant differences between K leaf‐max (t‐test; P = 0.38), thus suggesting that the safety–efficiency trade‐off was not necessarily driven by differences in species life strategies. Furthermore, we note that a positive correlation between K leaf‐max and K leaf P 50 was also found across four genotypes of coffee, an evergreen species (Nardini et al., 2014). Future work is needed to further explore the causes behind the trade‐off observed between K leaf‐max and K leaf P 50 across diverse species (Scoffoni & Sack, 2017). We note that indeed, species with long‐lived leaves might require cells and xylem to be built to withstand greater tensions, which could impact to some extent maximum K leaf. Across our deciduous species, no significant differences in LMA (Table S3) were found, suggesting that mesophyll anatomy, including differences in cell sizes (and thus cell wall thickness) (John et al., 2013) and mesophyll cell layers, which are major drivers of LMA (John et al., 2017), might not vary much across our species. Indeed, variation in mesophyll anatomy has been shown to influence maximum K leaf (Buckley, 2015). Thus, it remains unclear whether a combined high K leaf and more negative K leaf P 50 could be observed across more diverse species, including both evergreen and deciduous species. Future work in leaves is needed to establish the underlying causes of these patterns.
Drivers behind the high hydraulic safety and efficiency trend in Caragana
Our results point to leaf venation playing a role in driving higher K leaf‐max. Both minor and major VLA were tightly associated with K leaf‐max (Fig. 4b,c). Indeed, studies have shown that an increase in VLA can help reduce the hydraulic resistance of both the xylem and outside‐xylem pathways by adding more routes for water to travel through, shortening the distance from the xylem to the site of evaporation in the leaf (Brodribb & Jordan, 2008; Scoffoni et al., 2016), increasing the bundle sheath surface area in the leaf (Caringella et al., 2015) and thus decreasing the resistance of water movement from the vein xylem to the mesophyll (Sack & Frole, 2006; Brodribb & Jordan, 2008). Furthermore, our data suggest that conductance through the midrib played a role in the increase in K leaf‐max across species, as it was associated with midrib xylem area per leaflet area in species with higher values in low‐MAP environments (Fig. 4d). Finally, our data suggest that leaf capacitance at full turgor could also have helped increase K leaf‐max in species from low‐MAP environments. Indeed, the leaf area specific capacitance at full turgor (C*FT) was closely correlated with K leaf‐max, with higher values observed in species from low‐MAP environments (Fig. 4a). The C* FT contributes to the ability of the leaf to meet transpirational demand by minimizing transient fluctuations in mesophyll water potential (Sack et al., 2003; Xiong & Nadal, 2020).
Contrary to the idea that high K leaf‐max is potentially achieved through diversification of both xylem and outside‐xylem tissues, the more negative K leaf P 50 displayed in species from low‐MAP environments appears to be driven mainly by changes in outside‐xylem pathways. Our results showed that across the six species, 66 ± 6.5% of the decrease in K leaf occurred before the turgor loss point, and 94 ± 3.1% of the decrease in K leaf occurred before initial embolism formation in leaf mid‐veins (at a Ψleaf close to about −4.0 MPa). The lack of embolism before turgor loss point has indeed been observed in most species tested (Scoffoni & Sack, 2017). Our results corroborate those of previous studies suggesting that K ox was principally involved in the early decrease of K leaf (Sack et al., 2016; Scoffoni & Sack, 2017; Scoffoni et al., 2017). The more negative K leaf P 50 could be achieved through changes in aquaporin expression, mesophyll and bundle sheath anatomy, cell wall composition and/or in changes in intercellular airspace distribution (Buckley et al., 2015; Earles et al., 2018; Ohtsuka et al., 2018; Scoffoni et al., 2018). While we did not quantify aquaporin expression or cross‐sectional anatomy, the tight correlation between K leaf P 50 and πtlp suggests a link between outside‐xylem pathways and hydraulic vulnerability. Such a link has been observed across a diverse set of species (Scoffoni & Sack, 2017), and studies have suggested that a more negative πtlp could help maintain cell integrity and hydraulic pathways outside the xylem under increased drought (Scoffoni et al., 2014) and extend the range of Ψleaf over which the leaf remains turgid, thereby maintaining leaf hydraulic function (Sack et al., 2003; Lenz et al., 2006). A more negative πtlp could also allow aquaporins to remain activated longer during drought (Kim & Steudle, 2007; Scoffoni & Sack, 2017). Aquaporins could deactivate in response to a change in cell turgor, especially within the vascular parenchyma and/or bundle sheath (Kim & Steudle, 2007; Shatil‐Cohen et al., 2011; Pantin et al., 2013) which represent a large bottleneck in outside‐xylem pathways, as water needs to move past these cells to reach the mesophyll and stomata. In this study, we defined the leaf hydraulic safety as the leaf water potential (Ψleaf) at 50% loss of K leaf (K leaf P 50), as it has typically been defined throughout the leaf hydraulic literature (Brodribb & Holbrook, 2006; Scoffoni et al., 2017, 2011; Guyot et al., 2012; Bucci et al., 2013; Laur & Hacke, 2014). The term ‘safety’ originated from usage in stem hydraulics as safety against embolism formation which has been shown to be a major cause of plant mortality world‐wide (Choat et al., 2012). Notably, across our species set, no embolism occurred at K leaf P 50. We suggest that the safety–efficiency trade‐off in leaves might be better referred to as an efficiency–sensitivity trade‐off. Similarly, leaf hydraulic (or stomatal or photosynthetic) sensitivity (instead of vulnerability) curves might better reflect the leaf‐level physiological response to dehydration if embolisms are not involved.
Hydraulics and gas exchange
We found no association between K leaf‐max and g s‐max or A max across 10 Caragana species. These results are contrary to previous findings of a strong relationship between K leaf‐max and gas exchange in both closely‐related and diverse angiosperms (Brodribb et al., 2005; Scoffoni et al., 2016), pointing to a hydraulic basis for the evolution of high photosynthetic rates and thus growth (Scoffoni et al., 2016). However, across nine C4 grasses, a lack of correlation between K leaf‐max and either stomatal conductance or photosynthesis was also observed (Ocheltree et al., 2016). The lack of association observed across Caragana species does not necessarily indicate the absence of a role for leaf hydraulics in increasing photosynthetic rates across species. Indeed, species did not vary in g s‐max or A max, but strongly varied in K leaf‐max, suggesting that some species display greater hydraulic supply than is needed for photosynthesis. Indeed, species varied in their hydraulic supply to demand ratio (K leaf‐max/g s‐max), with species from low‐MAP environments displaying greater values. Further, a negative correlation was observed between K leaf‐max/g s‐max and habitat MAP (Fig. 2a). Thus, our results suggest that the increase in K leaf‐max in species from low‐MAP environments might be beneficial to species survival for four reasons: first, it helps mitigate the greater evaporative loads induced by high vapour pressure deficits in dry environments (Brodribb et al., 2007; Scoffoni et al., 2016, 2011); second, it reduces leaf temperature through evaporative cooling; third, it helps reduce xylem tension (and thus embolisms) at any given rate of transpiration; and fourth, it allows faster recovery of wilted tissues with efficient water transport after an occasional rainfall event post drought.
Caragana species from low‐ vs high‐MAP environments differed in their sequence of physiological responses to dehydration (Fig. 7). Species from low‐MAP environments were characterized by early stomatal closure (Fig. S2) and decrease in photosynthesis (Fig. S5) before hydraulic decrease (Fig. S1). Such high stomatal sensitivity appears to be associated with steep increases in foliar ABA concentration (Fig. 5) in Caragana species from low‐MAP environments compared with species from high‐MAP environments in the early stages of drought. Indeed, the ABA concentration at g s P 50 across species did not differ significantly between species from low‐ vs high‐MAP environments, but this value was achieved at significantly higher water potentials in species from low‐MAP environments (Fig. 5). This greater stomatal sensitivity, driven by an increase in ABA, contributed to optimizing the leaf WUEi in species from low‐MAP environments (Negin & Moshelion, 2016) which enables these species to maintain carbon gain during dehydration (as net assimilation does not decrease as much as g s with dehydration) while saving water (Fig. 3). Notably, the lack of correlation between the slopes of ABA accumulation with decreasing Ψleaf with K leaf P 50 implies that ABA did not have a significant role in driving changes in K leaf during dehydration. Previous studies had indeed found that ABA could trigger aquaporin deactivation in bundle sheath cells, thus decreasing outside‐xylem hydraulic conductance (Shatil‐Cohen et al., 2011; Prado et al., 2013). Instead, K leaf was less sensitive to dehydration in species from low‐MAP environments, enabling greater cell hydration during dehydration. Under more severe drought conditions, a marked decrease in ABA levels (Fig. 5) indicates a shift from ABA‐driven stomatal closure to water potential driven stomatal closure (Brodribb & McAdam, 2013), and the onset of leaf xylem embolism appears at around those water potential values (Fig. 7). By contrast, rapidly declining water potentials generated by the high K leaf sensitivity to dehydration in species from high‐MAP environments would help contribute to stomatal closure (Scoffoni et al., 2018), as ABA levels were significantly lower in those species, and in turn help optimize WUEi during dehydration. We note that in low‐MAP environments, ABA was more efficient in optimizing WUEi than K leaf sensitivity to dehydration, as WUEi was higher in species from these habitats, allowing for greater functionality under drier conditions. These results corroborate past studies reporting species exhibiting greater WUE in response to either simulated reduction in precipitation (Grossiord et al., 2017), or to different growth environments (Cornwell et al., 2010). Indeed, Metrosideros polymorpha growing in low‐MAP environments (< 400 mm yr–1) exhibits higher water use efficiency than when grown in high‐MAP environments (> 10 000 mm yr–1) (Cornwell et al., 2010).
Limitations of a common garden approach
We tested leaf hydraulic efficiency and safety in Caragana species in a common garden environment. This approach is useful in exposing potential genotypic differences and has been shown to be essential in establishing evolutionary coordination of traits (Mason & Donovan, 2015; Scoffoni et al., 2016); however, it cannot fully reflect species’ responses to drought in situ and/or in plants grown under different water regimes. Here, the results from the common garden showed strong genotypic differences in leaf hydraulics between species from low‐ vs high‐MAP environments. Notably, we argue that these differences would be more pronounced in situ, or in plants grown under low water availability. Indeed, differences in leaf ontogeny for species grown in situ (or under low water availability) would most likely only reinforce these differences, as studies have found that species growing in arid habitats tend to have smaller leaves with higher major vein length per area, higher minor vein length per area, greater resistance to embolism formation and more negative turgor loss point (Bartlett et al., 2012; Sack & Scoffoni, 2013; Scoffoni & Sack, 2017). These anatomical differences would likely increase K max and make K leaf P 50 more negative. Notably, the low variation in the leaf xylem hydraulic conductance measured with the optical method across species could reflect the limitations of having grown these species in a common garden, and the differences in PLC major P 12 and PLC major P 50 between species from low‐ and high‐MAP environments might be more pronounced in situ. Future studies should more closely examine the relationship between hydraulic traits in situ or when grown under contrasting water availability to unravel the maximum potential hydraulic response to drought.
Conclusion
Across 10 Caragana species from a precipitation gradient of 110 mm to 1400 mm grown in a common garden, high hydraulic safety was positively related to high efficiency, with species from drier habitats exhibiting higher safety and efficiency, more negative πtlp and higher area‐based C*FT, vein density and midrib xylem area per leaflet area. The higher K leaf‐max in species from low‐MAP environments did not translate to higher g s‐max, and tighter stomatal control mediated by higher ABA accumulation during dehydration resulted in a rapid decrease in g s, thereby increasing hydraulic safety and water use efficiency. The results help advance our understanding of hydraulic performance in species from low‐MAP environments – a greater leaf hydraulic efficiency and safety, along with high water use efficiency, could allow species to grow and survive in arid and semiarid areas that are predicted to become drier and warmer with climate change.
Author contributions
CS, XWF, NCT and FML designed the experiments and wrote the manuscript; XWF performed data analysis; CS, XWF and TPG prepared the figures; GQY and ZFN conducted most of the experiments. G‐QY and Z‐FN contributed equally to this work.
Supporting information
Fig. S1 Response of leaf hydraulic conductance to dehydration in 10 Caragana species.
Fig. S2 Response of stomatal conductance to dehydration in six Caragana species.
Fig. S3 Relationship between maximum stomatal conductance and mean annual precipitation and maximum leaf hydraulic conductance in 10 Caragana species.
Fig. S4 Relationship between leaf water potential at 50% loss of stomatal conductance and mean annual precipitation in six Caragana species.
Fig. S5 Response of leaf photosynthesis to dehydration in six Caragana species.
Fig. S6 Variation in leaf venation architecture across 10 Caragana species.
Fig. S7 Variation in leaf water potential at which leaf conduits reached 12% and 50% cumulative embolism in 1° and 2° vein orders in six Caragana species.
Fig. S8 Relationships between leaf hydraulics and embolism resistance across six Caragana species.
Methods S1 Additional materials and methods.
Table S1 The ploidy, location and environment at the collection sites of the 10 Caragana species.
Table S2 Summary of 37 morphological, anatomical and physiological traits and results of analysis of variance for the difference across species (one‐way ANOVAs) and between species from low‐ vs high‐rainfall environments (t‐test).
Table S3 Leaf mass per unit area and water relations characteristics of the 10 Caragana species used in this study.
Video S1 Progression of embolism in Caragana korshniskii (animated version of Fig. 6g).
Video S2 Progression of embolism in Caragana sinica (animated version of Fig. 6h).
Please note: Wiley Blackwell are not responsible for the content or functionality of any Supporting Information supplied by the authors. Any queries (other than missing material) should be directed to the New Phytologist Central Office.
Acknowledgements
We thank three anonymous referees for their valuable comments on the manuscript. We also thank the Core Facility of the School of Life Sciences, Lanzhou University, and NCT thanks the Institute of Agriculture at the University of Western Australia for its support. The research was partially supported by the National Natural Science Foundation of China (nos. 31971406, 31670404, 31422011, 31860176), the Fundamental Research Funds for the Central Universities (Lzujbky‐2017‐ot07), Feitian Project (860059), ‘111’ Programme (BP0719040) and an NSF‐CAREER grant (231715). The authors declare no competing interests.
References
- Baer A, Wheeler JK, Pittermann J. 2016. Not dead yet: the seasonal water relations of two perennial ferns during California’s exceptional drought. New Phytologist 210: 122–132. [DOI] [PubMed] [Google Scholar]
- Bartlett MK, Scoffoni C, Sack L. 2012. The determinants of leaf turgor loss point and prediction of drought tolerance of species and biomes: a global meta‐analysis. Ecology Letters 15: 393–405. [DOI] [PubMed] [Google Scholar]
- Blackman CJ, Brodribb TJ, Jordan GJ. 2009. Leaf hydraulics and drought stress: response, recovery and survivorship in four woody temperate plant species. Plant, Cell & Environment 32: 1584–1595. [DOI] [PubMed] [Google Scholar]
- Blackman CJ, Brodribb TJ, Jordan GJ. 2010. Leaf hydraulic vulnerability is related to conduit dimensions and drought resistance across a diverse range of woody angiosperms. New Phytologist 188: 1113–1123. [DOI] [PubMed] [Google Scholar]
- Blackman CJ, Brodribb TJ, Jordan GJ. 2012. Leaf hydraulic vulnerability influences species’ bioclimatic limits in a diverse group of woody angiosperms. Oecologia 168: 1–10. [DOI] [PubMed] [Google Scholar]
- Blackman CJ, Gleason SM, Chang Y, Cook AM, Laws C, Westoby M. 2014. Leaf hydraulic vulnerability to drought is linked to site water availability across a broad range of species and climates. Annals of Botany 114: 435–440. [DOI] [PMC free article] [PubMed] [Google Scholar]
- Brodribb TJ, Feild TS, Jordan GJ. 2007. Leaf maximum photosynthetic rate and venation are linked by hydraulics. Plant Physiology 144: 1890–1898. [DOI] [PMC free article] [PubMed] [Google Scholar]
- Brodribb TJ, Holbrook NM. 2006. Declining hydraulic efficiency as transpiring leaves desiccate: two types of response. Plant, Cell & Environment 29: 2205–2215. [DOI] [PubMed] [Google Scholar]
- Brodribb TJ, Holbrook NM, Zwieniecki MA, Palma B. 2005. Leaf hydraulic capacity in ferns, conifers and angiosperms: impacts on photosynthetic maxima. New Phytologist 65: 839–846. [DOI] [PubMed] [Google Scholar]
- Brodribb TJ, Jordan GJ. 2008. Internal coordination between hydraulics and stomatal control in leaves. Plant, Cell & Environment 31: 1557–1564. [DOI] [PubMed] [Google Scholar]
- Brodribb TJ, McAdam SA. 2013. Abscisic acid mediates a divergence in the drought response of two conifers. Plant Physiology 162: 1370–1377. [DOI] [PMC free article] [PubMed] [Google Scholar]
- Brodribb TJ, McAdam SAM, Jordan JG, Martins SCV. 2014. Conifer species adapt to low‐rainfall climates by following one of two divergent pathways. Proceedings of the National Academy of Sciences, USA 40: 14489–14493. [DOI] [PMC free article] [PubMed] [Google Scholar]
- Brodribb TJ, Skelton RP, McAdam SA, Bienaimé D, Lucani CJ, Marmottant P. 2016. Visual quantification of embolism reveals leaf vulnerability to hydraulic failure. New Phytologist 209: 1403–1409. [DOI] [PubMed] [Google Scholar]
- Bucci SJ, Scholz FG, Peschiutta ML, Arias NS, Meinzer FC, Goldstein G. 2013. The stem xylem of Patagonian shrubs operates far from the point of catastrophic dysfunction and is additionally protected from drought‐induced embolism by leaves and roots. Plant, Cell & Environment 36: 2163–2174. [DOI] [PubMed] [Google Scholar]
- Buckley TN. 2015. The contributions of apoplastic, symplastic and gas phase pathways for water transport outside the bundle sheath in leaves. Plant, Cell & Environment 38: 7–22. [DOI] [PubMed] [Google Scholar]
- Buckley TN, John GP, Scoffoni C, Sack L. 2015. How does leaf anatomy influence water transport outside the xylem? Plant Physiology 168: 1616–1635. [DOI] [PMC free article] [PubMed] [Google Scholar]
- Caringella MA, Bongers FJ, Sack L. 2015. Leaf hydraulic conductance varies with vein anatomy across Arabidopsis thaliana wild‐type and leaf vein mutants. Plant, Cell & Environment 38: 2735–2746. [DOI] [PubMed] [Google Scholar]
- Chen C, Park T, Wang X, Piao S, Xu B, Chaturvedi RK, Fuchs R, Brovkin V, Ciais P, Fensholt R. 2019. China and India lead in greening of the world through land‐use management. Nature Sustainability 2: 122–129. [DOI] [PMC free article] [PubMed] [Google Scholar]
- Chen JW, Zhang Q, Li XS, Cao KF. 2009. Independence of stem and leaf hydraulic traits in six Euphorbiaceae tree species with contrasting leaf phenology. Planta 230: 459–468. [DOI] [PMC free article] [PubMed] [Google Scholar]
- Choat B, Ball MC, Luly JG, Holtum JAM. 2005. Hydraulic architecture of deciduous and evergreen dry rainforest tree species from north‐eastern Australia. Trees 19: 305–311. [Google Scholar]
- Choat B, Jansen S, Brodribb TJ, Cochard H, Delzon S, Bhaskar R, Bucci SJ, Feild TS, Gleason SM, Hacke UG et al 2012. Global convergence in the vulnerability of forests to drought. Nature 491: 752–755. [DOI] [PubMed] [Google Scholar]
- Choat B, Sack L, Holbrook NM. 2007. Diversity of hydraulic traits in nine Cordia species growing in tropical forests with contrasting precipitation. New Phytologist 175: 686–698. [DOI] [PubMed] [Google Scholar]
- Cornwell WK, Bhaskar R, Sack L, Cordell S, Lunch CK. 2010. Adjustment of structure and function of hawaiian Metrosideros polymorpha at high vs. low precipitation. Functional Ecology 21: 1063–1071. [Google Scholar]
- Earles JM, Théroux‐Rancourt G, Roddy AB, Gilbert ME, McElrone AJ, Brodersen CR. 2018. Beyond porosity: 3D leaf intercellular airspace traits that impact mesophyll conductance. Plant Physiology 178: 148–162. [DOI] [PMC free article] [PubMed] [Google Scholar]
- Engelbrecht BM, Comita LS, Condit R, Kursar TA, Tyree MT, Turner BL, Hubbell SP. 2007. Drought sensitivity shapes species distribution patterns in tropical forests. Nature 447: 80–82. [DOI] [PubMed] [Google Scholar]
- Fang XW, Turner NC, Palta JA, Yu MX, Gao TP, Li FM. 2014. The distribution of four Caragana species is related to their differential responses to drought stress. Plant Ecology 215: 133–142. [Google Scholar]
- Fang XW, Zhang JJ, Xu DH, Pang J, Gao TP, Zhang CH, Li FM, Turner NC. 2017. Seed germination of Caragana species from different regions is strongly driven by environmental cues and not phylogenetic signals. Scientific Reports 7: 1–11. [DOI] [PMC free article] [PubMed] [Google Scholar]
- Gleason SM, Westoby M, Jansen S, Choat B, Hacke UG, Pratt RB, Bhaskar R, Brodribb TJ, Bucci SJ, Cao KF. 2016. Weak tradeoff between xylem safety and xylem‐specific hydraulic efficiency across the world's woody plant species. New Phytologist 209: 123–136. [DOI] [PubMed] [Google Scholar]
- Grossiord C, Sevanto S, Adams HD, Collins AD, Dickman LT, McBranch N, Michaletz ST, Stockton EA, Vigil M, McDowell NG. 2017. Precipitation, not air temperature, drives functional responses of trees in semi‐arid ecosystems. Journal of Ecology 105: 163–175. [Google Scholar]
- Guyot G, Scoffoni C, Sack L. 2012. Combined impacts of irradiance and dehydration on leaf hydraulic conductance: insights into vulnerability and stomatal control. Plant, Cell & Environment 35: 857–871. [DOI] [PubMed] [Google Scholar]
- Hao GY, Lucero ME, Sanderson SC, Zacharias EH, Holbrook NM. 2012. Polyploidy enhances the occupation of heterogeneous environments through hydraulic related trade‐offs in Atriplex canescens (Chenopodiaceae). New Phytologist 197: 970–978. [DOI] [PubMed] [Google Scholar]
- Ignazia G, Buccib SJ, Premolia AC. 2020. Stories from common gardens: water shortage differentially affects Nothofagus pumilio from contrasting precipitation regimes. Forest Ecology and Management 458: 117796. [Google Scholar]
- Jankowski A, Wyka TP, Żytkowiak R, Danusevičius D, Oleksyn J. 2019. Does climate‐related in situ variability of Scots pine (Pinus sylvestris L.) needles have a genetic basis? Evidence from common garden experiments. Tree Physiology 39: 573–589. [DOI] [PubMed] [Google Scholar]
- John GP, Scoffoni C, Buckley TN, Villar R, Poorter H, Sack L. 2017. The anatomical and compositional basis of leaf mass per area. Ecology Letters 20: 412–425. [DOI] [PubMed] [Google Scholar]
- John GP, Scoffoni C, Sack L. 2013. Allometry of cells and tissues within leaves. American Journal of Botany 100: 1936–1948. [DOI] [PubMed] [Google Scholar]
- Kim YX, Steudle E. 2007. Light and turgor affect the water permeability (aquaporins) of parenchyma cells in the midrib of leaves of Zea mays . Journal of Experimental Botany 58: 4119–4129. [DOI] [PubMed] [Google Scholar]
- Kröber W, Zhang S, Ehmig M, Bruelheide H. 2014. Linking xylem hydraulic conductivity and vulnerability to the leaf economics spectrum—a cross‐species study of 39 evergreen and deciduous broadleaved subtropical tree species. PLoS ONE 9: e109211. [DOI] [PMC free article] [PubMed] [Google Scholar]
- Laur J, Hacke UG. 2014. The role of water channel proteins in facilitating recovery of leaf hydraulic conductance from water stress in Populus trichocarpa . PLoS ONE 9: e111751. [DOI] [PMC free article] [PubMed] [Google Scholar]
- Lenz TI, Wright IJ, Westoby M. 2006. Interrelations among pressure–volume curve traits across species and water availability gradients. Physiologia Plantarum 127: 423–433. [Google Scholar]
- Lovisolo C, Perrone I, Hartung W, Schubert A. 2008. An abscisic acid‐related reduced transpiration promotes gradual embolism repair when grapevines are rehydrated after drought. New Phytologist 180: 642–651. [DOI] [PubMed] [Google Scholar]
- Maherali H, Pockman WT, Jackson RB. 2004. Adaptive variation in the vulnerability of woody plants to xylem cavitation. Ecology 85: 2184–2199. [Google Scholar]
- Mason CM, Donovan LA. 2015. Evolution of the leaf economics spectrum in herbs: Evidence from environmental divergences in leaf physiology across Helianthus (Asteraceae). Evolution 69: 2705–2720. [DOI] [PubMed] [Google Scholar]
- McAdam SA. 2015. Physicochemical quantification of abscisic acid levels in plant tissues with an added internal standard by ultra‐performance liquid chromatography. Bio‐Protocol 5: 1–13. [Google Scholar]
- McAdam SA, Brodribb TJ. 2015. Hormonal dynamics contributes to divergence in seasonal stomatal behaviour in a monsoonal plant community. Plant, Cell & Environment 38: 423–432. [DOI] [PubMed] [Google Scholar]
- Nardini A, Luglio J. 2014. Leaf hydraulic capacity and drought vulnerability: possible trade‐offs and correlations with climate across three major biomes. Functional Ecology 28: 810–818. [Google Scholar]
- Nardini A, Õunapuu‐Pikas E, Savi T. 2014. When smaller is better: leaf hydraulic conductance and drought vulnerability correlate to leaf size and venation density across four Coffea arabica genotypes. Functional Plant Biology 41: 972–982. [DOI] [PubMed] [Google Scholar]
- Nardini A, Pedá G, Rocca NL. 2012. Trade‐offs between leaf hydraulic capacity and drought vulnerability: morpho‐anatomical bases, carbon costs and ecological consequences. New Phytologist 196: 788–798. [DOI] [PubMed] [Google Scholar]
- Negin B, Moshelion M. 2016. The evolution of the role of ABA in the regulation of water‐use efficiency: from biochemical mechanisms to stomatal conductance. Plant Science 251: 82–89. [DOI] [PubMed] [Google Scholar]
- Ocheltree TW, Nippert JB, Prasad PV. 2016. A safety vs efficiency trade‐off identified in the hydraulic pathway of grass leaves is decoupled from photosynthesis, stomatal conductance and precipitation. New Phytologist 210: 97–107. [DOI] [PubMed] [Google Scholar]
- Ohtsuka A, Sack L, Taneda H. 2018. Bundle sheath lignification mediates the linkage of leaf hydraulics and venation. Plant, Cell & Environment 41: 342–353. [DOI] [PubMed] [Google Scholar]
- Pantin F, Monnet F, Jannaud D, Costa JM, Renaud J, Muller B, Simonneau T, Genty B. 2013. The dual effect of abscisic acid on stomata. New Phytologist 197: 65–72. [DOI] [PubMed] [Google Scholar]
- Pfautsch S, Harbusch M, Wesolowski A, Smith R, Macfarlane C, Tjoelker MG, Reich PB, Adams MA. 2016. Climate determines vascular traits in the ecologically diverse genus Eucalyptus . Ecology Letters 19: 240–248. [DOI] [PubMed] [Google Scholar]
- Pittermann J. 2010. The evolution of water transport in plants: an integrated approach. Geobiology 8: 112–139. [DOI] [PubMed] [Google Scholar]
- Pockman WT, Sperry JS. 2000. Vulnerability to xylem cavitation and the distribution of Sonoran Desert vegetation. American Journal of Botany 87: 1287–1299. [PubMed] [Google Scholar]
- Prado K, Boursiac Y, Tournaire‐Roux C, Monneuse JM, Postaire O, DaInes O, Schäffner AR, Hem S, Santoni V, Maurela C. 2013. Regulation of Arabidopsis leaf hydraulics involves light‐dependent phosphorylation of aquaporins in veins. The Plant Cell 25: 1029–1039. [DOI] [PMC free article] [PubMed] [Google Scholar]
- Sack L, Buckley TN, Scoffoni C. 2016. Why are leaves hydraulically vulnerable? Journal of Experimental Botany 67: 4917. [DOI] [PMC free article] [PubMed] [Google Scholar]
- Sack L, Cowan P, Jaikumar N, Holbrook N. 2003. The ‘hydrology’ of leaves: co‐ordination of structure and function in temperate woody species. Plant, Cell & Environment 26: 1343–1356. [Google Scholar]
- Sack L, Frole K. 2006. Leaf structural diversity is related to hydraulic capacity in tropical rain forest trees. Ecology 87: 483–491. [DOI] [PubMed] [Google Scholar]
- Sack L, Melcher PJ, Zwieniecki MA, Holbrook NM. 2002. The hydraulic conductance of the angiosperm leaf lamina: a comparison of three measurement methods. Journal of Experimental Botany 53: 2177–2184. [DOI] [PubMed] [Google Scholar]
- Sack L, Pasquet‐Kok J, Contributors P. 2011. Leaf pressure‐volume curve parameters . PrometheusWiki website: [WWW document] URL http://prometheuswiki.org/tiki-index.php?page=Leaf+pressure-volume+curve+parameters [accessed 2 November 2019].
- Sack L, Scoffoni C. 2012. Measurement of leaf hydraulic conductance and stomatal conductance and their responses to irradiance and dehydration using the evaporative flux method (EFM). Journal of Visualized Experiments 70: e4179. [DOI] [PMC free article] [PubMed] [Google Scholar]
- Sack L, Scoffoni C. 2013. Leaf venation: structure, function, development, evolution, ecology and applications in the past, present and future. New Phytologist 198: 983–1000. [DOI] [PubMed] [Google Scholar]
- Scoffoni C, Albuquerque C, Brodersen CR, Townes SV, John GP, Bartlett MK, Buckley TN, McElrone AJ, Sack L. 2017. Outside‐xylem vulnerability, not xylem embolism, controls leaf hydraulic decline during dehydration. Plant Physiology 173: 1197–1210. [DOI] [PMC free article] [PubMed] [Google Scholar]
- Scoffoni C, Albuquerque C, Fletcher LR, Buckley TN, Bartlett MK, Caringella MA, Brodersen CR, Jansen S, Cochard H, McElrone AJ. 2018. Control of gas‐exchange by leaf outside‐xylem hydraulic conductance in Arabidopsis thaliana . Plant Physiology. 178: 1584–1601. [DOI] [PMC free article] [PubMed] [Google Scholar]
- Scoffoni C, Chatelet DS, Pasquet‐kok J, Rawls M, Donoghue MJ, Edwards EJ, Sack L. 2016. Hydraulic basis for the evolution of photosynthetic productivity. Nature Plants 2: 1–8. [DOI] [PubMed] [Google Scholar]
- Scoffoni C, Kunkle J, Pasquet‐Kok J, Vuong C, Patel AJ, Montgomery RA, Givnish TJ, Sack L. 2015. Light‐induced plasticity in leaf hydraulics, venation, anatomy, and gas exchange in ecologically diverse Hawaiian lobeliads. New Phytologist 207: 43–58. [DOI] [PubMed] [Google Scholar]
- Scoffoni C, McKown AD, Rawls M, Sack L. 2012. Dynamics of leaf hydraulic conductance with water status: quantification and analysis of species differences under steady state. Journal of Experimental Botany 63: 643–658. [DOI] [PMC free article] [PubMed] [Google Scholar]
- Scoffoni C, Rawls M, McKown A, Cochard H, Sack L. 2011. Decline of leaf hydraulic conductance with dehydration: relationship to leaf size and venation architecture. Plant Physiology 156: 832–843. [DOI] [PMC free article] [PubMed] [Google Scholar]
- Scoffoni C, Sack L. 2017. The causes and consequences of leaf hydraulic decline with dehydration. Journal of Experimental Botany 68: 4479–4496. [DOI] [PubMed] [Google Scholar]
- Scoffoni C, Vuong C, Diep S, Cochard H, Sack L. 2014. Leaf shrinkage with dehydration: coordination with hydraulic vulnerability and drought tolerance. Plant Physiology 164: 1772–1788. [DOI] [PMC free article] [PubMed] [Google Scholar]
- Seo M, Koshiba T. 2002. Complex regulation of ABA biosynthesis in plants. Trends in Plant Science 7: 41–48. [DOI] [PubMed] [Google Scholar]
- Shatil‐Cohen A, Attia Z, Moshelion M. 2011. Bundle‐sheath cell regulation of xylem‐mesophyll water transport via aquaporins under drought stress: a target of xylem‐borne ABA? The Plant Journal 67: 72–80. [DOI] [PubMed] [Google Scholar]
- Song JS, Wang Z, Sun GZ, Gao HW. 2007. Study on the tissue culture of Horqin peashrub. Acta Agrestia Sinica 15: 66–69. [Google Scholar]
- Sperry JS, Hacke UG, Pittermann J. 2006. Size and function in conifer tracheids and angiosperm vessels. American Journal of Botany 93: 1490–1500. [DOI] [PubMed] [Google Scholar]
- Trifiló P, Raimondo F, Savi T, Lo Gullo MA, Nardini A. 2016. The contribution of vascular and extra‐vascular water pathways to drought‐induced decline of leaf hydraulic conductance. Journal of Experimental Botany 67: 5029–5039. [DOI] [PubMed] [Google Scholar]
- Trueba S, Pan R, Scoffoni C, John GP, Davis SD, Sack L. 2019. Thresholds for leaf damage due to dehydration: declines of hydraulic function, stomatal conductance and cellular integrity precede those for photochemistry. New Phytologist 223: 134–149. [DOI] [PubMed] [Google Scholar]
- Turner NC. 1988. Measurement of plant water status by the pressure chamber technique. Irrigation Science 9: 289–308. [Google Scholar]
- Wang X, Du T, Huang J, Peng S, Xiong D. 2018. Leaf hydraulic vulnerability triggers the decline in stomatal and mesophyll conductance during drought in rice. Journal of Experimental Botany 69: 4033–4045. [DOI] [PMC free article] [PubMed] [Google Scholar]
- Wheeler JK, Sperry JS, Hacke UG, Hoang N. 2005. Inter‐vessel pitting and cavitation in woody Rosaceae and other vesselled plants: a basis for a safety versus efficiency trade‐off in xylem transport. Plant, Cell & Environment 28: 800–812. [Google Scholar]
- Xiong D, Nadal M. 2020. Linking water relations and hydraulics with photosynthesis. The Plant Journal 101: 800–815. [DOI] [PubMed] [Google Scholar]
- Zhang M, Fritsch PW, Cruz BC. 2009. Phylogeny of Caragana (Fabaceae) based on DNA sequence data from rbcL, trnS–trnG, and ITS. Molecular Phylogenetics and Evolution 50: 547–559. [DOI] [PubMed] [Google Scholar]
- Zhang M, Xue J, Zhang Q, Sanderson SC. 2015. Inferring ancestral distribution area and survival vegetation of Caragana (Fabaceae) in Tertiary. Plant Systematics and Evolution 301: 1831–1842. [Google Scholar]
Associated Data
This section collects any data citations, data availability statements, or supplementary materials included in this article.
Supplementary Materials
Fig. S1 Response of leaf hydraulic conductance to dehydration in 10 Caragana species.
Fig. S2 Response of stomatal conductance to dehydration in six Caragana species.
Fig. S3 Relationship between maximum stomatal conductance and mean annual precipitation and maximum leaf hydraulic conductance in 10 Caragana species.
Fig. S4 Relationship between leaf water potential at 50% loss of stomatal conductance and mean annual precipitation in six Caragana species.
Fig. S5 Response of leaf photosynthesis to dehydration in six Caragana species.
Fig. S6 Variation in leaf venation architecture across 10 Caragana species.
Fig. S7 Variation in leaf water potential at which leaf conduits reached 12% and 50% cumulative embolism in 1° and 2° vein orders in six Caragana species.
Fig. S8 Relationships between leaf hydraulics and embolism resistance across six Caragana species.
Methods S1 Additional materials and methods.
Table S1 The ploidy, location and environment at the collection sites of the 10 Caragana species.
Table S2 Summary of 37 morphological, anatomical and physiological traits and results of analysis of variance for the difference across species (one‐way ANOVAs) and between species from low‐ vs high‐rainfall environments (t‐test).
Table S3 Leaf mass per unit area and water relations characteristics of the 10 Caragana species used in this study.
Video S1 Progression of embolism in Caragana korshniskii (animated version of Fig. 6g).
Video S2 Progression of embolism in Caragana sinica (animated version of Fig. 6h).
Please note: Wiley Blackwell are not responsible for the content or functionality of any Supporting Information supplied by the authors. Any queries (other than missing material) should be directed to the New Phytologist Central Office.
Data Availability Statement
The data for the morphological, anatomical and physiological traits that support the findings of this study are available in the form of a supplementary Excel file. Additional information is available from the corresponding authors upon reasonable request.