Liang and Yang show that the activity of TMEM16F, a scramblase and ion channel, is regulated by intracellular pH in a Ca2+-dependent manner. The effects of pH in TMEM16F activity stem from competition between protons and Ca2+ for the main Ca2+-binding residues in the channel.
Abstract
TMEM16F, a dual-function phospholipid scramblase and ion channel, is important in blood coagulation, skeleton development, HIV infection, and cell fusion. Despite advances in understanding its structure and activation mechanism, how TMEM16F is regulated by intracellular factors remains largely elusive. Here we report that TMEM16F lipid scrambling and ion channel activities are strongly influenced by intracellular pH (pHi). We found that low pHi attenuates, whereas high pHi potentiates, TMEM16F channel and scramblase activation under physiological concentrations of intracellular Ca2+ ([Ca2+]i). We further demonstrate that TMEM16F pHi sensitivity depends on [Ca2+]i and exhibits a bell-shaped relationship with [Ca2+]i: TMEM16F channel activation becomes increasingly pHi sensitive from resting [Ca2+]i to micromolar [Ca2+]i, but when [Ca2+]i increases beyond 15 µM, pHi sensitivity gradually diminishes. The mutation of a Ca2+-binding residue that markedly reduces TMEM16F Ca2+ sensitivity (E667Q) maintains the bell-shaped relationship between pHi sensitivity and Ca2+ but causes a dramatic shift of the peak [Ca2+]i from 15 µM to 3 mM. Our biophysical characterizations thus pinpoint that the pHi regulatory effects on TMEM16F stem from the competition between Ca2+ and protons for the primary Ca2+-binding residues in the pore. Within the physiological [Ca2+]i range, the protonation state of the primary Ca2+-binding sites influences Ca2+ binding and regulates TMEM16F activation. Our findings thus uncover a regulatory mechanism of TMEM16F by pHi and shine light on our understanding of the pathophysiological roles of TMEM16F in diseases with dysregulated pHi, including cancer.
Introduction
The mammalian TMEM16 family consists of 10 members. TMEM16A and TMEM16B are Ca2+-activated Cl− channels (CaCCs), which participate in fluid secretion, smooth muscle contraction, gut motility, nociception, motor learning, anxiety, and cancer (Hartzell et al., 2005; Caputo et al., 2008; Yang et al., 2008; Schroeder et al., 2008; Berg et al., 2012; Cho et al., 2012; Huang et al., 2012; Pedemonte and Galietta, 2014; Oh and Jung, 2016; Whitlock and Hartzell, 2017; Zhang et al., 2017; Crottès and Jan, 2019; Li et al., 2019). The majority of the other TMEM16 members are likely not CaCCs (Suzuki et al., 2010; Yang et al., 2012; Huang et al., 2013; Suzuki et al., 2014; Whitlock et al., 2018; Bushell et al., 2019). As one of the most studied TMEM16 proteins, TMEM16F is a dual-function, Ca2+-activated, nonselective ion channel and Ca2+-activated phospholipid scramblase (CaPLSase) that mediates phospholipid flip-flop across membrane lipid bilayers and rapidly destroys the asymmetric distribution of phospholipids on cell membranes (Suzuki et al., 2010; Yang et al., 2012). TMEM16F-mediated cell surface exposure of phosphatidylserine (PS), an amino-phospholipid concentrated in the inner leaflet of the plasma membrane, is essential for a number of cellular and physiological processes, including blood coagulation (Suzuki et al., 2010; Yang et al., 2012), skeleton development (Ehlen et al., 2013; Ousingsawat et al., 2015), viral infection (Zaitseva et al., 2017), membrane microparticle release (Fujii et al., 2015), cell–cell fusion, and placental development (Zhang et al., 2020). The loss-of-function mutations of human TMEM16F cause Scott syndrome, a mild bleeding disorder characterized by a deficiency in CaPLSase-mediated PS exposure and subsequent defects on prothrombinase assembly, thrombin generation, and blood coagulation (Suzuki et al., 2010; Castoldi et al., 2011). Conversely, TMEM16F-deficient mice resist thrombotic challenges, suggesting that TMEM16F CaPLSase has the potential to serve as a promising therapeutic target for thrombotic disorders such as stroke, deep vein thrombosis, and heart attack (Yang et al., 2012). Given its importance in health and disease, it is thus urgent to understand the molecular mechanisms and cellular functions of TMEM16F.
Recent structural and functional studies have advanced our understanding of the molecular architecture and the activation mechanism of TMEM16 CaPLSases (Pedemonte and Galietta, 2014; Brunner et al., 2016; Whitlock and Hartzell, 2017; Falzone et al., 2018). The pore-gate domain of TMEM16 proteins consists of not only the permeation pathway for phospholipids and ions, but also two highly conserved Ca2+ binding sites (Yu et al., 2012; Brunner et al., 2014; Tien et al., 2014). Binding of intracellular Ca2+ triggers conformational changes, which lead to the opening of the activation gates and subsequent lipid and ion permeation (Dang et al., 2017; Paulino et al., 2017; Alvadia et al., 2019; Bushell et al., 2019; Feng et al., 2019; Le et al., 2019b). In addition to intracellular Ca2+ concentration ([Ca2+]i), membrane depolarization can also facilitate the activation of TMEM16 CaCCs and TMEM16F ion channels (Caputo et al., 2008; Schroeder et al., 2008; Yang et al., 2008, 2012). In contrast to the comprehensive understanding of their activation mechanisms, the regulatory mechanisms of TMEM16 proteins has just begun to emerge.
Phosphatidylinositol (4,5)-bisphosphate (PIP2) was recently shown to play a critical role in regulating TMEM16A and TMEM16F ion channel rundown or desensitization (Ta et al., 2017; De Jesús-Pérez et al., 2018; Ye et al., 2018; Le et al., 2019a; Tembo et al., 2019; Yu et al., 2019). In addition, both intracellular and extracellular pH have also been reported to regulate endogenous CaCCs (Arreola et al., 1995; Park and Brown, 1995; Qu and Hartzell, 2000) and heterologous expressed TMEM16A CaCCs (Chun et al., 2015; Cruz-Rangel et al., 2017; Segura-Covarrubias et al., 2020). The Oh laboratory recently reported that intracellular protons can inhibit TMEM16A CaCC by competing with Ca2+ on binding to the Ca2+ binding sites instead of affecting intracellular histidine residues (Chun et al., 2015). While it was previously reported that TMEM16F channel activity can be modulated by intracellular pH (pHi; Chun et al., 2015), it is not known whether its phospholipid scrambling activity can also be regulated by pHi, nor is the mechanism by which pHi modulates both ion channel and scrambling activities of TMEM16F understood. Interestingly, TMEM16F is highly expressed in various tumor cells including pancreatic ductal adenocarcinoma cells (Wang et al., 2018) and glioma cells (Xuan et al., 2019). Consistent with its high expression levels, TMEM16F has been implicated in tumor cell proliferation, migration, and metastasis (Jacobsen et al., 2013; Wang et al., 2018; Xuan et al., 2019). Given the fact that pH dysregulation (intracellular alkalization to pHi 7.3–7.6 and extracellular acidification to pH 6.8–7.0) is one of the hallmarks of cancer (Webb et al., 2011; White et al., 2017), it is thus critical to understand whether pHi can regulate TMEM16F ion channel and CaPLSase activities.
In this study, we used patch-clamp and fluorescence imaging methods to systematically characterize the impacts of pHi on TMEM16F activation. Our results show that intracellular acidification attenuates, whereas intracellular alkalization potentiates, both TMEM16F ion channel and CaPLSase activities under physiological [Ca2+]i. pHi mainly affects TMEM16F Ca2+-dependent activation. Our biophysical analysis and mutagenesis studies further demonstrate that the pHi regulatory effects on TMEM16F stem from the protonation and deprotonation of the Ca2+ binding residues, which in turn reduces and enhances Ca2+ binding affinity, respectively. Our findings thus uncover a new regulatory mechanism of TMEM16F that will facilitate our understanding of the physiological and pathological functions of TMEM16F and other TMEM16 family members in health and disease.
Materials and methods
Cell lines and culture
HEK293T cells are authenticated by the Duke Cell Culture Facility. The HEK293T cell line with stable expression of C-terminally eGFP-tagged mTMEM16F has been reported previously (Le et al., 2019b). The TMEM16F-deficient (knockout [KO]) HEK293T cell line was generated using CRISPR-Cas9 and has been validated in our recent studies (Le et al., 2019b, 2019c; Zhang et al., 2020). All our mutagenesis studies were conducted in TMEM16F-KO HEK293T cells. HEK293T cells were cultured with Dulbecco’s modified Eagle’s medium (DMEM; 11995-065; Gibco BRL) supplemented with 10% FBS (F2442; Sigma-Aldrich) and 1% penicillin–streptomycin (15-140-122; Gibco BRL). All cells were cultured in a humidified atmosphere with 5% CO2 at 37°C.
Mutagenesis and transfection
The murine TMEM16F (cDNA 6409332; Open Biosystems) and murine TMEM16A (cDNA 30547439; Open Biosystems) coding sequences are in the pEGFP-N1 vector, resulting in eGFP tags on their C termini. Single point mutations were generated using QuikChange site-directed mutagenesis kit (Agilent), and the majority of them have been reported in previous publications. The plasmids were transiently transfected to TMEM16F-KO HEK293T cells using X-tremeGENE9 transfection reagent (Sigma-Aldrich). Cells grown on coverslips coated with poly-L-lysine (Sigma-Aldrich) were placed in a 24-well plate. Medium was changed 6 h after transfection with either regular (11995-065; Gibco BRL) or Ca2+-free (21068-028; Gibco BRL) DMEM. Experiments proceeded 24–48 h after transfection.
Electrophysiology
All currents were recorded in either inside-out or whole-cell configurations 24–48 h after transfection using an Axopatch 200B amplifier (Molecular Devices) and the pClamp software package (Molecular Devices). Glass pipettes were pulled from borosilicate capillaries (Sutter Instruments) and fire-polished using a microforge (Narishge) to reach a resistance of 2–3 MΩ.
For inside-out patch, the pipette solution (external) contained (in mM) 140 NaCl, 10 HEPES, and 1 MgCl2, adjusted to pH 7.3 (NaOH), and the bath solution contained 140 NaCl, 10 HEPES, and 5 EGTA, adjusted to pH 7.3 (NaOH). The zero-Ca2+ internal solution contained (in mM) 140 NaCl, 10 HEPES, and 5 EGTA. To avoid the complications in controlling free Ca2+ under different pHi values, Ca2+ chelator was excluded from our Ca2+-containing internal solutions. Instead, we directly added CaCl2 into a basal internal solution containing (in mM) 140 NaCl and 10 HEPES, in the absence of Ca2+ chelator. We may have underestimated the free Ca2+ concentrations in the internal solutions, as there is a minimal amount of contaminating Ca2+ from the double-distilled water and the reagents. However, the contaminating Ca2+ in our basal solution is very low (<0.5 µM, as estimated by measuring the basal solution-induced TMEM16A-CaCC activation and fitting with a TMEM16A-CaCC dose–response curve that was constructed by Fura-2 calibrated Ca2+ solutions; Le et al., 2019a). As the contaminating Ca2+ level is low and exists in all of the pHi solutions, our conclusions were not affected. Different pH levels were adjusted with either NaOH or HCl as needed.
For whole-cell recordings, the pipette solution (internal) contained (in mM) 140 CsCl, 1 MgCl2, and 10 HEPES, plus CaCl2 to obtain the desired free Ca2+ concentration. pH was adjusted by either CsOH or HCl as desired. The bath solution contained (in mM) 140 NaCl, 10 HEPES, and 1 MgCl2, adjusted to pH 7.3 (NaOH). Procedures for solution application were as used previously (Le et al., 2019a). Briefly, a perfusion manifold with 100–200-µm tip was packed with eight PE10 tubes. Each tube was under separate valve control (ALA-VM8; ALA Scientific Instruments), and solution was applied from only one PE10 tube at a time onto the excised patches or whole-cell clamped cells. All experiments were at room temperature (22–25°C). All the chemicals for solution preparation were obtained from Sigma-Aldrich.
Phospholipid scrambling fluorometry
Phospholipid scrambling fluorometry was adapted from the method developed by the Hartzell laboratory (Yu et al., 2015). Instead of delivering and detecting current, the glass pipettes under whole-cell configuration were used to achieve precise control of pHi and Ca2+. Briefly, the cells were seeded and transfected on poly-L-lysine–coated coverslips before the experiments. Glass pipettes were prepared and filled with internal solution as mentioned in the electrophysiology section. After focusing on the cell-surface eGFP signal from the expressed TMEM16F-eGFP, the light filter set was switched to detect Annexin V-CF594 signal (594 nm). Annexin V-CF 594 (29011; Biotium) was diluted at 0.5 µg ml−1 with Annexin V (AnV) binding solution (10 mM HEPES, 140 mM NaCl, and 2.5 mM CaCl2, pH 7.4) and then added into the ALA perfusion system as mentioned above. The perfusion manifold was lowered next to the cell to be patched. Once the whole-cell configuration was established, the perfusion valve was simultaneously opened, and Anv solution was flushed to the patch-clamped cell. At the same time, image acquisition started with intervals of 5–10 s.
Data analysis
G-V curves were constructed from tail currents measured 200–400 µs after repolarization. In cases in which the tail currents were tiny, steady-state peak currents were used to build the I-V relation. For the G-V curves obtained from the same patch, the conductance was normalized to the maximal conductance obtained at pH 8.9 and the high depolarization voltage. Individual G-V curves were fitted with a Boltzmann function,
| (1) |
where Gmax denotes the fitted value for maximal conductance at a given pH, V0.5 denotes the voltage of half-maximal activation of conductance, z denotes the net charge moving across the membrane during the transition from the closed to the open state, and F denotes the Faraday constant.
Dose–response curves were fitted with the Hill equation,
| (2) |
where G/Gmax denotes current normalized to the maximum current elicited by 1,000 µM Ca2+ at given pHi, [Ca2+] denotes free Ca2+ concentration, H denotes the Hill coefficient, and EC50 denotes the half-maximal activation concentration of Ca2+.
Bell-shape fitting of the pHi sensitivity–[Ca2+]i relationship was performed with bell-shaped dose–response function of Prism software (GraphPad). Briefly, pHi sensitivity (Y) and Ca2+ concentration (X) were fitted with the following equations:
| (3) |
| (4) |
| (5) |
| (6) |
| (7) |
where Plateau1 and Plateau2 denote the plateaus at the left and right ends of the curve, which are set to be 0 in this study; Peak is the maximum value of the curve; X is the Ca2+ concentration; logEC50_1 and logEC50_2 are the concentrations that give half-maximal stimulatory and inhibitory effects in the same units as X; and nH1 and nH2 are the unitless slope factors or Hill slopes, which are set to be 1 in this study.
PDB coordinate files were downloaded from the Protein Data Bank website (https://www.rcsb.org/). All figures with TMEM16 structures were generated with Pymol software (Schrödinger, Inc.).
Quantifying phospholipid scrambling activity
To analyze the accumulation of AnV fluorescence signal on cell surfaces over time, a previously reported Matlab (Mathworks) code was used (Le et al., 2019b). Briefly, a region of interest was manually chosen around the scrambling cells, and AnV fluorescence intensity was calculated using the following equation for each frame:
| (8) |
where f equals the fluorescent intensity of each pixel and N is the number of pixels in the region of interest.
The time-dependent increase of AnV fluorescence was fitted with a generalized logistic equation (Yin et al., 2003):
| (9) |
where Fmax is the maximum normalized AnV fluorescence intensity, which is set to 100% in this study; k is the maximum growth rate (or the slope) of the linear phase in the sigmoidal curve; and t1/2 is the time point at which the fluorescent intensity reaches half of its maximum value and the fluorescence increase rate reaches its maximum.
Statistical analysis
All statistical analyses were performed with Clampfit 10.7, Excel, and Prism. Two-tailed Student’s t test was used for single comparisons between two groups (paired or unpaired), and one-way ANOVA followed by Tukey’s test was used for multiple comparisons. Data are represented as mean ± SEM unless stated otherwise. Symbols denote statistical significance as follows: *, P < 0.05; **, P < 0.01; ***, P < 0.001; ****, P < 0.0001; and ns, no significance.
Data availability
We deposited the source data file, all the video files, and the Matlab code used to analyze fluorescence images to Dyrad (https://datadryad.org/stash/dataset/doi:10.5061/dryad.b8gtht79d).
Online supplemental materials
pHi regulation on TMEM16A is presented in Fig. S1. Fig. S2 shows the TMEM16F current rundown at different pHi values. Fig. S3 shows the pHi regulation on a pore-lining residue mutation Q559K. Fig. S4 shows the lipid scrambling activity of TMEM16F-KO HEK239T cells at different pHi values. Fig. S5 shows the pHi regulation of TMEM16A at 100 µM Ca2+. Fig. S6 shows the pHi regulation on TMEM16A and TMEM16F gain-of-function mutations in the absence of intracellular Ca2+. Fig. S7 shows pHi regulation on a Ca2+ binding site near the dimer interface. Table S1 shows the comparison of pHi sensitivity of TMEM16F current measurements using Boltzmann fit and linear fit. Video 1 shows the lipid scrambling activity of HEK293T cells overexpressing TMEM16F with 100 µM Ca2+ at pHi 6.1, 7.3, and 8.9 (related to Fig. 2 B). Video 2 shows the lipid scrambling activity of TMEM16F-KO HEK293T cells with 100 µM Ca2+ at various pHi values (related to Fig. S4). Video 3 shows the lipid scrambling activity of HEK293T cells overexpressing TMEM16F with 5 µM Ca2+ at pHi 6.1, 7.3, and 8.9 (related to Fig. 4 A). Video 4 shows the lipid scrambling activity of HEK cells overexpressing TMEM16F with 1,000 µM Ca2+ at pHi 6.1, 7.3, and 8.9 (related to Fig. 4 F).
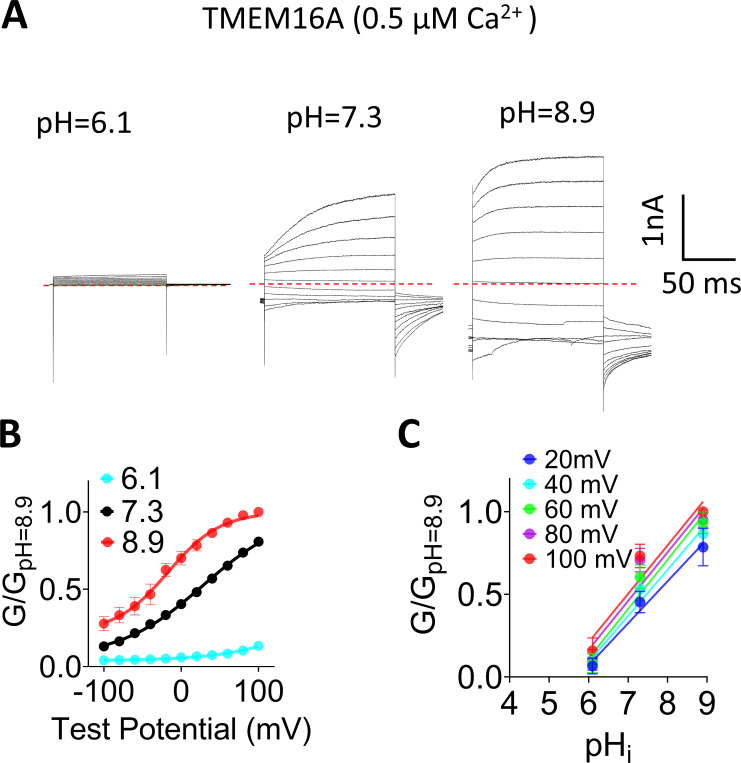
Figure S1.
pHi regulates TMEM16A ion channel activity. (A) Representative TMEM16A currents recorded from inside-out patches perfused with intracellular solutions containing 0.5 µM Ca2+ at different pHi values. Currents were elicited by voltage steps from −100 to +100 mV with 20-mV increments. The holding potential was −60 mV. All the traces shown were from the same patch. (B) Mean G-V relations of the TMEM16A channels under different pHi values at 0.5 µM Ca2+. Relative conductance was determined by measuring the amplitude of tail currents 400 µs after repolarization to a fixed membrane potential (−60 mV). The smooth curves represent Boltzmann fits: G/Gmax = 1/{1 + exp[−ze(V − V1/2)/kT]}. Gmax is tail current amplitude in response to depolarization to +100 mV in 0.5 µM Ca2+ at pHi 8.9. Error bar represents SEM (n = 7). (C) Mean conductance of TMEM16A at different pHi values was normalized to the maximum conductance at pHi 8.9 at different voltages and then plotted as a function of pHi (G-pHi relationship). Data were fitted with linear regression curves, and the mean slopes from fits were 0.27, 0.28, 0.29, 0.3, and 0.29 for 20, 40, 60, 80, and 100 mV, respectively (n = 7).
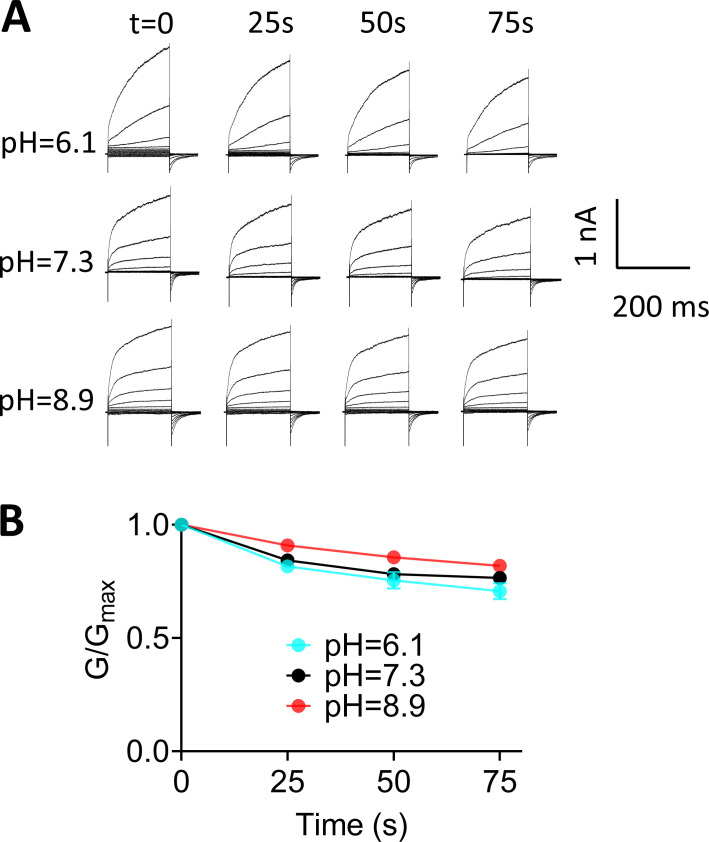
Figure S2.
Rundown of TMEM16F at different pHi values using voltage-step protocol. (A) Representative TMEM16F currents recorded from inside-out patches perfused with intracellular solutions containing 100 µM Ca2+ at different pHi values. The interval between each trace was 25 s, and all the recordings were from the same patch. (B) Normalized conductance as different time points shown in A. Error bars represent mean ± SEM (n = 4).
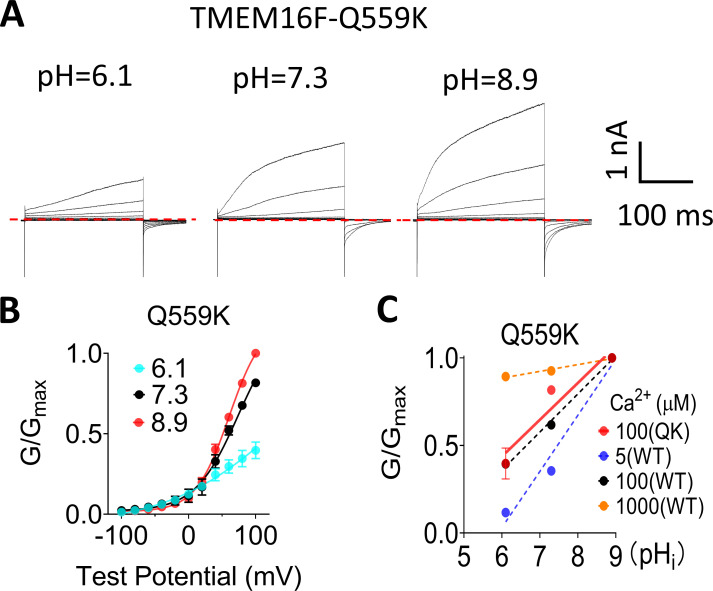
Figure S3.
Q559K, a pore lining residue mutation that eliminates channel rundown, has the same pHi sensitivity as WT TMEM16F. (A) Representative TMEM16F-Q559K currents recorded from inside-out patches perfused with intracellular solutions containing 100 µM Ca2+ at different pHi values. (B) The G-V curves of Q559K currents at different pHi values. Error bars represent SEM (n = 5). (C) The pHi sensitivity of Q559K (QK) evaluated by the G-pHi relationship. The slope of the G-pHi relationship for Q559K at 100 µM Ca2+ is 0.20 ± 0.02, shown as red solid line. The G-pHi curves of WT at different Ca2+ concentrations are also plotted as dashed lines for reference.
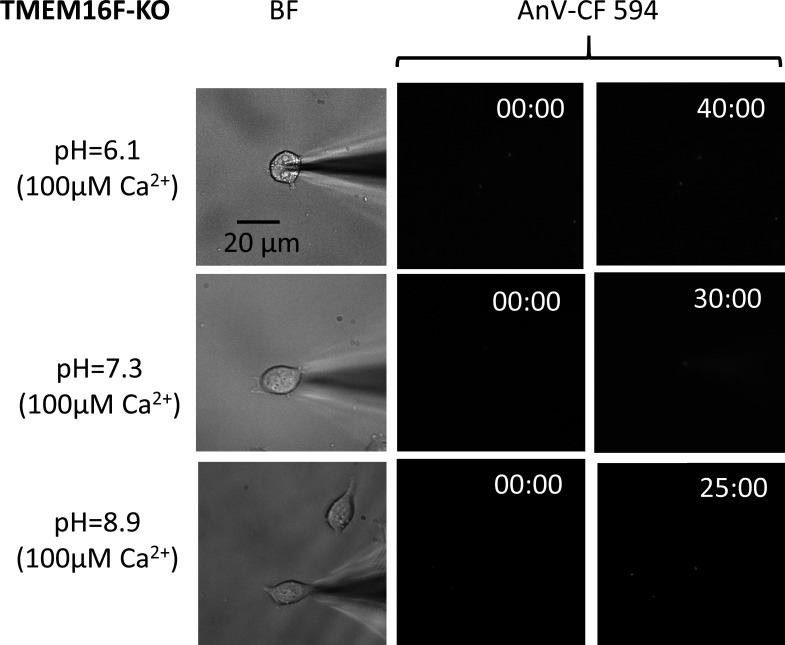
Figure S4.
TMEM16F KO HEK293T cells show no scrambling activity at all pHi values tested. Representative fluorescence intensity of AnV binding for TMEM16F-eGFP stable HEK293T and TMEM16F-KO HEK293T cells at different pHi values (n = 4 for pHi 8.9; n = 3 for pHi 6.1 and 7.3). See also Video 2.
Figure S5.
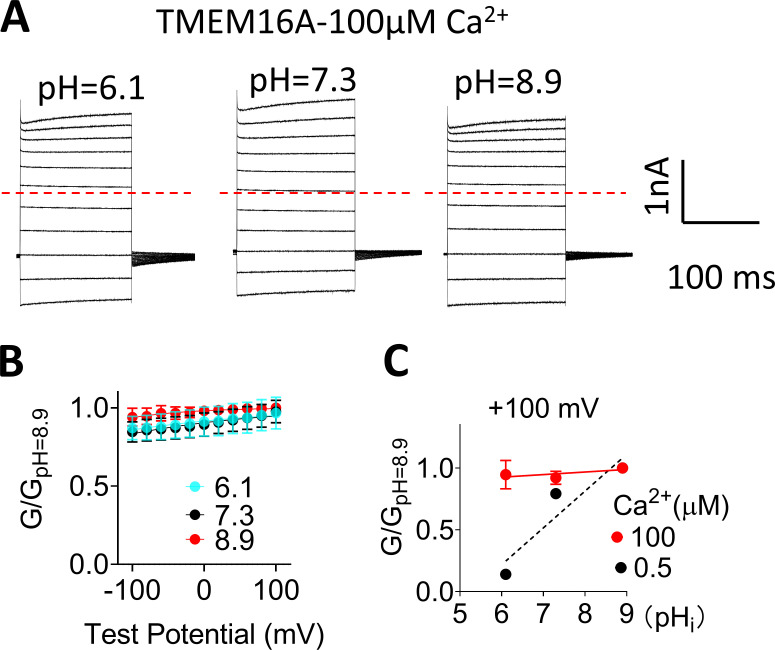
TMEM16A-CaCC loses pHi regulation under saturating Ca2+. (A) Representative TMEM16A currents recorded from inside-out patches perfused with intracellular solutions containing 100 µM Ca2+ at different pHi values. (B) G-V relationships at different pHi values under 100 µM Ca2+. All conductances were normalized to the maximum conductance at pHi 8.9 and +100 mV. Error bar represents SEM (n = 5). (C) G-pHi curve of TMEM16A at 100 µM Ca2+ (red solid line) and 0.5 µM Ca2+ (black dotted line). The slopes from linear fits are 0.02 and 0.3, respectively. Error bar represents SEM (n = 5).
Figure S6.
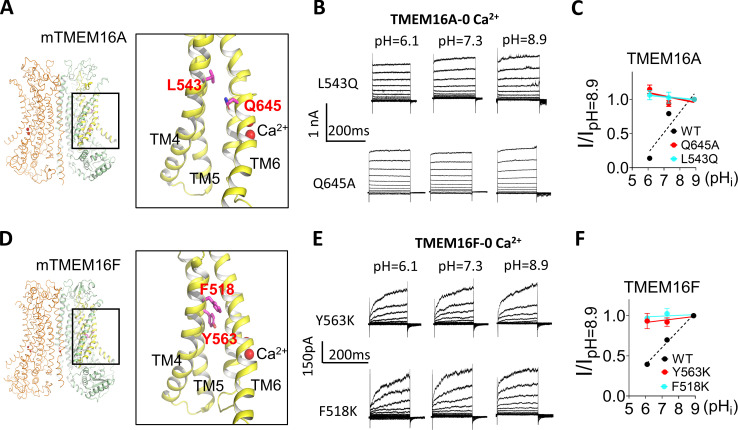
pHi has no effect on the gain-of-function TMEM16A and TMEM16F mutations when Ca2+ is absent. (A) Locations of L543 and Q645 on the TMEM16A structure (PDB 5OYB). The residue numbers correspond to TMEM16A (a). For TMEM16A (ac) splice variant, the residue numbers are L547 and Q649, respectively. (B) Representative TMEM16A-L543Q and TMEM16A-Q645A currents recorded from inside-out patches perfused with intracellular solutions containing 0 Ca2+ at different pHi values. (C) I-pHi curve of TMEM16A mutations L543Q and Q645A at 100 mV. Slopes from linear fit for L543Q and Q645A are −0.02 and −0.04, respectively. The G-pHi curve of WT under 0.5 µM Ca2 was replotted as the black dashed line. Error bars represent SEM (n = 5). (D) Locations of Y563 and F518 on the TMEM16F structure (PDB 6QP6). (E) Representative TMEM16F-Y563K and TMEM16F-F518K currents recorded from inside-out patches perfused with intracellular solutions containing 0 Ca2+ at different pHi values (F) The I-pHi relationship of TMEM16F mutations Y563K and F518K at 100 mV. Slopes from linear fit for Y563K and F518K are 0.03 and 0.01, respectively. G-pHi curve of WT under 100 µM Ca2+ was replotted as black dashed line. Error bars represent SEM (n = 5). Note that the gain-of-function mutations do not have obvious tail current under 0 Ca2+; therefore, I-pHi relations not G-pHi were plotted to evaluate their pHi sensitivities.
Figure S7.
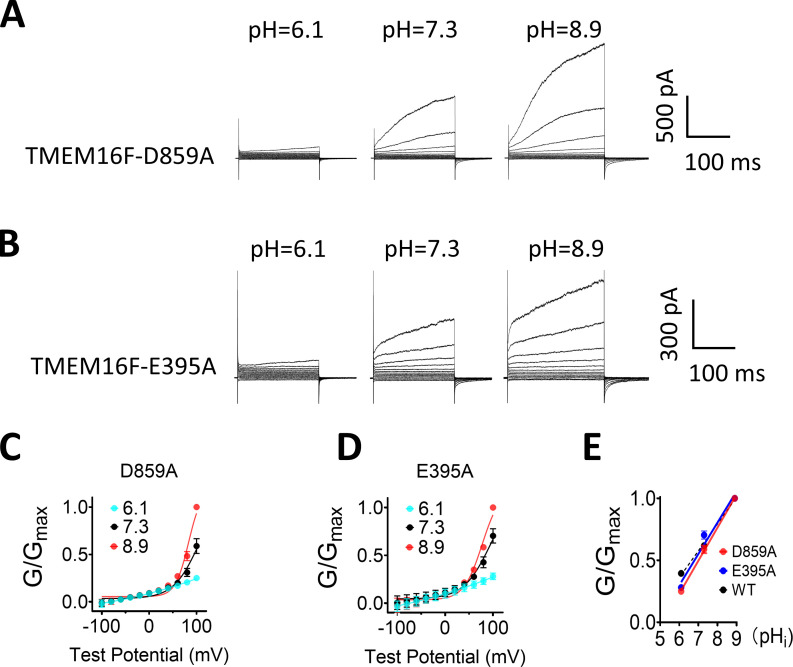
Mutations of Ca2+ site near the dimer interface do not alter pHi regulation on TMEM16F. (A and B) Representative TMEM16F-D859A and TMEM16F-E395A currents recorded from inside-out patches perfused with intracellular solutions containing 100 µM Ca2+ at different pHi values. (C and D) The G-V curves of D859A and E395A currents, respectively. Error bars represent SEM (n = 5). (E) The pHi sensitivity of D859A (red) and E395A (blue) evaluated by the G-pHi relationship. The G-pHi curves of WT at different Ca2+ concentrations were also plotted as dashed lines (black) for reference.
Video 1.
Lipid scrambling activity of HEK293T cells overexpressing TMEM16F with 100 µM Ca2+ at pHi 6.1, 7.3, and 8.9. Related to Fig. 2 B.
Figure 2.
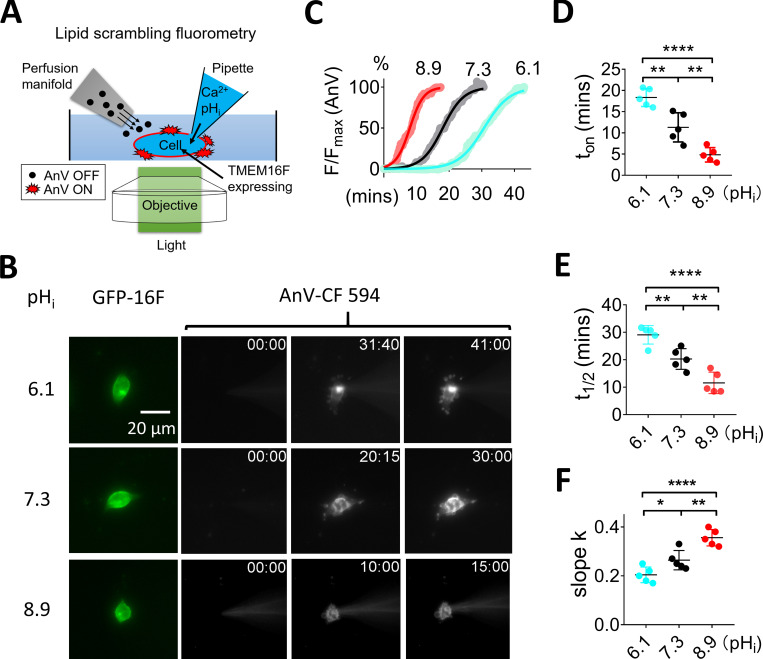
pHi regulates TMEM16F lipid scrambling activity. (A) Schematic design of the lipid scrambling fluorometry assay. CaPLSase activity is monitored by cell-surface accumulation of fluorescently tagged AnV, a PS binding protein that is continuously perfused through a perfusion manifold. AnV fluorescence remains dim in bulk solution and will strongly fluoresce after being recruited by cell surface PS, which is externalized by CaPLSases. We use whole-cell patch pipettes to deliver intracellular solutions into the cytosol to achieve precise control of pHi and Ca2+. Once breaking into whole-cell configuration, the pipette solution rapidly diffuses into the cell and activates CaPLSases. AnV fluorescence signal on the cell surface was continuously recorded with 5-s intervals. (B) Representative lipid scrambling fluorometry images of HEK293T cells stably expressed with TMEM16F-eGFP (left, green signal) at different pHi values. For the AnV-CF 594 signal on the right, the first column is fluorescence signal immediately after forming whole-cell configuration; the second column is the time when fluorescence intensity reached half maximum (t1/2), and the last column is the time when fluorescence signal reached roughly plateau. The time points (minutes followed by seconds) of each image after breaking into whole-cell configuration are shown on the top right corner. The pipette solution contained 100 µM Ca2+, and holding potential was −60 mV. See also Video 1. (C) The time course of AnV fluorescence signal at different pHi values as shown in B. The AnV signal was normalized to the maximum AnV fluorescence intensity at the end of each recording. The smooth curves represent fits to generalized logistic equation, F = Fmax/{1 + exp[−k(t − t1/2)]}. (D) Under 100 µM Ca2+, the onset times (ton), when AnV signal can be reliably detected, for pHi 6.1, 7.3, and 8.9 are 18.3 ± 1.3 (n = 5), 11.3 ± 1.4 (n = 5), and 4.5 ± 0.7 min (n = 5), respectively. (E) Under 100 µM Ca2+, t1/2 values for pHi 6.1, 7.3, and 8.9 are 29.07 ± 1.35, 20.28 ± 1.51, and 11.59 ± 1.56 min (n = 5), respectively. (F) Under 100 µM Ca2+, slopes for pHi 6.1, 7.3, and 8.9 are 0.19 ± 0.01, 0.26 ± 0.02, and 0.40 ± 0.02 (n = 5), respectively. Values represent mean ± SEM. *, P < 0.05; **, P < 0.01; ****, P < 0.0001, using one-way ANOVA followed by Tukey’s test.
Video 2.
Lipid scrambling activity of TMEM16F-KO HEK293T cells with 100 µM Ca2+ at varies pHi values. Related to Fig. S4.
Video 3.
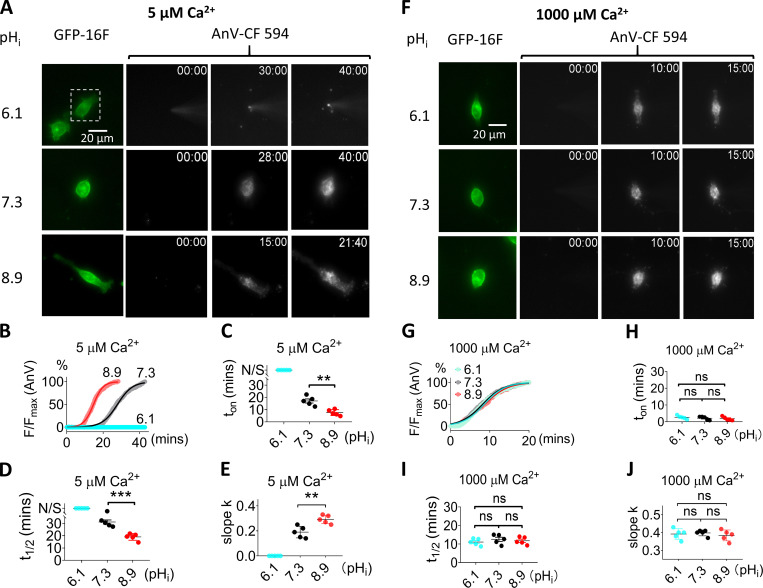
Lipid scrambling activity of HEK293T cells overexpressing TMEM16F with 5 µM Ca2+ at pHi 6.1, 7.3, and 8.9. Related to Fig. 4 A.
Figure 4.
pHi regulation of TMEM16F scrambling activity is Ca2+ dependent. (A) Representative images of TMEM16F-eGFP scrambling activity under 5 µM intracellular Ca2+ with different pHi values. The white dotted rectangles in the top row demarcate the patch-clamped TMEM16F-eGFP–expressing cells. For the AnV-CF 594 signals on the right, the first column is fluorescence signal immediately after forming whole-cell configuration; the second column is the time point (minutes followed by seconds, top right corner) when fluorescence intensity reaches half maximum (t1/2), and the last column is the time point when fluorescence reaches plateau. No obvious AnV-CF 594 signal can be detected in pHi 6.1 over 40 min. The recording interval is 10 s. See also Video 3. (B) The time courses of AnV fluorescence intensity for TMEM16F activated by 5 µM Ca2+ under different pHi values in A. The smooth curves represent fits to the logistic equation similar to Fig. 2 B. (C) The scrambling onset time (ton) at different pHi values under 5 µM Ca2+. N/S at pHi = 6.1 represents no scrambling. Error bars represent SEM (n = 5). (D) The t1/2 at different pHi values under 5 µM Ca2+. N/S at pHi = 6.1 represents no scrambling. Error bars represent SEM (n = 5). (E) The slopes at different pHi values under 5 µM Ca2+. (F) Representative images of TMEM16F-eGFP scrambling activity under 1,000 µM intracellular Ca2+ with different pHi. For the AnV-CF 594 signal on the right, the first column is fluorescence signal immediately after forming whole-cell configuration; the second column is the time point when fluorescence intensity reaches half maximum (t1/2), and the last column is the time point when fluorescence reaches plateau. See also Video 4. (G) Time courses of AnV fluorescence intensity for TMEM16F activated by 1,000 µM Ca2+ under diff,erent pHi values in F. The smooth curves represent fits to the logistic equation. (H) The scrambling onset time (ton) at different pHi values under 1,000 µM Ca2+. Error bars represent SEM (n = 5). (I) The t1/2 of lipid scrambling at different pHi values under 1,000 µM Ca2+. (J) The slopes (k) at different pHi values under 1,000 µM Ca2+. Error bars represent SEM (n = 5). Statistics were analyzed using one-way ANOVA followed by Tukey’s test. **, P < 0.01; ***, P < 0.001; ns (not significant), P > 0.05.
Video 4.
Lipid scrambling activity of HEK cells overexpressing TMEM16F with 1,000 µM Ca2+ at pHi 6.1, 7.3, and 8.9. Related to Fig. 4 F.
Results
pHi regulates TMEM16F ion channel activity
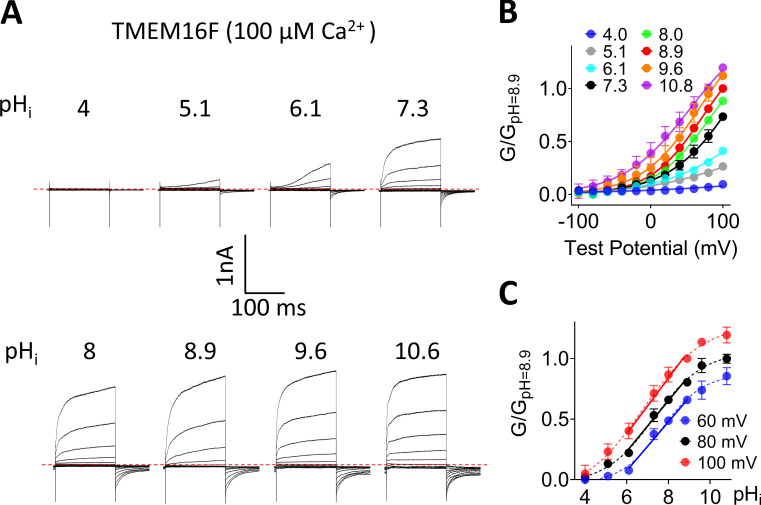
We first evaluated the pHi effect on TMEM16F ion channel activity. Instead of using the gap-free protocol at fixed membrane voltages in a previous study (Chun et al., 2015), we used inside-out patches to measure TMEM16F current activation across a wide range of voltages under different pHi values so that the G-V relationships can be constructed and the pHi effects can be compared at different values of pHi, voltage, and [Ca2+]i. Consistent with the previous report (Chun et al., 2015), our analysis shows that low pHi (<7.3) greatly suppresses TMEM16F channel activity. In addition, our recordings show that alkalized pHi (>7.3) greatly potentiates TMEM16F current in a pHi-dependent fashion compared with a physiological pHi of 7.3 (Fig. 1, A and B).
Figure 1.
pHi regulates TMEM16F ion channel activity. (A) Representative TMEM16F currents recorded from inside-out patches perfused with intracellular solutions containing 100 µM Ca2+ at different pHi values. Currents were evoked by voltage steps from −100 to +100 mV with 20 mV increments, and the holding potential was −60 mV. All traces shown were from the same patch. (B) Mean G-V relations of the TMEM16F channels under different pHi values at 100 µM Ca2+. Relative conductance was determined by measuring the amplitude of tail currents 400 µs after repolarization to a fixed membrane potential (−60 mV). The smooth curves represent Boltzmann fits G/Gmax = 1/{1 + exp[−ze(V − V1/2]/kT}. Gmax is tail current amplitude in response to depolarization to +100 mV in 100 µM Ca2+ at pHi 8.9. Error bar represents SEM (n = 7). (C) G-pHi relationship for TMEM16F channels. Data were normalized to pHi 8.9. Dashed line represents Boltzmann fit. G-pHi curves from 6.1 to 8.9 were fitted with linear regression shown as the solid lines, which aligned well with the Boltzmann fits (dashed line). Thus, the mean slopes from linear regression were used as a parameter for pHi sensitivity in later experiments (n = 7).
The apparent pHi sensitivity of TMEM16F channel was assessed by plotting the conductance-pHi (G-pHi) relationship (Fig. 1 C), which results in a sigmoidal curve and saturates at pHi 10.6. Under the physiologically relevant pHi range (6.1–8.9), the linear regression aligned well with the Boltzmann sigmoidal fit, suggesting that at least in this pHi range, linear regression can be used to assess the pHi sensitivity of TMEM16F (Table S1). Moreover, our results reveal that TMEM16F pHi sensitivity is voltage independent as evidenced by the parallel G-pHi relationships at different voltages (Fig. 1 C). To further validate our measurements and quantification, we characterized the pHi effects on TMEM16A at different membrane voltages (Fig. S1). Consistent with the previous report (Chun et al., 2015), our analysis also shows that low pHi (6.1) greatly suppresses, whereas high pHi (8.9) significantly potentiates, TMEM16A activation in the presence of 0.5 µM [Ca2+]i, as evidenced by the dramatic leftward and rightward shifts of the G-V curves, respectively (Fig. S1, A and B). Similar to pHi’s effect on TMEM16F, the G-pHi relation of TMEM16A also exhibited a linear relation within the pHi range tested (6.1–8.9; Fig. S1 C). The almost identical slopes of the G-pHi plots under different membrane potentials suggest that pHi has negligible effect on TMEM16A voltage-dependent activation, which again resembles what we observed in TMEM16F (Fig. 1 C). Taken together, our patch clamp recordings reveal that pHi is an important intracellular factor to regulate both TMEM16A and TMEM16F ion channel activities.
As TMEM16F channel activity is subject to PIP2-dependent rundown or desensitization under inside-out configuration (Ye et al., 2018), we thus estimated the influence of rundown on our quantification of pHi sensitivity. As shown in Fig. S2, A and B, the peak currents elicited by a voltage-step protocol reduced only <20% under all pHi values tested within the time window to complete all the recordings shown in Fig. 1 A (∼1 min), suggesting that TMEM16F current rundown does not exert a dramatic impact on our measurements. To further reduce the influence of TMEM16F current rundown on our quantifications, we sequentially perfused different pHi solutions from low pHi to high pHi and then normalized all TMEM16F current to the maximum current at pHi 10.6, which was applied last (Fig. 1 C). If taking channel rundown into account, the pHi sensitivity of TMEM16F channel in our measurements would have been underestimated. To further validate our pHi sensitivity quantification, we measured the pHi sensitivity of Q559K (Fig. S3), a pore-lining residue mutation that shows no current rundown (Ye et al., 2018). We found that Q559K and WT TMEM16F show nearly identical pHi sensitivity (0.20 ± 0.02 and 0.22 ± 0.04, respectively) under 100 µM [Ca2+]i and +100 mV (Fig. S3 C). This experiment further demonstrated that TMEM16F current rundown has a negligible effect on our pHi sensitivity quantifications.
pHi regulates TMEM16F scrambling activity
Having shown that pHi can regulate TMEM16F ion channel activity, we next sought to examine whether pHi can also influence TMEM16F lipid scrambling activity. To quantify TMEM16F lipid scrambling at different pHi values, we used the patch clamping–lipid scrambling fluorometry dual recording assay (Yu et al., 2015) to overcome the difficulties in precisely controlling pHi and [Ca2+]i (Fig. 2 A). In this assay, pHi and [Ca2+]i are accurately controlled by solution exchange between glass pipettes and the cytosol of the whole-cell patch clamped cells. Once TMEM16F is activated by [Ca2+]i, AnV starts to be attracted to the cell surface by the externalized PS, after a delay (Fig. 2 B and Video 1). The fluorescence signal accumulated on the cell surface increases over time and exhibits a sigmoid relationship with time (Fig. 2 C). At physiological pHi of 7.3, 100 µM [Ca2+]i activates TMEM16F lipid scramblases with an average onset time (ton) of 11.3 min (Fig. 2 D), which is comparable with previous reports (Grubb et al., 2013; Yu et al., 2015). We found that intracellular alkalization (pHi 8.9) markedly shortened ton to ∼4.5 min. In stark contrast, intracellular acidification (pHi 6.1) significantly prolonged ton to 18.3 min. By fitting the curve with a generalized logistic function, we can obtain t1/2, the time needed to reach half-maximum fluorescence when the macroscopic CaPLSase activity reaches maximum speed. At physiological pHi of 7.3, 100 µM [Ca2+]i activates TMEM16F lipid scramblases with an average t1/2 of 20.3 min (Fig. 2 E). We found that intracellular alkalization (pHi 8.9) markedly shortened t1/2 to ∼11.6 min. In stark contrast, intracellular acidification (pHi 6.1) significantly prolonged t1/2 to 29.1 min. The changes of t1/2 under different pHi values indicate that low pHi attenuates, and high pHi enhances, TMEM16F CaPLSase activities. We also quantified the maximum lipid scrambling rate at t1/2, or the slope (k) of the linear phase on the sigmoid curves under different pHi values. We found that low pHi (6.1) significantly reduced slope k from 0.26 at physiological pHi to 0.19, whereas high pHi (8.9) increased slope k to 0.4 (Fig. 2 F), suggesting that pHi affects the maximum lipid scrambling rate of TMEM16F.
To ensure that enhanced PS externalization at high pHi is mediated by TMEM16F CaPLSases instead of other mechanisms such as alkalization-induced apoptosis (Lagadic-Gossmann et al., 2004), we used the patch-fluorometry assay to measure our TMEM16F KO HEK293T cells, which lack endogenous CaPLSase activity (Le et al., 2019c), at pHi values ranging from 6.1 to 8.9. In stark contrast to fast lipid scrambling in TMEM16F-stable HEK293T cells (Fig. 2 C), we did not observe any obvious AnV binding to the TMEM16F KO cells over 25–40 min (Fig. S4 and Video 2). This experiment suggests that apoptosis-induced PS exposure is unlikely to contribute to the pHi effects on TMEM16F CaPLSases under our experimental conditions.
In summary, our patch lipid scrambling–fluorometry measurement demonstrated that TMEM16F CaPLSase activity is also regulated by pHi. By carefully quantifying the effects of pHi on TMEM16F CaPLSase activity, we obtained three parameters, ton, t1/2, and slope k, to evaluate CaPLSase activity (see Discussion for detailed explanation on the physical meaning of these parameters). The changes of the three parameters under different pHi values explicitly demonstrate that TMEM16F CaPLSase activity (Fig. 2), similar to its ion channel activity (Fig. 1, A–C), is highly sensitive to pHi regulation. Under physiological pHi, intracellular acidification suppresses TMEM16F CaPLSase and ion channel activation, whereas intracellular alkalization enhances TMEM16F activation. This implies that the pHi effects on TMEM16F ion channel and lipid scrambling might share the same molecular mechanism.
pHi regulation of TMEM16F ion channel activity is Ca2+ dependent
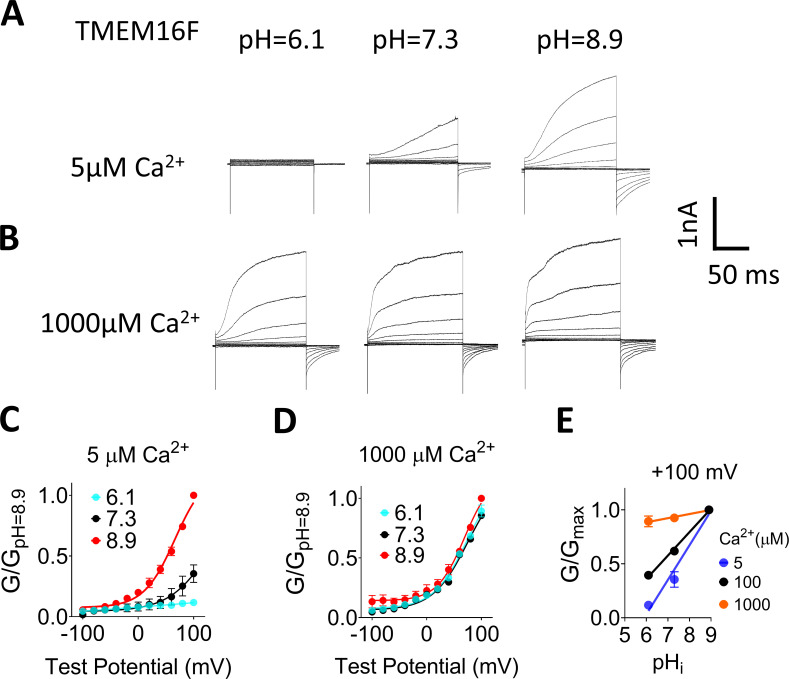
As lowering pHi has been reported to inhibit Ca2+-dependent activation of TMEM16A (Chun et al., 2015), we next examined whether pHi’s effect on TMEM16F channel activation is also through influencing its Ca2+ dependence, by comparing the pHi effects under 5, 100, and 1,000 µM [Ca2+]i. Under 5 µM [Ca2+]i, TMEM16F channel activation is strongly pHi dependent (Fig. 3, A and C). The apparent pHi sensitivity at 100 mV under 5 µM [Ca2+]i increases to ∼0.32 compared with 0.22 under 100 µM [Ca2+]i, suggesting that TMEM16F pHi sensitivity is enhanced when [Ca2+]i is low (Fig. 3 E). In contrast, the pHi effect is almost completely diminished when [Ca2+]i is increased to 1,000 µM, as seen by the robust and almost identical activation of TMEM16F current from pHi 6.1 to 8.9 and nearly flat G-pHi relationships (Fig. 3, B, D, and E). Consistently, when saturating [Ca2+]i (100 µM) was applied to TMEM16A-CaCC at different pHi values, the pHi effect on TMEM16A also diminished (Fig. S5). Our results thus demonstrate that the pHi regulation of TMEM16F and TMEM16A channel is highly Ca2+ dependent: lower [Ca2+]i enhances pHi sensitivity, whereas saturating [Ca2+]i (1,000 µM for TMEM16F and 100 µM for TMEM16A) eliminates pHi sensitivity.
Figure 3.
pHi regulation of TMEM16F channel activity is Ca2+ dependent. (A and B) Representative TMEM16F currents recorded from inside-out patches perfused with intracellular solutions containing 5 and 1,000 µM Ca2+, respectively. All traces shown in each panel were from the same patch. Currents were elicited by voltage steps from −100 to +100 mV with 20-mV increments. The holding potential was −60 mV. (C and D) Mean G-V relations of the TMEM16F currents from A and B, respectively. Relative conductance was determined by measuring the amplitude of tail currents 400 µs after repolarization to a fixed membrane potential (−60 mV). The smooth curves represent Boltzmann fits. Error bars represent SEM (n = 5). (E) pHi sensitivity of TMEM16F current at +100 mV was measured by the slope of the the G-pHi relationship. Mean conductance at different Ca2+ concentrations was normalized to the maximum conductance at pHi 8.9 and +100 mV. Averaged slopes from linear fit for 5 and 1,000 µM Ca2+ were 0.32 and 0.04, respectively. The G-pHi curve at 100 µM Ca2+ was replotted as black line for reference. Error bars represent SD (n = 5).
TMEM16F channel activation requires both [Ca2+]i and membrane depolarization (Yang et al., 2012). To assess the influence of pHi on voltage-dependent activation, we examined the gain-of-function mutations in the pore—namely TMEM16A-Q645A, TMEM16A-L543Q (Fig. S6 A), TMEM16F-F518K, and TMEM16F-Y563K (Fig. S6 D; Peters et al., 2018; Le et al., 2019b)—whose opening can be activated solely by membrane depolarization (Fig. S6, B and E). Our results show that in the absence of Ca2+, the pHi effects on the gain-of-function TMEM16A (Fig. S6, B and C) and TMEM16F mutant channels (Fig. S6, E and F) are almost entirely abolished, as evidenced by the nearly flat I-pHi curves for all the gain-of-function mutations (Fig. S6, C and F). Taken together, our biophysical characterizations showed that pHi specifically regulates the Ca2+-dependent activation of TMEM16A and TMEM16F ion channels.
pHi regulation of TMEM16F lipid scrambling activity is Ca2+ dependent
We next addressed whether the pHi regulation on TMEM16F lipid scrambling is also [Ca2+]i dependent, using the patch-lipid scrambling fluorometry assay (Fig. 2 A). Under 5 µM [Ca2+]i, TMEM16F lipid scrambling is strongly pHi dependent (Fig. 4, A and B; and Video 3). However, compared with 100 µM [Ca2+]i, ton and t1/2 under 5 µM [Ca2+]i are significantly delayed at pHi 7.3 and 8.9 (Fig. 4, C and D). In addition, the maximum lipid scrambling rates as quantified by slope k are significantly reduced under 5 µM [Ca2+]i compared with 100 µM [Ca2+]i (Fig. 4 E). TMEM16F scrambling activity under 5 µM [Ca2+]i is completely abolished under pHi 6.1. This is distinct from TMEM16F scrambling in 100 µM [Ca2+]i and pHi 6.1, under which condition TMEM16F-mediated lipid scrambling can be clearly observed (Fig. 2, B–E). In contrast, when saturated intracellular Ca2+ (1,000 µM) was applied, fast and robust PS exposure could be detected at all pHi values (Fig. 4 F and Video 4). In addition, the ton, t1/2, and maximum lipid scrambling rates (slope k) of TMEM16F lipid scrambling are comparable regardless of pHi (Fig. 4, H–J). Our imaging experiments thus demonstrate that, consistent with TMEM16F channel activity (Fig. 3), pHi regulation of TMEM16F CaPLSase activity is also highly [Ca2+]i dependent: lower [Ca2+]i enhances TMEM16F CaPLSase pHi sensitivity, whereas saturating 1,000 µM [Ca2+]i eliminates its pHi sensitivity.
pHi alters Ca2+ sensitivity of TMEM16F ion channel
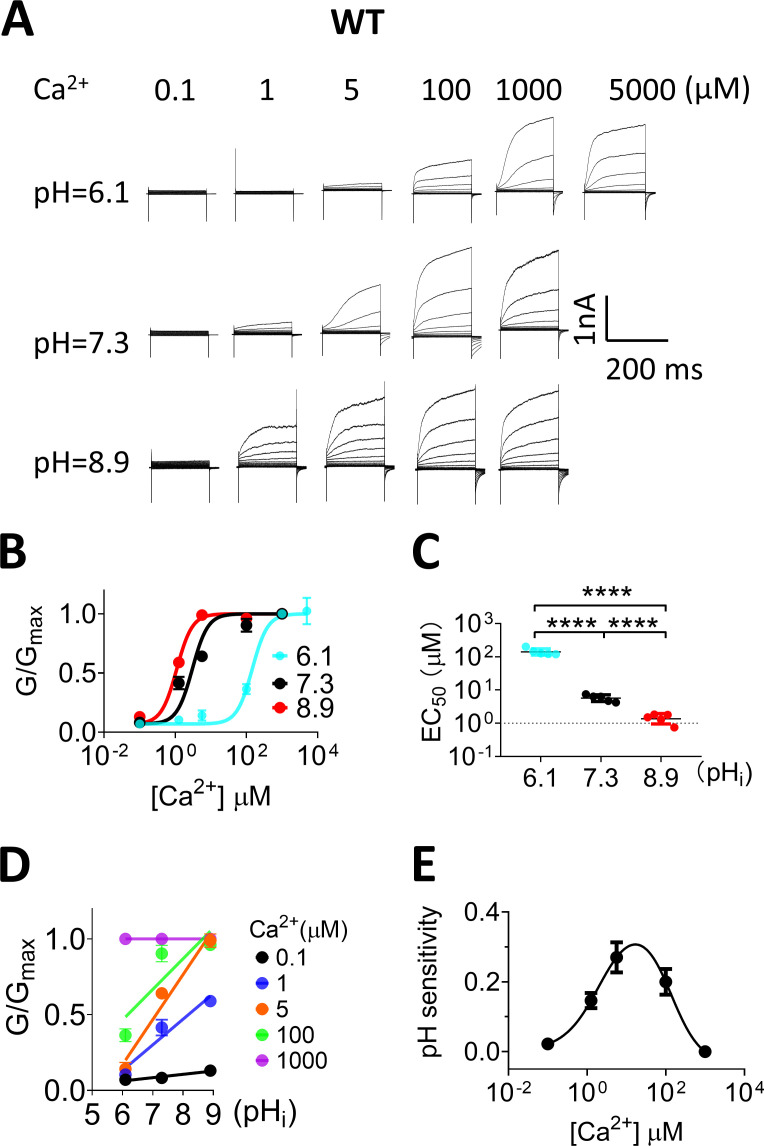
Having shown that pHi regulation of TMEM16F is [Ca2+]i dependent (Figs. 3 and 4) yet voltage independent (Fig. 1 C), we next tested the hypothesis that pHi may directly influence the Ca2+ binding sites of TMEM16F, following the same pHi regulation mechanism of TMEM16A (Chun et al., 2015). If this is the case, protonation and deprotonation of the Ca2+ binding residues would reduce and increase the Ca2+ sensitivity of TMEM16F, respectively. To test this hypothesis, we measured the apparent Ca2+ sensitivity of TMEM16F under different pHi values using inside-out patches (Fig. 5 A). Our results showed that the EC50 of the TMEM16F Ca2+ dose response under physiological pHi (7.3) is 6.20 ± 0.82 µM (Fig. 5, B and C), comparable to previous studies (Yang et al., 2012). When pHi drops to 6.1, TMEM16F Ca2+ sensitivity decreases >20-fold (EC50 = 144.45 ± 6.80 µM). In stark contrast, when pHi is switched to 8.9, TMEM16F Ca2+ sensitivity is dramatically enhanced (EC50 = 1.24 ± 0.14 µM). These results support that pHi works on the Ca2+ binding sites to exert its regulatory effects.
Figure 5.
pHi alters Ca2+ binding affinity of TMEM16F. (A) Representative TMEM16F currents recorded from inside-out patches perfused with intracellular solutions containing 0.1, 1, 5, 100, 1,000, and 5,000 µM Ca2+ at different pHi values (5,000 µM at pH 6.1 only). (B) Ca2+ dose–response of mTMEM16F channel at +100 mV with different pHi values. The smooth curves represent the fits to the Hill equation: G/Gmax = G1,000/[1 + (Kd/[Ca2+])H], where Kd is the apparent dissociation constant, H is the Hill coefficient, and G1,000 is the conductance with 1,000 µM Ca2+ at given pHi. The error bars represent SEM (n = 5). (C) EC50 values of Ca2+ at pHi 6.1, 7.3 and 8.9 were 144.45 ± 6.80, 6.20 ± 0.82, and 1.24 ± 0.14 µM, respectively. The error bars represent SEM (n = 5). P values were determined with Tukey test comparisons after one-way ANOVA: ****, P < 0.0001. (D) The G-pHi relationship of TMEM16F current at +100 mV under different Ca2+ concentrations. Solid lines represent linear fits. (E) The relationship of pHi sensitivity and [Ca2+]i concentration. The pHi sensitivity values were slopes from linear fit shown in D under different Ca2+ concentrations. The smooth line was fitted with a bell-shaped dose–response curve using GraphPad Prism, with peak pH sensitivity of 0.33 at ∼15 µM Ca2+. The error bars represent SEM (n = 5).
Next, we extracted the relative conductance (G/Gmax) from Fig. 5 B and plotted the G-pHi relationship for each [Ca2+]i value (Fig. 5 D). The G-pHi relationships under different [Ca2+]i values are not parallel, which is in stark contrast to the parallel G-pHi relationships under different membrane voltages (Fig. 1 C). As the slope of the G-pHi relationship represents the apparent pHi sensitivity, we constructed the pHi sensitivity–[Ca2+]i relationship in Fig. 5 E. Interestingly, the pHi sensitivity–[Ca2+]i curve displays a bell-shaped distribution, which peaks around 15 µM [Ca2+]i. Recapitulating the bell-shaped Ca2+ response curves of inositol (1,4,5)-trisphosphate and Ca2+-gated inositol (1,4,5)-trisphosphate receptor, and ryanodine receptor channels (Bezprozvanny et al., 1991), the bell-shaped pHi sensitivity–[Ca2+]i curve of TMEM16F demonstrates that TMEM16F is strictly pHi sensitive under the physiological range of [Ca2+]i. TMEM16F channel activation becomes more and more sensitive to pHi when [Ca2+]i elevates from resting levels of 0.1 µM, until its pHi sensitivity peaks around 15 µM [Ca2+]i. When [Ca2+]i increases beyond 15 µM [Ca2+]i, TMEM16F pHi sensitivity sharply decreases. Our analysis thus defines the physiological [Ca2+]i range for TMEM16F pHi regulation. In addition, the bell-shaped pHi sensitivity–[Ca2+]i curve also suggests that proton and Ca2+ compete to bind to the Ca2+ binding site residues. When [Ca2+]i is low, the protonation state of the Ca2+ binding residues has a bigger influence on controlling Ca2+ binding; thus TMEM16F has higher pHi sensitivity. When [Ca2+]i increases beyond 15 µM, Ca2+ outcompetes protons to bind to the Ca2+ binding residues, thereby resulting in pHi sensitivity reduction. Once [Ca2+]i reaches a saturating concentration of 1 mM, TMEM16F can be fully activated even in low pHi, thereby completely losing pHi sensitivity.
The primary Ca2+ binding sites in the pore mediate pHi regulation on TMEM16F
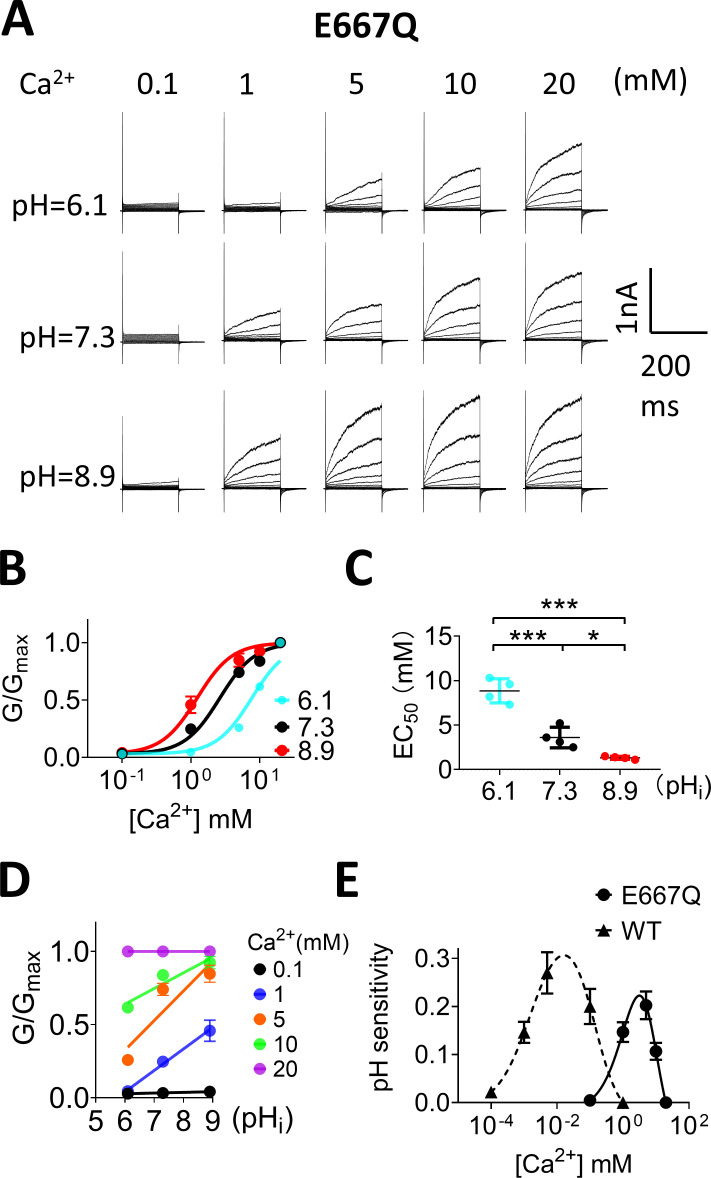
To further test this hypothesis and to prove that pHi directly affects the primary Ca2+ binding sites within the pore, we examined the pHi sensitivity of E667Q, the Ca2+ binding residue mutation that markedly reduces TMEM16F Ca2+ sensitivity, with an EC50 of 2.8 mM (Yang et al., 2012). Similar to WT TMEM16F, E667Q activation is also highly pHi dependent, albeit at greatly reduced Ca2+ sensitivity in the millimolar range (Fig. 6, A–C). The EC50 of E667Q at pHi 6.1, 7.3, and 8.9 is 8.8, 3.6, and 1.3 mM, respectively, indicating that pHi still can regulate TMEM16F Ca2+-dependent activation even when the Ca2+ binding sites are disrupted. By plotting the G-pHi relationship and extracting pHi sensitivity for each [Ca2+]i (Fig. 6 D), we constructed the pHi sensitivity–[Ca2+]i curve for E667Q (Fig. 6 E). Interestingly, the pHi sensitivity–[Ca2+]i curve still displays a bell-shaped distribution, with a significant rightward shift, which peaks around 3.0 mM [Ca2+]i. E667Q shows prominent pHi sensitivity of 0.15 at 1 mM Ca2+, at which WT TMEM16F completely loses pHi sensitivity (Fig. 6, D and E). When [Ca2+]i increases beyond 3 mM, the pHi sensitivity of E667Q starts to diminish, and it completely loses pHi sensitivity when [Ca2+]i reaches saturating 20 mM. As E667Q still requires Ca2+ binding to the primary Ca2+ binding sites to be activated, our findings in E667Q thus further support that protons and [Ca2+]i compete to bind to the primary Ca2+ binding sites to control TMEM16F activation. In addition, the pHi sensitivity at the peak of the pHi sensitivity–[Ca2+]i curve of E667Q (0.22) is lower than that of WT channels (0.32). The pHi sensitivity–[Ca2+]i curve of E667Q also becomes narrower. All of these results indicate that overall pHi sensitivity is reduced when the primary Ca2+ binding sites are partially disrupted (Fig. 6 E).
Figure 6.
Ca2+ binding sites mediate pHi regulation on TMEM16F. (A) Representative TMEM16F-E667Q currents recorded from inside-out patches perfused with intracellular solutions containing 0.1, 1, 5, 10, and 20 mM Ca2+ at different pHi values. (B) Ca2+ dose–response of TMEM16F-E667Q mutation. The error bars represent SEM (n = 4). (C) EC50 values of Ca2+ at pHi 6.1, 7.3, and 8.9 were 8.64 ± 1.08, 2.93 ± 0.42, and 1.22 ± 0.31 mM, respectively. The error bars represent SEM (n = 4). P values were determined with Tukey test comparisons after one-way ANOVA: ***, P < 0.001; *, P < 0.5. (D) The G-pHi relationship of TMEM16F-E667Q. Solid lines represent linear fits. (E) The pHi sensitivity and [Ca2+]i concentration relationship of E667Q (solid line). The peak pH sensitivity is 0.22 at ∼3.01 mM Ca2+. The error bars represent SEM (n = 4). Curve from WT (dashed line) was replotted here for reference.
Recent structural studies demonstrated that mammalian TMEM16 proteins may possess an additional Ca2+ binding site (or the third Ca2+ binding site) located near the dimer interface (Alvadia et al., 2019; Bushell et al., 2019). To examine if the putative third Ca2+ binding site involves pHi regulation, we neutralized its acidic residues D859A and E395A and examined their pHi regulation (Fig. S7). We found that both mutations showed no effect on pHi sensitivity, as evidenced by indistinguishable G-pHi relationships between the mutant and WT channels (Fig. S7 E). We concluded that the primary Ca2+ binding sites in the pore but not the third Ca2+ binding site near the dimer interface are responsible for TMEM16F pHi regulation.
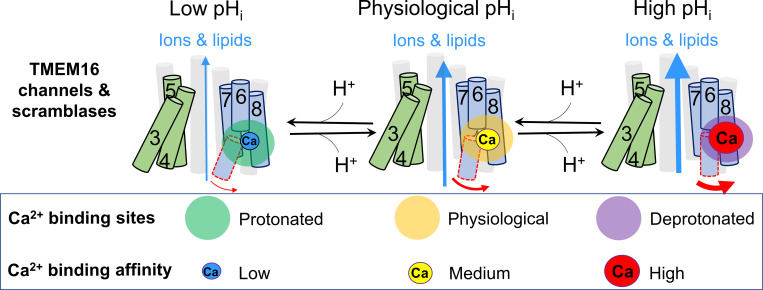
Taken together, our systematic biophysical characterizations and mutagenesis experiments explicitly illustrate a pHi regulatory mechanism for both TMEM16F and TMEM16A. According to this mechanism, pHi regulates the activation of these TMEM16 proteins through protonation and deprotonation of their primary Ca2+ binding sites, which in turn reduce and enhance their Ca2+ binding affinity, respectively (Fig. 7). As the Ca2+ binding residues are highly conserved, this pHi regulatory mechanism may also apply to other TMEM16 family members.
Figure 7.
Schematic model of pHi regulation on TMEM16F and TMEM16A under physiological Ca2+i. Under low pHi conditions, protonation of the primary Ca2+ binding residues in the pore can significantly reduce Ca2+ binding affinity of TMEM16 proteins and suppress their activation. In contrast, high pHi deprotonates the Ca2+ binding residues and enhances Ca2+ binding and TMEM16 activation. The size of blue arrows represents the open probability of TMEM16 proteins. The size of Ca2+ ions represents the strength of apparent Ca2+ binding affinity.
Discussion
In this study, we systematically investigated the pHi effects on TMEM16F CaPLSase and ion channel activities using the lipid scrambling–fluorometry assay and inside-out patch clamp recording, respectively. We discovered that pHi can effectively regulate TMEM16F CaPLSase and ion channel activities. By comparing with the pHi regulation of TMEM16A-CaCC, we conclude that pHi regulates TMEM16F and TMEM16A activation through the same molecular mechanism. Our biophysical characterizations and mutagenesis studies explicitly show that the primary Ca2+ binding residues within the pore of the TMEM16 proteins serve as the pHi sensors (Fig. 7). Protonation of the carboxylate groups of the Ca2+ binding residues prevents Ca2+ binding, thereby hindering TMEM16 activation. In contrast, deprotonation of the carboxylate groups of the Ca2+ binding residues facilitates Ca2+ binding, thereby promoting TMEM16 activation.
Histidine, the most titratable amino acid under physiological pHi range, is unlikely to be the pHi sensor for TMEM16F activation. The previous mutagenesis study of TMEM16A demonstrates that all the intracellular histidine-to-alanine mutations do not alter the inhibitory effect of proton on TMEM16A activation (Chun et al., 2015). As some of these histidine residues are conserved between TMEM16F and TMEM16A, it is thus plausible to assert that the equivalent histidine residues also do not contribute to TMEM16F pHi sensing. In addition, our characterizations of the gain-of-function mutations of TMEM16F and TMEM16A channels showed that these gain-of-function mutant channels are insensitive to pHi regulation (Fig. S6). If some of the intracellular histidine residues contribute to pHi sensing, the pHi sensitivity of the gain-of-function mutant channels should be altered. Therefore, the intracellular histidine residues are unlikely to contribute to pHi regulation.
pHi regulation of TMEM16F ion channel activity can be precisely measured using inside-out patch clamping. Nevertheless, accurate quantification of the pHi effects on TMEM16F CaPLSase activity has been challenging. First, the fluorescent assays to detect CaPLSase activities are less sensitive than patch clamping. Fluorescently tagged AnV has been commonly used as a PS probe, whose time-dependent accumulation on cell surface serves as a readout of CaPLSase activities. Unlike patch clamping that can detect the activities of a small number of channels or even single-channel activities, reliable measurement of CaPLSase activities requires an ensemble of CaPLSases, usually in a large population of cells or, under higher-resolution microscopy, the entire single cells. Second, compared with patch-clamp recording of ion channel activities, CaPLSase-mediated AnV binding is slow (takes tens of minutes to reach steady-state) and hardly reversible. Third, it is challenging to precisely control intracellular Ca2+, which is required to accurately measure CaPLSase activities. The patch clamp-lipid scrambling fluorometry assay developed by the Hartzell laboratory uses the patch pipette to infuse defined Ca2+ into a patched cell (Yu et al., 2015), thereby enabling precise control of intracellular Ca2+ and measurement of CaPLSase activities at the single-cell level. Nevertheless, quantitative analysis of the CaPLSase activities has not been established, which hinders the application of the patch-clamping lipid scrambling–fluorometry assay to study TMEM16 CaPLSase activation and regulation.
In this study, we modified the patch-clamping lipid scrambling–fluorometry assay to achieve precise control of both [Ca2+]i and pHi (Fig. 2 A). By measuring and fitting the time-dependent increase of AnV fluorescence with a generalized logistic equation, we can obtain three parameters, ton, t1/2, and slope k. ton is the onset time of macroscopic CaPLSase activity. It represents the lag time needed for Ca2+ to diffuse from the pipette solution to cytosol and reach the threshold Ca2+ concentration to trigger sufficient CaPLSase activities that can be reliably detected by our fluorescence microscope. The ton for TMEM16F CaPLSase is ∼11 min under 100 µM Ca2+ and pHi 7.3, which is comparable to the previous reported lag time of TMEM16F CaPLSase (Yu et al., 2015) and TMEM16F channel under whole-cell configuration (Grubb et al., 2013; Yu et al., 2015). Paradoxically, TMEM16F current can be instantaneously activated without delay under inside-out configuration (Fig. 1 A; Fig. 3, A and B; and Fig. 5 A). It is still unclear why TMEM16F activation needs such a long ton compared with the fast activation of TMEM16A-CaCC activation under whole-cell configuration. The lower Ca2+ sensitivity of TMEM16F (Yang et al., 2012; Yu et al., 2015) and also the potential interaction between TMEM16F and cytoskeleton could contribute to this long lag time (Lin et al., 2018; Roh and Nam, 2020). Future studies are needed to further dissect out the underlying mechanism of the long lag time for TMEM16F activation. Nevertheless, ton for TMEM16F activation is apparently Ca2+ dependent, as shown in Fig. 2 D and Fig. 4, C and H. The higher the Ca2+, the shorter the ton under any given pHi. We also obtained t1/2 for TMEM16F CaPLSases, which is the time needed to reach half-maximum AnV fluorescence after membrane break-in, as an additional parameter to evaluate CaPLSase activity. t1/2 is the summation of ton and the time needed from ton to reach half-maximum AnV fluorescence. t1/2 is thus determined by two factors: ton and the scrambling rate of the active TMEM16F CaPLSase for PS permeation. The macroscopic TMEM16F scrambling rate gradually increases over time after ton, reflecting the augments of TMEM16F open probability and conductance for phospholipids. Different from ion transport that usually operates with constant ion gradients, phospholipid flip-flop across the membrane bilayer is controlled by finite phospholipid gradients, which gradually dissipate with prolonged scramblase activation. Thus, CaPLSase phospholipid scrambling reaches maximum rate at t1/2 and then gradually decreases until phospholipids become symmetrically distributed. The maximum apparent CaPLSase scrambling rate is measured as the slope k of the linear phase of the sigmoid curve at t1/2. This is the third parameter to evaluate CaPLSase activity.
Remarkably, pHi exerts similar impacts on ton, t1/2, and slope k of the TMEM16F CaPLSases regardless of the biophysical meanings of the parameters (Fig. 2, C–F; and Fig. 4, B–E and G–J). Under nonsaturating Ca2+ (5 and 100 µM), low pHi prolongs both ton and t1/2 and reduces slope k, whereas high pHi shortens both ton and t1/2 and increases slope k. The comparison of these parameters thus suggests that pHi strongly controls TMEM16F CaPLSase Ca2+-dependent activation and phospholipid permeation. We hope that our detailed biophysical characterization and quantification of CaPLSase activity and our interpretation of the underlying biophysical meanings of the parameters can inspire the field to further dissect the molecular mechanisms of TMEM16 CaPLSases and facilitate future biophysical, physiological, and pharmacological characterizations of these intriguing membrane transporters.
Interestingly, pHi sensitivity of TMEM16F is highly Ca2+ dependent and exhibits a bell-shaped relationship with [Ca2+]i (Fig. 5 E). According to this relationship, saturating [Ca2+]i can override the pHi effects on the protonation states of the Ca2+ binding residues, thereby eliminating pHi sensitivity for WT TMEM16F and TMEM16A (Fig. 3, D and E; Fig. 4, G–J; and Fig. S5). Mutating the Ca2+ binding residues dramatically reduces TMEM16F apparent Ca2+ sensitivity (Fig. 6, B and C; Yang et al., 2012; Yu et al., 2012; Tien et al., 2014; Alvadia et al., 2019), which results in a significant right shift of the bell shape of the pHi-Ca2+ curve (Fig. 6 E). The notable reduction of the peak pHi sensitivity as well as the narrowed pHi-Ca2+ curve suggest that the overall pHi effect diminishes in the Ca2+ binding site mutation of TMEM16F. On the other hand, we also show evidence that pHi exerts a negligible effect on the pore-lining residue Q559K (Fig. S3) and the Ca2+ binding site located in the dimer interface of TMEM16F (Fig. S7), suggesting that the two primary Ca2+ binding sites predominantly mediate the pHi regulatory effects on TMEM16 protein. In addition, when [Ca2+]i is very low and voltage plays a more prominent role in activating the TMEM16 proteins, the pHi sensitivities of TMEM16F and TMEM16A reduce. This is likely because pHi has negligible impact on voltage-dependent activation of these proteins, as evidenced by the near-parallel G-pHi relationships across a wide range of activation voltages (Figs. 1 C and S1 C), as well as the lack of pHi effects on the voltage-dependent activation of the gain-of-function mutations of TMEM16F and TMEM16F in the absence of [Ca2+]i (Fig. S6). It is worth noting that all our experiments were conducted at room temperature. According to a recent publication (Lin et al., 2019), TMEM16F is more sensitive to [Ca2+]i at 37°C. It is therefore plausible that pHi may be more sensitive to [Ca2+]i at physiological temperature.
Intracellular alkalization is one of the hallmarks of cancer cells (Webb et al., 2011). A number of distinct ion transporters and pumps, including the Na+-H+ exchangers (Lauritzen et al., 2012), the H+/K+-ATPase proton pump (Goh et al., 2014), and the Na+-driven bicarbonate transporters (McIntyre et al., 2016), have been known to contribute to intracellular alkalization. Unlike the extensive understanding of pHi dysregulation in cancer cells, how intracellular alkalization affects cancer cell function is still elusive. Interestingly, TMEM16F has been identified in a wide variety of cancer cells, and according to the Human Protein Atlas (http://www.proteinatlas.org), the high expression level of TMEM16F is associated with the overall prognosis of a number of cancers including breast and cervical cancer. Although it is unclear how TMEM16F contributes to tumor growth and cancer progression, it has been reported that genetic manipulations of TMEM16F can change cancer cell proliferation and migration (Jacobsen et al., 2013; Wang et al., 2018; Xuan et al., 2019). Interestingly, loss of membrane phospholipid asymmetry is a salient feature of many cancerous cells, whose cell surfaces display an elevated amount of PS (Riedl et al., 2011; Zhao et al., 2011). It is still unclear which phospholipid transporters are responsible for the enhanced PS exposure on the surfaces of the cancer cells. Nevertheless, no sign of apoptosis (Utsugi et al., 1991) and the beneficial effects of PS exposure to cancer cell survival (Schröder-Borm et al., 2005; He et al., 2009; Kenis and Reutelingsperger, 2009; Gerber et al., 2011; Blanco et al., 2014; Zhang et al., 2014) suggest that CaPLSases instead of caspase-dependent lipid scramblases may play important roles in facilitating PS exposure in cancer cells. Our current investigation of the mechanism of TMEM16F pHi regulation thus lays a foundation to further understand the role of TMEM16F in cancer and other physiological or pathological conditions, in which pHi fluctuates or is dysregulated. The shared molecular mechanism of pHi regulation between TMEM16F and TMEM16A identified in this study will also facilitate our understanding of the regulatory mechanism and physiological functions of other TMEM16 family members.
Supplementary Material
shows the comparison of pHi sensitivity of TMEM16F current measurements using Boltzmann and linear fits.
Acknowledgments
Crina M. Nimigean served as editor.
We are grateful to Son C. Le for his help on electrophysiology and plotting the structural models. We thank Drs. Jianmin Cui and Jorg Grandl for their constructive suggestions on the projects. We appreciate Son C. Le, Trieu Le, Yang Zhang and Ping Dong for their generous help and comments on this project.
This work was supported by the National Institutes of Health (DP2-GM126898 to H. Yang).
The authors declare no competing financial interests.
Author contributions: H. Yang conceived and supervised the project. P. Liang performed all phosopholipid scrambling and electrophysiology experiments, as well as data analysis. P. Liang and H. Yang wrote the manuscript.
References
- Alvadia, C., Lim N.K., Clerico Mosina V., Oostergetel G.T., Dutzler R., and Paulino C.. 2019. Cryo-EM structures and functional characterization of the murine lipid scramblase TMEM16F. eLife. 8:e44365 10.7554/eLife.44365 [DOI] [PMC free article] [PubMed] [Google Scholar]
- Arreola, J., Melvin J.E., and Begenisich T.. 1995. Inhibition of Ca(2+)-dependent Cl− channels from secretory epithelial cells by low internal pH. J. Membr. Biol. 147:95–104. 10.1007/BF00235400 [DOI] [PubMed] [Google Scholar]
- Berg, J., Yang H., and Jan L.Y.. 2012. Ca2+-activated Cl− channels at a glance. J. Cell Sci. 125:1367–1371. 10.1242/jcs.093260 [DOI] [PMC free article] [PubMed] [Google Scholar]
- Bezprozvanny, I., Watras J., and Ehrlich B.E.. 1991. Bell-shaped calcium-response curves of Ins(1,4,5)P3- and calcium-gated channels from endoplasmic reticulum of cerebellum. Nature. 351:751–754. 10.1038/351751a0 [DOI] [PubMed] [Google Scholar]
- Blanco, V.M., Chu Z., Vallabhapurapu S.D., Sulaiman M.K., Kendler A., Rixe O., Warnick R.E., Franco R.S., and Qi X.. 2014. Phosphatidylserine-selective targeting and anticancer effects of SapC-DOPS nanovesicles on brain tumors. Oncotarget. 5:7105–7118. 10.18632/oncotarget.2214 [DOI] [PMC free article] [PubMed] [Google Scholar]
- Brunner, J.D., Lim N.K., Schenck S., Duerst A., and Dutzler R.. 2014. X-ray structure of a calcium-activated TMEM16 lipid scramblase. Nature. 516:207–212. 10.1038/nature13984 [DOI] [PubMed] [Google Scholar]
- Brunner, J.D., Schenck S., and Dutzler R.. 2016. Structural basis for phospholipid scrambling in the TMEM16 family. Curr. Opin. Struct. Biol. 39:61–70. [DOI] [PubMed] [Google Scholar]
- Bushell, S.R., Pike A.C.W., Falzone M.E., Rorsman N.J.G., Ta C.M., Corey R.A., Newport T.D., Christianson J.C., Scofano L.F., Shintre C.A., et al. . 2019. The structural basis of lipid scrambling and inactivation in the endoplasmic reticulum scramblase TMEM16K. Nat. Commun. 10:3956 10.1038/s41467-019-11753-1 [DOI] [PMC free article] [PubMed] [Google Scholar]
- Caputo, A., Caci E., Ferrera L., Pedemonte N., Barsanti C., Sondo E., Pfeffer U., Ravazzolo R., Zegarra-Moran O., and Galietta L.J.V.. 2008. TMEM16A, a membrane protein associated with calcium-dependent chloride channel activity. Science. 322:590–594. 10.1126/science.1163518 [DOI] [PubMed] [Google Scholar]
- Castoldi, E., Collins P.W., Williamson P.L., and Bevers E.M.. 2011. Compound heterozygosity for 2 novel TMEM16F mutations in a patient with Scott syndrome. Blood. 117:4399–4400. 10.1182/blood-2011-01-332502 [DOI] [PubMed] [Google Scholar]
- Cho, H., Yang Y.D., Lee J., Lee B., Kim T., Jang Y., Back S.K., Na H.S., Harfe B.D., Wang F., et al. . 2012. The calcium-activated chloride channel anoctamin 1 acts as a heat sensor in nociceptive neurons. Nat. Neurosci. 15:1015–1021. 10.1038/nn.3111 [DOI] [PubMed] [Google Scholar]
- Chun, H., Cho H., Choi J., Lee J., Kim S.M., Kim H., and Oh U.. 2015. Protons inhibit anoctamin 1 by competing with calcium. Cell Calcium. 58:431–441. 10.1016/j.ceca.2015.06.011 [DOI] [PubMed] [Google Scholar]
- Crottès, D., and Jan L.Y.. 2019. The multifaceted role of TMEM16A in cancer. Cell Calcium. 82:102050 10.1016/j.ceca.2019.06.004 [DOI] [PMC free article] [PubMed] [Google Scholar]
- Cruz-Rangel, S., De Jesús-Pérez J.J., Aréchiga-Figueroa I.A., Rodríguez-Menchaca A.A., Pérez-Cornejo P., Hartzell H.C., and Arreola J.. 2017. Extracellular protons enable activation of the calcium-dependent chloride channel TMEM16A. J. Physiol. 595:1515–1531. 10.1113/JP273111 [DOI] [PMC free article] [PubMed] [Google Scholar]
- Dang, S., Feng S., Tien J., Peters C.J., Bulkley D., Lolicato M., Zhao J., Zuberbühler K., Ye W., Qi L., et al. . 2017. Cryo-EM structures of the TMEM16A calcium-activated chloride channel. Nature. 552:426–429. 10.1038/nature25024 [DOI] [PMC free article] [PubMed] [Google Scholar]
- De Jesús-Pérez, J.J., Cruz-Rangel S., Espino-Saldaña Á.E., Martínez-Torres A., Qu Z., Hartzell H.C., Corral-Fernandez N.E., Pérez-Cornejo P., and Arreola J.. 2018. Phosphatidylinositol 4,5-bisphosphate, cholesterol, and fatty acids modulate the calcium-activated chloride channel TMEM16A (ANO1). Biochim. Biophys. Acta Mol. Cell Biol. Lipids. 1863:299–312. 10.1016/j.bbalip.2017.12.009 [DOI] [PMC free article] [PubMed] [Google Scholar]
- Ehlen, H.W.A., Chinenkova M., Moser M., Munter H.-M., Krause Y., Gross S., Brachvogel B., Wuelling M., Kornak U., and Vortkamp A.. 2013. Inactivation of anoctamin-6/Tmem16f, a regulator of phosphatidylserine scrambling in osteoblasts, leads to decreased mineral deposition in skeletal tissues. J. Bone Miner. Res. 28:246–259. 10.1002/jbmr.1751 [DOI] [PubMed] [Google Scholar]
- Falzone, M.E., Malvezzi M., Lee B.-C., and Accardi A.. 2018. Known structures and unknown mechanisms of TMEM16 scramblases and channels. J. Gen. Physiol. 150:933–947. 10.1085/jgp.201711957 [DOI] [PMC free article] [PubMed] [Google Scholar]
- Feng, S., Dang S., Han T.W., Ye W., Jin P., Cheng T., Li J., Jan Y.N., Jan L.Y., and Cheng Y.. 2019. Cryo-EM Studies of TMEM16F Calcium-Activated Ion Channel Suggest Features Important for Lipid Scrambling. Cell Rep. 28:567–579.e4. 10.1016/j.celrep.2019.06.023 [DOI] [PMC free article] [PubMed] [Google Scholar]
- Fujii, T., Sakata A., Nishimura S., Eto K., and Nagata S.. 2015. TMEM16F is required for phosphatidylserine exposure and microparticle release in activated mouse platelets. Proc. Natl. Acad. Sci. USA. 112:12800–12805. 10.1073/pnas.1516594112 [DOI] [PMC free article] [PubMed] [Google Scholar]
- Gerber, D.E., Stopeck A.T., Wong L., Rosen L.S., Thorpe P.E., Shan J.S., and Ibrahim N.K.. 2011. Phase I safety and pharmacokinetic study of bavituximab, a chimeric phosphatidylserine-targeting monoclonal antibody, in patients with advanced solid tumors. Clin. Cancer Res. 17:6888–6896. 10.1158/1078-0432.CCR-11-1074 [DOI] [PubMed] [Google Scholar]
- Goh, W., Sleptsova-Freidrich I., and Petrovic N.. 2014. Use of proton pump inhibitors as adjunct treatment for triple-negative breast cancers. An introductory study. J. Pharm. Pharm. Sci. 17:439–446. 10.18433/J34608 [DOI] [PubMed] [Google Scholar]
- Grubb, S., Poulsen K.A., Juul C.A., Kyed T., Klausen T.K., Larsen E.H., and Hoffmann E.K.. 2013. TMEM16F (Anoctamin 6), an anion channel of delayed Ca(2+) activation. J. Gen. Physiol. 141:585–600. 10.1085/jgp.201210861 [DOI] [PMC free article] [PubMed] [Google Scholar]
- Hartzell, C., Putzier I., and Arreola J.. 2005. Calcium-activated chloride channels. Annu. Rev. Physiol. 67:719–758. 10.1146/annurev.physiol.67.032003.154341 [DOI] [PubMed] [Google Scholar]
- He, J., Yin Y., Luster T.A., Watkins L., and Thorpe P.E.. 2009. Antiphosphatidylserine antibody combined with irradiation damages tumor blood vessels and induces tumor immunity in a rat model of glioblastoma. Clin. Cancer Res. 15:6871–6880. 10.1158/1078-0432.CCR-09-1499 [DOI] [PubMed] [Google Scholar]
- Huang, F., Wang X., Ostertag E.M., Nuwal T., Huang B., Jan Y.-N., Basbaum A.I., and Jan L.Y.. 2013. TMEM16C facilitates Na(+)-activated K+ currents in rat sensory neurons and regulates pain processing. Nat. Neurosci. 16:1284–1290. 10.1038/nn.3468 [DOI] [PMC free article] [PubMed] [Google Scholar]
- Huang, W.C., Xiao S., Huang F., Harfe B.D., Jan Y.N., and Jan L.Y.. 2012. Calcium-activated chloride channels (CaCCs) regulate action potential and synaptic response in hippocampal neurons. Neuron. 74:179–192. 10.1016/j.neuron.2012.01.033 [DOI] [PMC free article] [PubMed] [Google Scholar]
- Jacobsen, K.S., Zeeberg K., Sauter D.R.P., Poulsen K.A., Hoffmann E.K., and Schwab A.. 2013. The role of TMEM16A (ANO1) and TMEM16F (ANO6) in cell migration. Pflugers Arch. 465:1753–1762. 10.1007/s00424-013-1315-z [DOI] [PMC free article] [PubMed] [Google Scholar]
- Kenis, H., and Reutelingsperger C.. 2009. Targeting phosphatidylserine in anti-cancer therapy. Curr. Pharm. Des. 15:2719–2723. 10.2174/138161209788923903 [DOI] [PubMed] [Google Scholar]
- Lagadic-Gossmann, D., Huc L., and Lecureur V.. 2004. Alterations of intracellular pH homeostasis in apoptosis: origins and roles. Cell Death Differ. 11:953–961. 10.1038/sj.cdd.4401466 [DOI] [PubMed] [Google Scholar]
- Lauritzen, G., Stock C.-M., Lemaire J., Lund S.F., Jensen M.F., Damsgaard B., Petersen K.S., Wiwel M., Rønnov-Jessen L., Schwab A., and Pedersen S.F.. 2012. The Na+/H+ exchanger NHE1, but not the Na+, HCO3(-) cotransporter NBCn1, regulates motility of MCF7 breast cancer cells expressing constitutively active ErbB2. Cancer Lett. 317:172–183. 10.1016/j.canlet.2011.11.023 [DOI] [PubMed] [Google Scholar]
- Le, S.C., Jia Z., Chen J., and Yang H.. 2019a Molecular basis of PIP2-dependent regulation of the Ca2+-activated chloride channel TMEM16A. Nat. Commun. 10:3769 10.1038/s41467-019-11784-8 [DOI] [PMC free article] [PubMed] [Google Scholar]
- Le, T., Jia Z., Le S.C., Zhang Y., Chen J., and Yang H.. 2019b An inner activation gate controls TMEM16F phospholipid scrambling. Nat. Commun. 10:1846 10.1038/s41467-019-09778-7 [DOI] [PMC free article] [PubMed] [Google Scholar]
- Le, T., Le S.C., and Yang H.. 2019c Drosophila Subdued is a moonlighting transmembrane protein 16 (TMEM16) that transports ions and phospholipids. J. Biol. Chem. 294:4529–4537. 10.1074/jbc.AC118.006530 [DOI] [PMC free article] [PubMed] [Google Scholar]
- Li, K.X., He M., Ye W., Simms J., Gill M., Xiang X., Jan Y.N., and Jan L.Y.. 2019. TMEM16B regulates anxiety-related behavior and GABAergic neuronal signaling in the central lateral amygdala. eLife. 8:e47106 10.7554/eLife.47106 [DOI] [PMC free article] [PubMed] [Google Scholar]
- Lin, H., Jun I., Woo J.H., Lee M.G., Kim S.J., and Nam J.H.. 2019. Temperature-dependent increase in the calcium sensitivity and acceleration of activation of ANO6 chloride channel variants. Sci. Rep. 9:6706 10.1038/s41598-019-43162-1 [DOI] [PMC free article] [PubMed] [Google Scholar]
- Lin, H., Roh J., Woo J.H., Kim S.J., and Nam J.H.. 2018. TMEM16F/ANO6, a Ca2+-activated anion channel, is negatively regulated by the actin cytoskeleton and intracellular MgATP. Biochem. Biophys. Res. Commun. 503:2348–2354. 10.1016/j.bbrc.2018.06.160 [DOI] [PubMed] [Google Scholar]
- McIntyre, A., Hulikova A., Ledaki I., Snell C., Singleton D., Steers G., Seden P., Jones D., Bridges E., Wigfield S., et al. . 2016. Disrupting hypoxia-induced bicarbonate transport acidifies tumor cells and suppresses tumor growth. Cancer Res. 76:3744–3755. 10.1158/0008-5472.CAN-15-1862 [DOI] [PubMed] [Google Scholar]
- Oh, U., and Jung J.. 2016. Cellular functions of TMEM16/anoctamin. Pflugers Arch. 468:443–453. 10.1007/s00424-016-1790-0 [DOI] [PMC free article] [PubMed] [Google Scholar]
- Ousingsawat, J., Wanitchakool P., Schreiber R., Wuelling M., Vortkamp A., and Kunzelmann K.. 2015. Anoctamin-6 controls bone mineralization by activating the calcium transporter NCX1. J. Biol. Chem. 290:6270–6280. 10.1074/jbc.M114.602979 [DOI] [PMC free article] [PubMed] [Google Scholar]
- Park, K., and Brown P.D.. 1995. Intracellular pH modulates the activity of chloride channels in isolated lacrimal gland acinar cells. Am. J. Physiol. 268:C647–C650. 10.1152/ajpcell.1995.268.3.C647 [DOI] [PubMed] [Google Scholar]
- Paulino, C., Kalienkova V., Lam A.K.M., Neldner Y., and Dutzler R.. 2017. Activation mechanism of the calcium-activated chloride channel TMEM16A revealed by cryo-EM. Nature. 552:421–425. 10.1038/nature24652 [DOI] [PubMed] [Google Scholar]
- Pedemonte, N., and Galietta L.J.V.. 2014. Structure and function of TMEM16 proteins (anoctamins). Physiol. Rev. 94:419–459. 10.1152/physrev.00039.2011 [DOI] [PubMed] [Google Scholar]
- Peters, C.J., Gilchrist J.M., Tien J., Bethel N.P., Qi L., Chen T., Wang L., Jan Y.N., Grabe M., and Jan L.Y.. 2018. The Sixth Transmembrane Segment Is a Major Gating Component of the TMEM16A Calcium-Activated Chloride Channel. Neuron. 97:1063–1077.e4. 10.1016/j.neuron.2018.01.048 [DOI] [PMC free article] [PubMed] [Google Scholar]
- Qu, Z., and Hartzell H.C.. 2000. Anion permeation in Ca(2+)-activated Cl(-) channels. J. Gen. Physiol. 116:825–844. 10.1085/jgp.116.6.825 [DOI] [PMC free article] [PubMed] [Google Scholar]
- Riedl, S., Rinner B., Asslaber M., Schaider H., Walzer S., Novak A., Lohner K., and Zweytick D.. 2011. In search of a novel target - phosphatidylserine exposed by non-apoptotic tumor cells and metastases of malignancies with poor treatment efficacy. Biochim. Biophys. Acta. 1808:2638–2645. 10.1016/j.bbamem.2011.07.026 [DOI] [PMC free article] [PubMed] [Google Scholar]
- Roh, J.W., and Nam J.H.. 2020. Various Physiological Factors for Regulating Activation Speeds in the Delayed Calcium-Dependent Activation of ANO6/TMEM16F. FASEB J. 34(S1):1 10.1096/fasebj.2020.34.s1.03231 [DOI] [Google Scholar]
- Schröder-Borm, H., Bakalova R., and Andrä J.. 2005. The NK-lysin derived peptide NK-2 preferentially kills cancer cells with increased surface levels of negatively charged phosphatidylserine. FEBS Lett. 579:6128–6134. 10.1016/j.febslet.2005.09.084 [DOI] [PubMed] [Google Scholar]
- Schroeder, B.C., Cheng T., Jan Y.N., and Jan L.Y.. 2008. Expression cloning of TMEM16A as a calcium-activated chloride channel subunit. Cell. 134:1019–1029. 10.1016/j.cell.2008.09.003 [DOI] [PMC free article] [PubMed] [Google Scholar]
- Segura-Covarrubias, G., Aréchiga-Figueroa I.A., De Jesús-Pérez J.J., Sánchez-Solano A., Pérez-Cornejo P., and Arreola J.. 2020. Voltage-Dependent Protonation of the Calcium Pocket Enable Activation of the Calcium-Activated Chloride Channel Anoctamin-1 (TMEM16A). Sci. Rep. 10:6644 10.1038/s41598-020-62860-9 [DOI] [PMC free article] [PubMed] [Google Scholar]
- Suzuki, J., Imanishi E., and Nagata S.. 2014. Exposure of phosphatidylserine by Xk-related protein family members during apoptosis. J. Biol. Chem. 289:30257–30267. 10.1074/jbc.M114.583419 [DOI] [PMC free article] [PubMed] [Google Scholar]
- Suzuki, J., Umeda M., Sims P.J., and Nagata S.. 2010. Calcium-dependent phospholipid scrambling by TMEM16F. Nature. 468:834–838. 10.1038/nature09583 [DOI] [PubMed] [Google Scholar]
- Ta, C.M., Acheson K.E., Rorsman N.J.G., Jongkind R.C., and Tammaro P.. 2017. Contrasting effects of phosphatidylinositol 4,5-bisphosphate on cloned TMEM16A and TMEM16B channels. Br. J. Pharmacol. 174:2984–2999. 10.1111/bph.13913 [DOI] [PMC free article] [PubMed] [Google Scholar]
- Tembo, M., Wozniak K.L., Bainbridge R.E., and Carlson A.E.. 2019. Phosphatidylinositol 4,5-bisphosphate (PIP2) and Ca2+ are both required to open the Cl- channel TMEM16A. J. Biol. Chem. 294:12556–12564. 10.1074/jbc.RA118.007128 [DOI] [PMC free article] [PubMed] [Google Scholar]
- Tien, J., Peters C.J., Wong X.M., Cheng T., Jan Y.N., Jan L.Y., and Yang H.. 2014. A comprehensive search for calcium binding sites critical for TMEM16A calcium-activated chloride channel activity. eLife. 3:e02772 10.7554/eLife.02772 [DOI] [PMC free article] [PubMed] [Google Scholar]
- Utsugi, T., Schroit A.J., Connor J., Bucana C.D., and Fidler I.J.. 1991. Elevated expression of phosphatidylserine in the outer membrane leaflet of human tumor cells and recognition by activated human blood monocytes. Cancer Res. 51:3062–3066. [PubMed] [Google Scholar]
- Wang, L., Zhao X.-Y., Zhu J.-S., Chen N.-W., Fan H.-N., Yang W., and Guo J.-H.. 2018. CCR7 regulates ANO6 to promote migration of pancreatic ductal adenocarcinoma cells via the ERK signaling pathway. Oncol. Lett. 16:2599–2605. 10.3892/ol.2018.8962 [DOI] [PMC free article] [PubMed] [Google Scholar]
- Webb, B.A., Chimenti M., Jacobson M.P., and Barber D.L.. 2011. Dysregulated pH: a perfect storm for cancer progression. Nat. Rev. Cancer. 11:671–677. 10.1038/nrc3110 [DOI] [PubMed] [Google Scholar]
- White, K.A., Grillo-Hill B.K., and Barber D.L.. 2017. Cancer cell behaviors mediated by dysregulated pH dynamics at a glance. J. Cell Sci. 130:663–669. 10.1242/jcs.195297 [DOI] [PMC free article] [PubMed] [Google Scholar]
- Whitlock, J.M., and Hartzell H.C.. 2017. Anoctamins/TMEM16 Proteins: Chloride Channels Flirting with Lipids and Extracellular Vesicles. Annu. Rev. Physiol. 79:119–143. 10.1146/annurev-physiol-022516-034031 [DOI] [PMC free article] [PubMed] [Google Scholar]
- Whitlock, J.M., Yu K., Cui Y.Y., and Hartzell H.C.. 2018. Anoctamin 5/TMEM16E facilitates muscle precursor cell fusion. J. Gen. Physiol. 150:1498–1509. 10.1085/jgp.201812097 [DOI] [PMC free article] [PubMed] [Google Scholar]
- Xuan, Z.B., Wang Y.J., and Xie J.. 2019. ANO6 promotes cell proliferation and invasion in glioma through regulating the ERK signaling pathway. OncoTargets Ther. 12:6721–6731. 10.2147/OTT.S211725 [DOI] [PMC free article] [PubMed] [Google Scholar]
- Yang, H., Kim A., David T., Palmer D., Jin T., Tien J., Huang F., Cheng T., Coughlin S.R., Jan Y.N., and Jan L.Y.. 2012. TMEM16F forms a Ca2+-activated cation channel required for lipid scrambling in platelets during blood coagulation. Cell. 151:111–122. 10.1016/j.cell.2012.07.036 [DOI] [PMC free article] [PubMed] [Google Scholar]
- Yang, Y.D., Cho H., Koo J.Y., Tak M.H., Cho Y., Shim W.-S., Park S.P., Lee J., Lee B., Kim B.-M., et al. . 2008. TMEM16A confers receptor-activated calcium-dependent chloride conductance. Nature. 455:1210–1215. 10.1038/nature07313 [DOI] [PubMed] [Google Scholar]
- Ye, W., Han T.W., Nassar L.M., Zubia M., Jan Y.N., and Jan L.Y.. 2018. Phosphatidylinositol-(4, 5)-bisphosphate regulates calcium gating of small-conductance cation channel TMEM16F. Proc. Natl. Acad. Sci. USA. 115:E1667–E1674. 10.1073/pnas.1718728115 [DOI] [PMC free article] [PubMed] [Google Scholar]
- Yin, X., Goudriaan J., Lantinga E.A., Vos J., and Spiertz H.J.. 2003. A flexible sigmoid function of determinate growth. Ann. Bot. 91:361–371. 10.1093/aob/mcg029 [DOI] [PMC free article] [PubMed] [Google Scholar]
- Yu, K., Duran C., Qu Z., Cui Y.-Y., and Hartzell H.C.. 2012. Explaining calcium-dependent gating of anoctamin-1 chloride channels requires a revised topology. Circ. Res. 110:990–999. 10.1161/CIRCRESAHA.112.264440 [DOI] [PMC free article] [PubMed] [Google Scholar]
- Yu, K., Jiang T., Cui Y., Tajkhorshid E., and Hartzell H.C.. 2019. A network of phosphatidylinositol 4,5-bisphosphate binding sites regulates gating of the Ca2+-activated Cl- channel ANO1 (TMEM16A). Proc. Natl. Acad. Sci. USA. 116:19952–19962. 10.1073/pnas.1904012116 [DOI] [PMC free article] [PubMed] [Google Scholar]
- Yu, K., Whitlock J.M., Lee K., Ortlund E.A., Cui Y.Y., and Hartzell H.C.. 2015. Identification of a lipid scrambling domain in ANO6/TMEM16F. eLife. 4:e06901 10.7554/eLife.06901 [DOI] [PMC free article] [PubMed] [Google Scholar]
- Zaitseva, E., Zaitsev E., Melikov K., Arakelyan A., Marin M., Villasmil R., Margolis L.B., Melikyan G.B., and Chernomordik L.V.. 2017. Fusion Stage of HIV-1 Entry Depends on Virus-Induced Cell Surface Exposure of Phosphatidylserine. Cell Host Microbe. 22:99–110.e7. 10.1016/j.chom.2017.06.012 [DOI] [PMC free article] [PubMed] [Google Scholar]
- Zhang, L., Zhou H., Belzile O., Thorpe P., and Zhao D.. 2014. Phosphatidylserine-targeted bimodal liposomal nanoparticles for in vivo imaging of breast cancer in mice. J. Control. Release. 183:114–123. 10.1016/j.jconrel.2014.03.043 [DOI] [PubMed] [Google Scholar]
- Zhang, Y., Le T., Grabau R., Mohseni Z., Kim H., Natale D.R., Feng L., Pan H., and Yang H.. 2020. TMEM16F phospholipid scramblase mediates trophoblast fusion and placental development. Sci. Adv. 6:eaba0310 10.1126/sciadv.aba0310 [DOI] [PMC free article] [PubMed] [Google Scholar]
- Zhang, Y., Zhang Z., Xiao S., Tien J., Le S., Le T., Jan L.Y., and Yang H.. 2017. Inferior Olivary TMEM16B Mediates Cerebellar Motor Learning. Neuron. 95:1103–1111.e4. 10.1016/j.neuron.2017.08.010 [DOI] [PMC free article] [PubMed] [Google Scholar]
- Zhao, D., Stafford J.H., Zhou H., and Thorpe P.E.. 2011. Near-infrared Optical Imaging of Exposed Phosphatidylserine in a Mouse Glioma Model. Transl. Oncol. 4:355–364. 10.1593/tlo.11178 [DOI] [PMC free article] [PubMed] [Google Scholar]
Associated Data
This section collects any data citations, data availability statements, or supplementary materials included in this article.
Supplementary Materials
shows the comparison of pHi sensitivity of TMEM16F current measurements using Boltzmann and linear fits.
Data Availability Statement
We deposited the source data file, all the video files, and the Matlab code used to analyze fluorescence images to Dyrad (https://datadryad.org/stash/dataset/doi:10.5061/dryad.b8gtht79d).


