Abstract
Problem:
We hypothesize that activated peritoneal immune cells can be redirected to target ovarian tumors. Here, we obtain fundamental knowledge of the peritoneal immune environment through deep immunophenotyping of T cells, dendritic cells (DC) and innate lymphoid cells (ILC) of ovarian cancer patients.
Method of study:
T cells, DC and ILC from ascites of ovarian cancer patients (n=15) and peripheral blood of post-menopausal healthy donors (n=6) were immunophenotyped on a BD Fortessa cytometer using three panels- each composed of 16 antibodies. The data were analyzed manually and by t-SNE/DensVM. CA125 levels were obtained from patient charts.
Results:
We observed decreased CD3+ T cells and a higher proportion of activated CD4+ and effector memory CD4+/CD8+ T cells, plasmacytoid DC, CD1c+ and CD141+ myeloid DC and CD56Hi NK cells in ascites. t-SNE/DensVM identified eight T cell, 17 DC and 17 ILC clusters that were unique in the ascites compared to controls. Hierarchical clustering of cell frequency distinctly segregated the T cell and ILC clusters from controls. Increased CA125 levels were associated with decreased CD8+/CD45RA+/CD45RO−/CCR7− T cells.
Conclusions:
The identified immune clusters serve as the basis for interrogation of the peritoneal immune environment and the development of novel immunologic modalities against ovarian cancer.
Keywords: Ovarian cancer, Immunophenotyping, Peritoneal fluid, ascites, CD8 T cells, Innate lymphoid cells, dendritic cells, CA125
1. Introduction
High grade serous ovarian cancer (HGSOC) originates in the secretory epithelium of the fallopian tubes or from cortical inclusion cysts in the ovary 1–3. Metastasis beyond these primary tissues occurs at preferred sites such as the omentum, diaphragm and serosal surfaces within the peritoneal cavity. Proliferation of serous ovarian tumors at these primary and secondary sites is associated with accumulation of ascites in the majority of HGSOC patients 4–6. Obstruction of the lymphatic ducts is the cause for accumulation of this peritoneal exudate 5,7,8. Ascites contains acellular factors derived from the tumors, the mesothelial linings as well as the underlying stroma. Cytokines, chemokines, growth factors and other molecules present in the peritoneal fluid and their potential roles in progression and metastasis of ovarian tumors are topics of intense interest 9. There is also a significant cellular component in ascites that is composed of tumor cells and spheroids, mesothelial cells, stromal cells and immune cells 5,9,10. In this study, we employ deep immunophenotyping to map the complex immune milieu present in the ascites of HGSOC patients.
There are separate immune cell compartments in most patients with cancer that influence tumor progression. Immune cells in peripheral circulation are most studied for their phenotype as well as their potential roles in developing immunotherapies against HGSOC. The second compartment includes the immune cells infiltrating the solid tumor microenvironment. Supporting an important role for adaptive immune cells, infiltrating CD8+ T cell are positively associated with survival in multiple studies 11,12.
The immune cells in ascites constitute the third most relevant immune compartment in HGSOC. There are limited studies conducted on this compartment even though the immune cells in ascites represent all major subsets of lymphoid and myeloid lineages 13–15. Ascites immune cells are abundant (typically >100 million per patient; Patankar et al unpublished observations), however, their composition, function and relationship to immune cells infiltrating ovarian tumor stroma remains obscure. The potential for ascites immune cells to target and lyse tumor cells/masses is not well defined. There is evidence that the peritoneal NK cells have suppressed cytolytic activity 16. In contrast, biology of the peritoneal cytolytic T cells or the drivers of adaptive immunity, dendritic cells is poorly understood. Potential of such an abundant source of readily accessible immune cells for development of immunotherapy regimens is also understudied.
This study was undertaken to develop a foundation for understanding and harnessing the peritoneal immune environment of HGSOC patients. We have employed high-dimensional immunophenotyping to identify common and unique subsets of T cells, dendritic cells and innate lymphoid cells (ILCs). The focus on these three immune groups is due to their established role in immunologic control of tumor progression. Ascites immunome datasets from HGSOC patients were visualized by dimensionality reduction and analyzed by support vector assisted machine learning (densVM) algorithms to identify immune cells and their distribution patterns. These fundamental datasets will serve as the basis for deeper exploration of the peritoneal immune cells and their roles in the biology, patient stratification and therapy of HGSOC.
2. Materials and Methods
2.1. Human Samples
Ascites samples were obtained from patients with ovarian cancer who were recruited at the time of their initial diagnosis (Table 1). None of the patients had been previously treated for their disease at the time of sample collection. All patients signed an informed consent and the studies were approved by the Institutional Review Board of University of Wisconsin-Madison. Ascites samples were heparinized at time of collection and then spun in a Beckman centrifuge at 450xg, 25°C for 20 minutes. The liquid fraction was removed and frozen for later use, while the cell pellet was washed twice in PBS-1%FBS for 10 minutes each at 300xg. Cells were counted and resuspended at appropriate concentrations in FBS-10% DMSO, frozen, and stored in liquid nitrogen until needed.
Table 1.
Demographic and diagnosis information of ovarian cancer patients included in this study
| Patient Number | Age at Diagnosis | Diagnosis | Stage | Grade, cell type | CA-125 at Diagnosis |
|---|---|---|---|---|---|
| OSC94 | 73 | Ovarian cancer | IIIC | High grade papillary serous | 1252 |
| OSC97 | 69 | Ovarian cancer | IV | High grade papillary serous | 608 |
| OSC15 | 55 | Ovarian cancer | IIIC | High grade papillary serous | 595 |
| OSC61 | 48 | Ovarian cancer | IIIC | Low grade papillary serous | 411 |
| OSC32 | 56 | Ovarian cancer | IIIC | Poorly differentiated adenocarcinoma of the ovary | 496 |
| OSC108 | 69 | Ovarian cancer | IIIC | High grade papillary serous | 1150 |
| OSC53 | 61 | Ovarian cancer | IIIC | High grade papillary serous | 624 |
| OSC17 | 77 | Ovarian cancer | IIIC | High grade papillary serous | 506 |
| OSC119 | 51 | Fallopian tube cancer | IIIC | High grade papillary serous | 376 |
| OSC110 | 66 | Ovarian cancer | IIIC | High grade papillary serous | 2357 |
| OSC95 | 44 | Ovarian cancer | IIIC | Papillary serous | 1787 |
| OSC130 | 62 | Ovarian cancer | IV | Poorly differentiated neuroendocrine, high-grade serous and endometrioid | 275 |
| OSC107 | 57 | Fallopian tube cancer | IIIC | High grade serous adenocarcinoma | 798 |
| OSC75 | 57 | Ovarian cancer | IIIC | High grade serous | 1191 |
| OSC134 | 71 | Ovarian cancer | IIIC | High grade serous | 1419 |
2.2. Flow Cytometry and Standardization
Isolated mononuclear cells were first labeled with Zombie® NIR stain (BioLegend) according to manufacturer’s instructions to discriminate live/dead cells. MCs were then labeled with flourochrome-conjugated monoclonal antibodies, listed in Table 2, as previously described 17. Samples were then acquired using the LSR Fortessa in a five laser (355nm, 405nm, 488nm, 562nm, 633nm) 20-detector configuration (BD Biosciences).
Table 2.
Antibodies used for flow cytometry analysis.
| Marker | Clone | Fluorochrome | Supplier |
|---|---|---|---|
| CCR4 | 1G1 | PerCP-Cy5.5 | BD Bioscience |
| CCR6 | 11A9 | BUV496 | BD Bioscience |
| CCR7 | G043H7 | Alexa647 | BioLegend |
| CD117 | 104D2 | BB515 | BD Bioscience |
| CD11b | ICRF44 | BV605 | BD Bioscience |
| CD11c | B-ly6 | BB515 | BD Bioscience |
| CD123 | 7G3 | BUV395 | BD Bioscience |
| CD127 | A019D5 | BV785 | BioLegend |
| CD14 | MOP9 | BV510 | BD Bioscience |
| CD141 | 1A4 | APC | BD Bioscience |
| CD16 | 3G8 | BUV496 | BD Bioscience |
| CD161 | DX12 | BV650 | BD Bioscience |
| CD19 | SJ25C1 | PE-Cy7 | BD Bioscience |
| CD19 | SJ25C1 | BV510 | BD Bioscience |
| CD1c | L161 | PE-Dazzle594 | BioLegend |
| CD209 | DCN46 | PerCP-Cy5.5 | BD Bioscience |
| CD25 | 2A3 | BB515 | BD Bioscience |
| CD27 | M-T271 | BV421 | BD Bioscience |
| CD3 | SK7 | PE-Cy7 | BD Bioscience |
| CD3 | UCHT1 | BV510 | BD Bioscience |
| CD33 | WM53 | PE | BioLegend |
| CD335 (NKp46) | 9E2/NKp46 | PE | BD Bioscience |
| CD34 | 581 | PE-Cy5 | BD Bioscience |
| CD4 | SK3 | BV510 | BD Bioscience |
| CD45 | 2D1 | Alexa700 | BioLegend |
| CD45RA | HI100 | Alexa700 | BD Bioscience |
| CD45RO | UCHL1 | PE | BioLegend |
| CD49a | TS2/7 | PE-Vio770 | Miltenyi |
| CD56 | NCAM16.2 | BV421 | BD Bioscience |
| CD56 | B156 | PE-Cy7 | BD Bioscience |
| CD62L | Dreg-56 | PE-CF594 | BD Bioscience |
| CD8 | SK1 | BV605 | BD Bioscience |
| CD8 | RPA-T8 | BV421 | BD Bioscience |
| CD80 | L307.4 | Alexa700 | BD Bioscience |
| CD94 | HP-3D9 | PerCP-Cy5.5 | BD Bioscience |
| CXCR3 | AC6/CXCR3 | PE-Cy5 | BD Bioscience |
| CXCR4 | 12G5 | BUV395 | BD Bioscience |
| Eomes | WM53 | PE-eFluor610 | eBioscience |
| HLA-DR | G46–6 | BV786 | BD Bioscience |
| HLA-DR | G46–6 | BUV395 | BD Bioscience |
| RORγt | AFKJS-9 | APC | eBioscience |
| T-bet | O4–46 | BV650 | BD Bioscience |
2.3. Data Analysis
FlowJo v.10 software (FlowJo LLC, Ashland, OR) was used to identify well-characterized populations. Unbiased identification of immune cells was performed using Cytofkit (github.com/JinmiaoChenLab/cytofkit) 18. Data was pre/post processed as previously described 17. Statistical significance was determined unpaired t-test, using Prism® v. 8 (GraphPad Software, Inc, La Jolla, CA).
3. Results
3.1. Subset diversity of adaptive T cells in High Grade Serous Ovarian Cancer Ascites
To determine the abundance and functional diversity of CD4+ and CD8+ T cells in High Grade Serous Ovarian Cancer (HGSOC) ascites, we first devised and validated a 16-marker panel (Table 2) to comprehensively phenotype subtypes and effector status using healthy post-menopausal donor peripheral blood mononuclear cells (PBMCs; Supplementary Figure 1). Hereafter, in this study, we employ HD PBMCs as technical reference, and not as a comparator for the phenotype of the immune cells in the ascites of HGSOC patients. Experiments with the HD PBMC samples indicated that relative abundance of CD3+T cells was above 40% in all donors (Supplementary Figure 1G). The CD4+ T cells were more abundant than CD8+ T cells (Supplementary Figure 1H). Higher proportion of the CD4+ T cells were of the TH2 phenotype and nearly all of the Tregs were memory T cells (Supplementary Figure 1 I and J). Additionally, majority of the CD8+ T cells were of the effector memory phenotype (Supplementary Figure 1K). The distribution of the T cell subsets is in accordance with published literature, therefore providing us a general validation of the T cell phenotyping antibody panel and the flow cytometry gating methods used in our analysis.
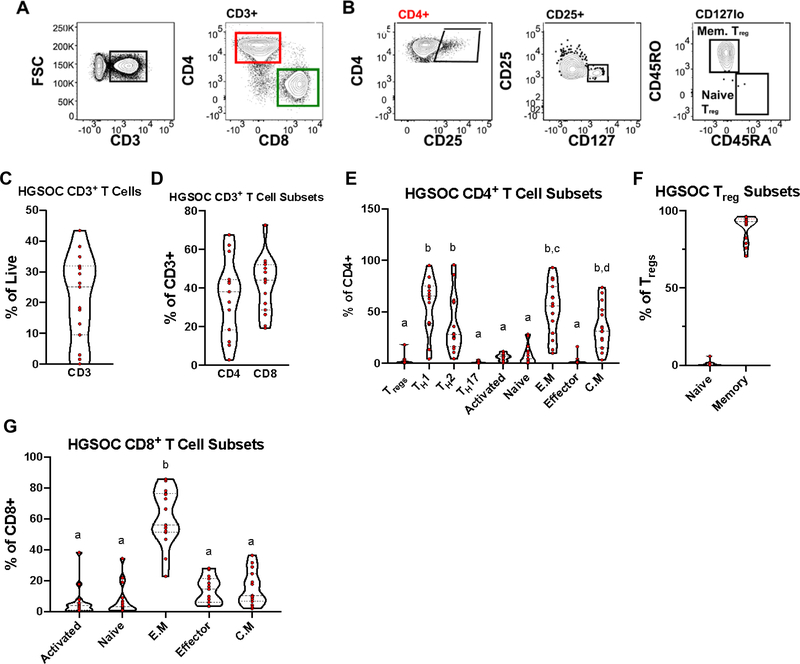
Of the fifteen HGSOC ascites samples analyzed, three patients had very low levels (<10% relative abundance) of CD3+ T cells (Figure 1C; Supplementary Figure 2). For the majority of the patients (8/15), the relative abundance of the CD3+ T cells was between 25–42% of the total live CD45+ immune cells (Figure 1C). In general, all of the HGSOC ascites samples had comparable proportion of CD4+ and CD8+ T cells (Figure 1D). Further analysis of T cell subsets found a greater proportion were TH1, TH2, effector memory, and central memory (Figure 1E), with the majority of Tregs in HGSOC ascites being of the memory phenotype (Figure 1F).
Figure 1.
T Cells Identified in High Grade Serous Ovarian Cancer Ascites Mononuclear cells isolated from High Grade Serous Ovarian Cancer (HGSOC) ascites samples were stained with T cell specific markers. (A) Representative gating scheme identifying CD3+ T cells (left) and CD4/CD8 subsets (right) in HGSOC ascites. (B) Representative gating scheme identifying regulatory T cells (Treg) and Treg subsets. (C) Proportion of CD3+ T cells in HGSOC from total live cells. (D) Proportion of CD4+ and CD8+ from CD3+ T cells. (E) Proportion of CD4+ T cell subsets. (F) Proportion of Treg subsets. (G) Proportion CD8+ T cells subsets. Data represented as max/min, median, and 25th and 75th percentiles. Statistical significance was determined by ANOVA followed by Tukey test and are demonstrated by letters, with different letters indicating statistical differences within a subset (<0.05). HGSOC, n = 15.
Next, we examined the different proportions of CD8+ T cells and found that a large proportion of CD8+ T in HGSOC ascites have an effector memory phenotype (Figure 1G). Overall, these data shows an equal distribution of CD4+ and CD8+ T in HGSOC ascites, with an enrichment of enriched TH1, TH2, effector memory, and central memory.
3.2. Dendritic cell distribution in HGSOC Ascites
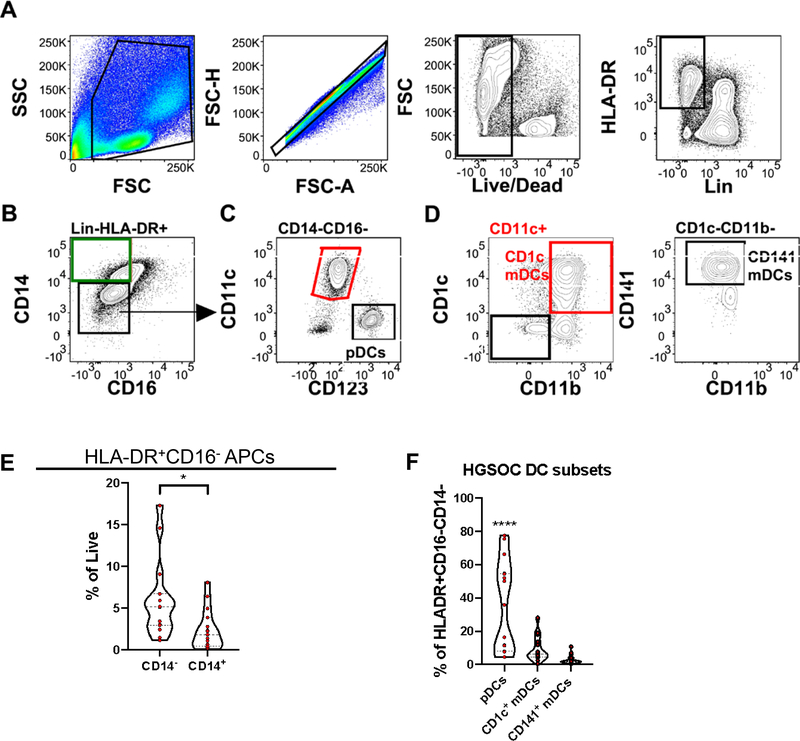
Because of their importance in bridging the innate and adaptive arms of the immune system, we analyzed antigen presenting cells (APCs) in HGSOC ascites. The antibody panel for analysis of APCs was first tested on HD PBMCs samples (Supplementary Figure 3). A key observation from the HD PBMC samples was that a higher proportion of APCs in HD PBMCs had an HLA-DR+CD16−CD14+ phenotype, indicative of macrophages (Supplementary Figure 3). Dendritic cells (DCs), key APCs 19, classically defined by a HLA-DR+CD16−CD14− phenotype (Figure 2A,B) were a higher proportion of APCs in HGSOC ascites (Figure 2E).
Figure 2.
Antigen presenting cells identified in HGSOC ascites. Mononuclear cells isolated from HGSOC ascites samples were stained with antigen presenting cell (APCs) lineage defining markers. (A) Representative gating scheme identifying Lin(CD3,19,56)−HLA-DR+ cells in HGSOC ascites samples. (B) Representative gating scheme identifying dendritic cells (DCs; HLA-DR+CD14−CD16−) and macrophages (HLA-DR+CD14+CD16−). (C) Representative gating scheme identifying myeloid (mDCs) and plamacytoid dendritic cells (pDCs). (D) Representative gating scheme identifying CD1c+ mDCs (left) and CD141+ mDCs (right). (E) Proportion of HLA-DR+CD16− CD14− and CD14+ APCs from total live cells. (F) Proportion of pDCs, CD1c mDCs, and CD141 mDCs from total DCs. Data represented as max/min, median, and 25th and 75th percentiles. Statistical significance was determined by ANOVA followed by Tukey test. *p < 0.05, ****p < 0.0001. HGSOC, n = 15.
Increasing recognition of phenotypically diverse and tissue-specific DC/macrophage subsets led us to first examine the well-defined subtypes within the HLA-DR+CD16−CD14− DC group. Plasmacytoid DCs (pDCs) (Figure 2C) were found to be the more represented subset in HGSOC ascites (Figure 2F). Collectively our data reveal a high proportion of DCs in HGSOC ascites with most being pDCs, and a reduction of CD14+ macrophages.
3.3. Innate lymphoid cells in HGSOC ascites
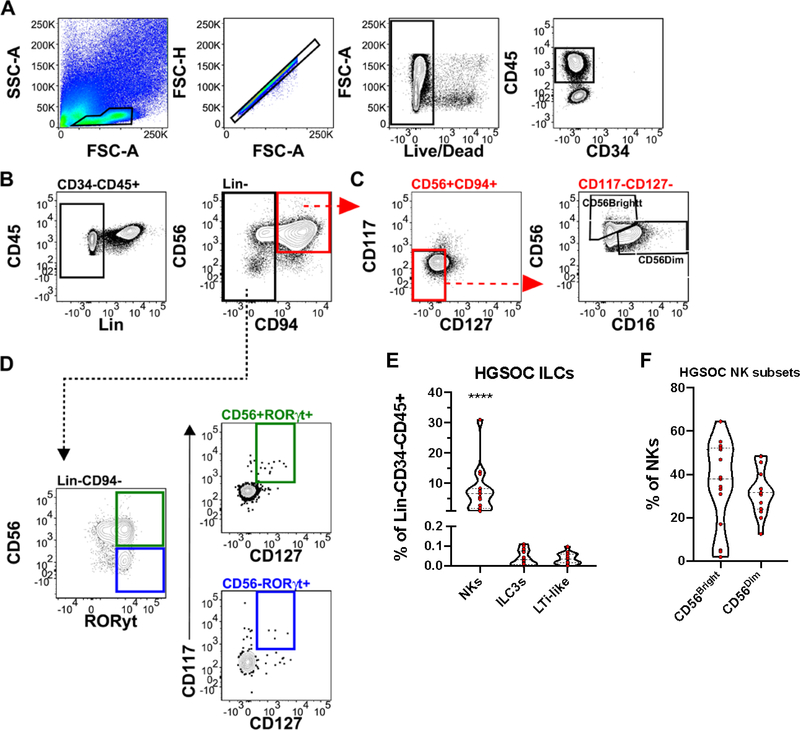
Innate lymphoid cells (ILCs), described by their lack of antigen-specific receptors, have been found to mirror the TH cytokine profiles 20. Use of both surface and intracellular markers (Table 2 and Supplementary Table 1), allowed us to identify lineage negative (CD3, CD14, CD19), CD34−CD45+ ILCs in HGSOC ascites and HD PBMCs (Figure 3, Supplementary Figure 4). Moreover, we identified conventional CD56Hi and CD56Low natural killer cells (NKs) (Figure 3C), ILC3s (CD56+RORγt+), and LTi-like cells (CD56−RORγt+) in HGSOC ascites (Figure 3D). NK cells were found in higher proportion in HGSOC ascites compared to ILC3s and LTi-like cells (Figure 3E). A similar pattern was observed in HD PBMCs (Supplementary Figure 4E). Analysis of NK subsets, CD56Bright and CD56Dim, found an equal proportion in HGSOC ascites (Figure 3F). Overall, we found a greater proportion of NK cells in HGSOC ascites, with no difference in proportions of ILC3s or LTi-like cells.
Figure 3.
Innate Lymphoid Cells Identified in HGSOC Ascites. Mononuclear cells isolated from HGSOC ascites samples were stained with innate lymphoid cells (ILC) lineage defining markers. (A) Representative gating scheme identifying CD34−CD45+ cells in HGSOC ascites samples. (B) Representative gating scheme identifying Lin (CD3, 14, 19) negative ILCs. (C) Representative gating scheme identifying natural killer cells (NKs) and NK subsets, CD56Bright/Dim. (D) Representative gating scheme identifying ILC3s (top) and Lti-like (bottom) cells. (E) Proportion of NKs, ILC3s, and LTi-like cells in HGSOC ascites from total lineage negative lymphoid cells (F) Proportion of NK cells subsets from total NK cells. Data represented as max/min, median, and 25th and 75th percentiles. Statistical significance was determined by ANOVA followed by Tukey test. ****p < 0.0001. HGSOC, n = 15.
3.4. Clustering analysis reveals a unique immunome signature of HGSOC ascites
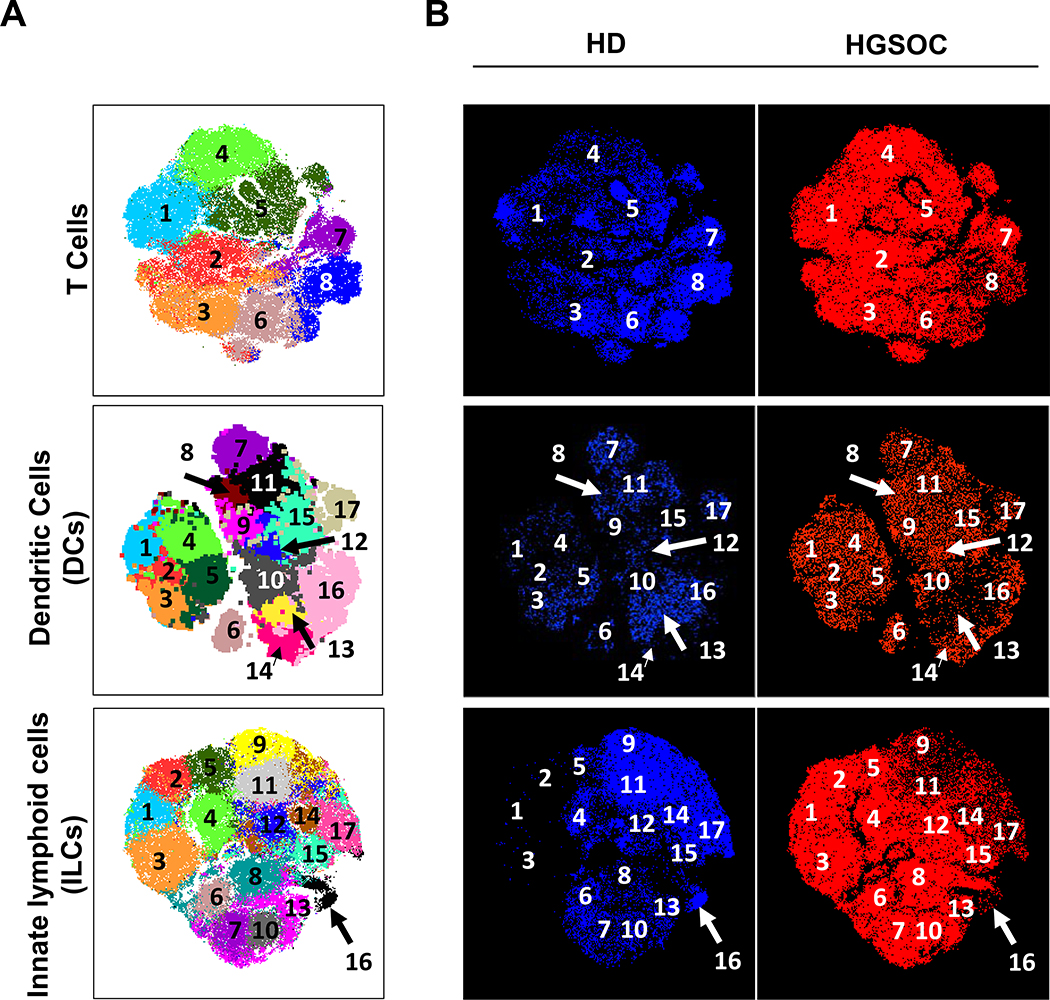
To test whether HGSOC ascites have a unique immunome, we employed dimensionality reduction to analyze the three data sets. To benchmark our computational analysis and ensure that cluster identification was consistent with published literature, we included the data from HD PBMCs as internal controls. Pre-gated populations of interest from each data set (T cells, DCs, and ILCs) were visualized with t-SNE dimensionality reduction and partitioned with DensVM clustering (Figure 4A). t-SNE/DensVM identified 8 unique clusters within the T cell data set and 17 unique clusters for both the ILC and DC data sets (Figure 4A). In addition, when HD PBMCs and HGSOC ascites samples were visualized separately, distinct cluster distributions were observed for both ILCs and T cells (Figure 4B). This analysis also allowed for unbiased phenotyping of clusters identified by t-SNE/DensVM (Supplementary Figure 5, Supplementary Table 1).
Figure 4.
Subset diversity in HGSOC ascites as revealed dimensionality reduction visualization. (A) t-SNE map generated for pre-gated CD3+ T cells (top), Lin−CD14−CD16−HLADR+ DCs (middle), and Lin−CD34−CD45+ ILCs (bottom). (B) Separate HD and HGSOC visualized using t-SNE maps generated from merged data set for T cells (top), DCs (middle), and ILCs (bottom).
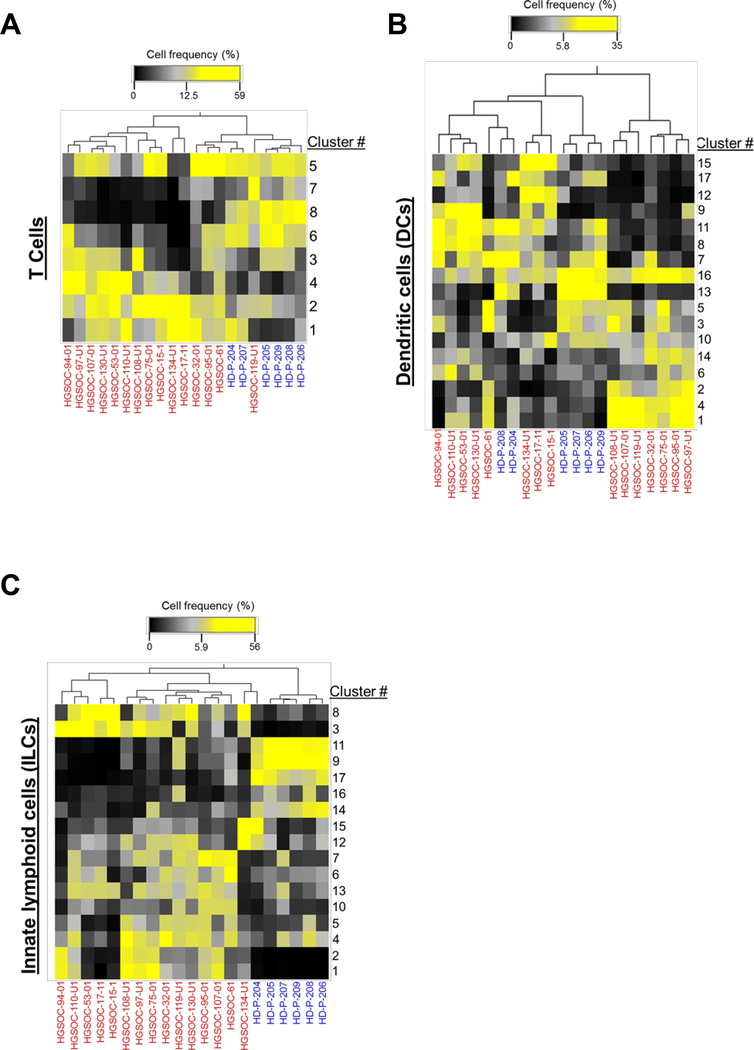
In order to assess the variation in immune cell clusters among patients, we conducted hierarchical clustering based on cell frequency distribution. First, T cell cluster distribution showed low degree of segregation between the HGSOC ascites samples (Figure 5A). The frequencies of clusters 2 and 4 were generally uniformly higher in all of the HGSOC patients (Figure 5A). In contrast, frequencies of clusters 7 and 8 were lower in the majority of the HGSOC ascites samples (Figure 5A).
Figure 5.
Cluster distribution analysis reveals unique HGSOC immune signature. Hierarchical clustering of cluster frequencies within T cells, DCs, and ILCs from HGSOC (red) and HD (blue).
Cluster distribution from the DC dataset revealed two major groupings of the HGSOC ascites samples (Figure 5B). Two clusters (#1 and #14) that were enriched in HGSOC ascites samples, highlighting populations (CD8α−, CD11b− dendritic cells and CD11b+ dendritic cells, respectively) that were not captured in our manual analysis (Figure 2).
Similarly, to T cell clustering results, ILCs cluster distribution showed lower degree of distinction between the HGSOC ascites samples (Figure 5C), with segregation of HGSOC ascites from HD samples. Clusters #1, 2, 3, and 13 were all elevated in HGSOC ascites samples. Clusters #1–3 were found to be tissue-resident-like natural killer cells (Supplementary Table 1). Interestingly, clusters #9, 11, 14, and 17 (all fitting the phenotype of cNKs) were elevated in HD PBMC samples, in agreement with our manual data analysis (Supplementary Figure 4F).
3.5. Correlation of immune cell subsets from ascites with serum CA125 levels.
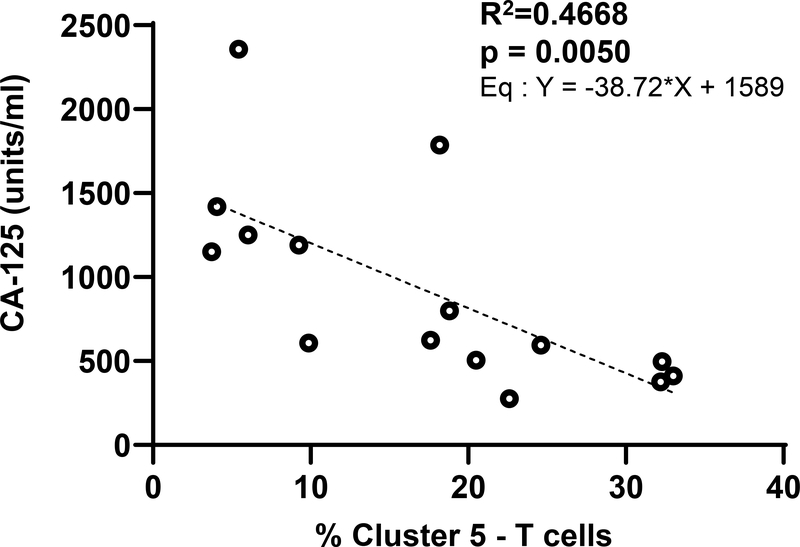
The serum levels of the biomarker CA125 typically correspond to ovarian cancer disease progression. We reasoned that since an increase in serum CA125 is associated with higher tumor burden, there would likely be a correlation between the levels of serum CA125 and specific immune cell types in the ascites. While the study was not significantly powered to directly correlated CA125 levels with majority of the clusters identified through our deep immunophenotyping, the most significant correlation was observed with the CD8+ T effector cells defined by Cluster #5 (Figure 6). This cluster is defined as T cells that are CD8+/CD45RA+/CD45RO−/CCR7−. Elevated serum CA125 levels were highly correlated with decreased proportion of Cluster #5 (Figure 6).
Figure 6.
Initial CA-125 level is inversely correlated to proportion of ascites CD8 effector cells. Linear regression plot of first CA-125 level against proportion of cluster 5 (CD8+ CD45RA+ CD45RO- CCR7-CD62L-) T cells.
4. Discussion
The results of this study provide a framework for deep immunophenotyping to identify unique subsets of immune cells present in the peritoneal fluid of HGSOC patients. In this study, we have specifically characterized T cells, dendritic cells and ILC subsets from the ascites of HGSOC patients. Immune cells in ascites of ovarian cancer patients have been previously identified and characterized using conventional flow cytometry methods 21–24. These previous approaches require cell labeling and analysis in batches as only limited number of fluorophores were included in each experiment. Our deep immunophenotyping approach has allowed us to characterize multiple subsets of T cells, DCs and ILCs in a single experiment. This approach not only provides more clarity of the different subsets of immune cells but also allows us to capture this data using minimum amount of biological samples. The T and DC subsets identified in our studies in addition to the information provided in previous studies is providing important insights into the immune environment in the peritoneum of ovarian cancer patients. To our knowledge, our study is the first to characterize the peritoneal ILCs from this patient population.
Manual analysis of the flow cytometry data suggests that the ascites immune cells have a higher proportion of activated CD4+ and effector memory (both CD4+ and CD8+) T cells. An increase in DCs and the DC subsets (pDCs and CD1c+ and CD141+ mDCs) is also observed in the HGSOC ascites.
Another major finding from the manual analysis of the flow cytometry results was the significant increase in proportion of the CD56bright NK cells. This population of NK cells is compromised in cytolysing cancer targets but is more efficient in producing cytokines. To the contrary, the CD16+ NK cell population that is classically associated with cytotoxic responses was significantly reduced in the HGSOC ascites. This observation confirms our previous studies where we demonstrated that MUC16, a mucin highly expressed by ovarian tumors downregulates CD16 on NK cells and suppresses their cytolytic function 13,25–27. In this context, it is important to note that the serum levels of CA125, a repeating peptide epitope present in MUC16 26,28,29, negatively correlate with the proportion of CD8 effector cells in the peritoneal environment. This correlation may result from the fact that higher levels of serum CA125 reflect a more advanced state of the cancer and hence a more immunocompromised peritoneal environment. It will also be important to determine if similar to the immunosuppressive effects of MUC16 on NK cells, this mucin also plays a role in suppressing cytolytic T cell responses. Our demonstration that MUC16 is a ligand of the glycoimmune checkpoint receptor Siglec-9, an inhibitory ITIM-containing receptor that negatively regulates innate and adaptive immune cells is significant in this context because increase expression of Siglec-9 has been detected on T cells in the ovarian cancer microenvironment 25,30–32.
The multiparameter deep-immunophenotyping data afford us the opportunity to classify multiple subsets of the immune cells from ascites and conduct hierarchical clustering. Eight unique clusters of T cells and 17 individual clusters of DC and ILCs were identified based on the level of expression of the cell surface markers that are the hallmarks of each cluster. t-SNE mapping of the cluster frequencies showed a shared hierarchy of the T cell and ILCs of the ascites immune cells. The shared hierarchy of the peritoneal immune cells among HGSOC patients suggest that the immune cells are under the influence of common activating and suppressive factors that influence the phenotype of the T cells and ILCs. This finding indicates that the phenotypes identified in in this study are representative of a significant proportion of HGSOC patients. In the future, it will be important to determine if there is an association between the proportions of the peritoneal immune cell subsets with the mutations found in the serous ovarian tumors.
A limitation of our study is that the phenome of the immune cells from the HGSOC ascites fluid was compared with that of the T cells, DC and ILC from the peripheral blood of healthy donors. We are in the process of obtaining a bank of matched immune cell samples from the ascites and peripheral blood of HGSOC patients. Future studies will compare the phenome of the immune cells from these matching set of immune cell samples. However, it should be noted that in our previous studies conducted with a limited panels of antibodies, we did not observe major differences in the phenotypes of T cells, B cells and NK cells from the peripheral blood of HGSOC patients and healthy donors 13. Therefore, we expect that similar to the immune cells from healthy donors, the peripheral T cells and ILCs of HGSOC patients will show a hierarchy that is distinct than the immune cells from the ascites.
The deep immunophenotyping results provide important insights into the peritoneal immune environment of HGSOC patients. It is expected that the results from these studies can be used to manipulate the peritoneal immune cells and redirect them to target the metastasized ovarian tumors. Immunotherapeutic agents that activate the peritoneal immune cells and block the immunosuppressive mechanisms can be used to develop robust immunologic responses against HGSOC.
We have conducted a detailed analysis of the T cells, DCs and ILCs from the peritoneal fluid of HGSOC patients. Through deep immunophenotyping we have identified unique clusters of the peritoneal immune cells. The T cells and ILC from HGSOC ascites hierarchically cluster together as compared to the immune cell subsets from the peripheral blood of healthy donors. Since the ascites samples were obtained from HGSOC patients prior to their debulking surgery and chemotherapy, the phenotypes identified in this study are the result of the influence of factors produced in the tumor microenvironment. Therefore, these phenotypes should be considered as the baseline for peritoneal immune cells in HGSOC patients. These baseline phenotypes can be compared to those identified in future studies where the HGSOC patients are treated with immunotherapies. Such comparisons will provide an assessment of the functional capacity of the peritoneal immune cells in response to the treatment modalities. Additionally, the deep phenotyping datasets can also be used to identify and expand immune cell subsets that can most effectively be used to target peritoneal ovarian tumors.
Supplementary Material
Supplementary File 1. Identification of T cells and T cell subsets in HD PBMCs.
Supplementary File 2. Identification of T cells and T cell subsets in HGSOC Ascites.
Supplementary File 3. Identification of antigen presenting cells (APCs) in HD PBMCs.
Supplementary File 4. Identification of innate lymphoid cells (ILCs) in HD PBMCs.
Supplementary File 5. T cell, DC and ILC clusters as defined by expression levels of specific antigens.
Supplementary Table 1. Classification of T cell, DC and ILC clusters based on potential function. The predictions of the phenotypes are based on extensive literature searches.
Acknowledgements
This research was supported by the bridge grant (ID: 598088) from the Rivkin Center for Ovarian Cancer to MSP and intramural research funds provided by the Department of Obstetrics and Gynecology to LB, MSP and AKS. J.V. was supported by NIH TEAM-Science (R25 GM083252) and UW SciMed GRS Fellowship. M.C. was supported by WISE Summer Research Grant. A.K.S. was supported by NIH/NICHD Reproductive Scientist Development Program (5K 12HD000849-28), March of Dimes Basil O’Connor Award (5-FY18-541), and Burroughs Wellcome Fund (1019835). Studies were supported by University of Wisconsin Carbone Cancer Center Support Grant (P30 CA014520). The BD Fortessa analytical cytometer used in the studies was supported by a special instrumentation grant (1S100OD018202-01). D. Sheerar and R. Sheridan from UWCCC Flow lab are acknowledged for technical support.
Footnotes
Conflict of interest disclosure statement. All of the co-authors declare that they do not have any relationships that could be construed as resulting in an actual, potential, or perceived conflict of interest with regard to the manuscript being submitted for review.
References
- 1.Labidi-Galy SI, Papp E, Hallberg D, et al. High grade serous ovarian carcinomas originate in the fallopian tube. Nat Commun. 2017;8(1):1093. [DOI] [PMC free article] [PubMed] [Google Scholar]
- 2.Visvanathan K, Shaw P, May BJ, et al. Fallopian Tube Lesions in Women at High Risk for Ovarian Cancer: A Multicenter Study. Cancer Prev Res (Phila). 2018;11(11):697–706. [DOI] [PMC free article] [PubMed] [Google Scholar]
- 3.Kurman RJ, Shih Ie M. Molecular pathogenesis and extraovarian origin of epithelial ovarian cancer--shifting the paradigm. Hum Pathol. 2011;42(7):918–931. [DOI] [PMC free article] [PubMed] [Google Scholar]
- 4.Ahmed N, Stenvers KL. Getting to know ovarian cancer ascites: opportunities for targeted therapy-based translational research. Frontiers in oncology. 2013;3:256–256. [DOI] [PMC free article] [PubMed] [Google Scholar]
- 5.Kipps E, Tan DS, Kaye SB. Meeting the challenge of ascites in ovarian cancer: new avenues for therapy and research. Nat Rev Cancer. 2013;13(4):273–282. [DOI] [PMC free article] [PubMed] [Google Scholar]
- 6.Ayantunde AA, Parsons SL. Pattern and prognostic factors in patients with malignant ascites: a retrospective study. Ann Oncol. 2007;18(5):945–949. [DOI] [PubMed] [Google Scholar]
- 7.Holm-Nielsen P Pathogenesis of ascites in peritoneal carcinomatosis. Acta Pathol Microbiol Scand. 1953;33(1):10–21. [DOI] [PubMed] [Google Scholar]
- 8.Feldman GB, Knapp RC, Order SE, Hellman S. The role of lymphatic obstruction in the formation of ascites in a murine ovarian carcinoma. Cancer Res. 1972;32(8):1663–1666. [PubMed] [Google Scholar]
- 9.Milliken D, Scotton C, Raju S, Balkwill F, Wilson J. Analysis of chemokines and chemokine receptor expression in ovarian cancer ascites. Clin Cancer Res. 2002;8(4):1108–1114. [PubMed] [Google Scholar]
- 10.Sheid B Angiogenic effects of macrophages isolated from ascitic fluid aspirated from women with advanced ovarian cancer. Cancer Lett. 1992;62(2):153–158. [DOI] [PubMed] [Google Scholar]
- 11.Preston CC, Maurer MJ, Oberg AL, et al. The ratios of CD8+ T cells to CD4+CD25+ FOXP3+ and FOXP3- T cells correlate with poor clinical outcome in human serous ovarian cancer. PLoS One. 2013;8(11):e80063. [DOI] [PMC free article] [PubMed] [Google Scholar]
- 12.Hamanishi J, Mandai M, Iwasaki M, et al. Programmed cell death 1 ligand 1 and tumor-infiltrating CD8+ T lymphocytes are prognostic factors of human ovarian cancer. Proc Natl Acad Sci U S A. 2007;104(9):3360–3365. [DOI] [PMC free article] [PubMed] [Google Scholar]
- 13.Belisle JA, Gubbels JA, Raphael CA, et al. Peritoneal natural killer cells from epithelial ovarian cancer patients show an altered phenotype and bind to the tumour marker MUC16 (CA125). Immunology. 2007;122(3):418–429. [DOI] [PMC free article] [PubMed] [Google Scholar]
- 14.Hashimoto K, Honda K, Matsui H, Nagashima Y, Oda H. Flow Cytometric Analysis of Ovarian Cancer Ascites: Response of Mesothelial Cells and Macrophages to Cancer. Anticancer Res. 2016;36(7):3579–3584. [PubMed] [Google Scholar]
- 15.Gordon IO, Freedman RS. Defective antitumor function of monocyte-derived macrophages from epithelial ovarian cancer patients. Clin Cancer Res. 2006;12(5):1515–1524. [DOI] [PubMed] [Google Scholar]
- 16.Connor JP, Felder M, Hank J, et al. Ex vivo evaluation of anti-EpCAM immunocytokine huKS-IL2 in ovarian cancer. J Immunother. 2004;27(3):211–219. [DOI] [PubMed] [Google Scholar]
- 17.Vazquez J, Chavarria M, Li Y, Lopez GE, Stanic AK. Computational flow cytometry analysis reveals a unique immune signature of the human maternal-fetal interface. Am J Reprod Immunol. 2018;79(1). [DOI] [PMC free article] [PubMed] [Google Scholar]
- 18.Wong MT, Chen J, Narayanan S, et al. Mapping the Diversity of Follicular Helper T Cells in Human Blood and Tonsils Using High-Dimensional Mass Cytometry Analysis. Cell Rep. 2015;11(11):1822–1833. [DOI] [PubMed] [Google Scholar]
- 19.Banchereau J, Steinman RM. Dendritic cells and the control of immunity. Nature. 1998;392(6673):245–252. [DOI] [PubMed] [Google Scholar]
- 20.Tait Wojno ED, Artis D. Emerging concepts and future challenges in innate lymphoid cell biology. J Exp Med. 2016;213(11):2229–2248. [DOI] [PMC free article] [PubMed] [Google Scholar]
- 21.Bamias A, Tsiatas ML, Kafantari E, et al. Significant differences of lymphocytes isolated from ascites of patients with ovarian cancer compared to blood and tumor lymphocytes. Association of CD3+CD56+ cells with platinum resistance. Gynecol Oncol. 2007;106(1):75–81. [DOI] [PubMed] [Google Scholar]
- 22.Giuntoli RL 2nd, Webb TJ, Zoso A, et al. Ovarian cancer-associated ascites demonstrates altered immune environment: implications for antitumor immunity. Anticancer Res. 2009;29(8):2875–2884. [PubMed] [Google Scholar]
- 23.Wefers C, Duiveman-de Boer T, Yigit R, et al. Survival of Ovarian Cancer Patients Is Independent of the Presence of DC and T Cell Subsets in Ascites. Front Immunol. 2018;9:3156. [DOI] [PMC free article] [PubMed] [Google Scholar]
- 24.Lieber S, Reinartz S, Raifer H, et al. Prognosis of ovarian cancer is associated with effector memory CD8(+) T cell accumulation in ascites, CXCL9 levels and activation-triggered signal transduction in T cells. Oncoimmunology. 2018;7(5):e1424672. [DOI] [PMC free article] [PubMed] [Google Scholar]
- 25.Belisle JA, Horibata S, Jennifer GA, et al. Identification of Siglec-9 as the receptor for MUC16 on human NK cells, B cells, and monocytes. Mol Cancer. 2010;9:118. [DOI] [PMC free article] [PubMed] [Google Scholar]
- 26.Felder M, Kapur A, Gonzalez-Bosquet J, et al. MUC16 (CA125): tumor biomarker to cancer therapy, a work in progress. Mol Cancer. 2014;13:129. [DOI] [PMC free article] [PubMed] [Google Scholar]
- 27.Patankar MS, Jing Y, Morrison JC, et al. Potent suppression of natural killer cell response mediated by the ovarian tumor marker CA125. Gynecol Oncol. 2005;99(3):704–713. [DOI] [PubMed] [Google Scholar]
- 28.O’Brien TJ, Beard JB, Underwood LJ, Dennis RA, Santin AD, York L. The CA 125 gene: an extracellular superstructure dominated by repeat sequences. Tumour Biol. 2001;22(6):348–366. [DOI] [PubMed] [Google Scholar]
- 29.Yin BW, Lloyd KO. Molecular cloning of the CA125 ovarian cancer antigen: identification as a new mucin, MUC16. J Biol Chem. 2001;276(29):27371–27375. [DOI] [PubMed] [Google Scholar]
- 30.Stanczak MA, Siddiqui SS, Trefny MP, et al. Self-associated molecular patterns mediate cancer immune evasion by engaging Siglecs on T cells. J Clin Invest. 2018;128(11):4912–4923. [DOI] [PMC free article] [PubMed] [Google Scholar]
- 31.Ikehara Y, Ikehara SK, Paulson JC. Negative regulation of T cell receptor signaling by Siglec-7 (p70/AIRM) and Siglec-9. J Biol Chem. 2004;279(41):43117–43125. [DOI] [PubMed] [Google Scholar]
- 32.Avril T, Floyd H, Lopez F, Vivier E, Crocker PR. The membrane-proximal immunoreceptor tyrosine-based inhibitory motif is critical for the inhibitory signaling mediated by Siglecs-7 and −9, CD33-related Siglecs expressed on human monocytes and NK cells. J Immunol. 2004;173(11):6841–6849. [DOI] [PubMed] [Google Scholar]
Associated Data
This section collects any data citations, data availability statements, or supplementary materials included in this article.
Supplementary Materials
Supplementary File 1. Identification of T cells and T cell subsets in HD PBMCs.
Supplementary File 2. Identification of T cells and T cell subsets in HGSOC Ascites.
Supplementary File 3. Identification of antigen presenting cells (APCs) in HD PBMCs.
Supplementary File 4. Identification of innate lymphoid cells (ILCs) in HD PBMCs.
Supplementary File 5. T cell, DC and ILC clusters as defined by expression levels of specific antigens.
Supplementary Table 1. Classification of T cell, DC and ILC clusters based on potential function. The predictions of the phenotypes are based on extensive literature searches.


