

Abstract
Aims
Traditional criteria for heart transplantation by cardiopulmonary exercise testing (CPX) include peak oxygen uptake (VO2) < 14 mL/kg/min. Reaching a sufficient exercise load is challenging for patients with refractory heart failure (HF) because of their exercise intolerance. Recently, a substantial impact of right ventricular (RV) dysfunction was highlighted on urgent heart transplantation and mortality. This study aims to investigate the impact of RV contractile reserve, assessed by low‐load exercise stress echocardiography (ESE), on exercise intolerance defined as peak VO2 < 14 mL/kg/min, in patients with HF.
Methods and results
We prospectively examined 67 consecutive patients hospitalized for HF who underwent ESE and CPX under a stabilized HF condition. Although low‐load ESE was defined as 25 W load exercise, an increment in RV systolic (s′) velocity was regarded as the preservation of RV contractile reserve. All patients completed low‐load ESE. During low‐load ESE, the variation in RV s′ velocity significantly correlated with peak VO2 (r = 0.787, P < 0.001). The change in RV s′ velocity during low‐load ESE accurately identified patients with peak VO2 < 14 mL/kg/min (area under the curve, 0.95; sensitivity, 92%; specificity, 85%). The intraclass correlation coefficient for intra‐observer and inter‐observer agreement for the change in RV s′ velocity was 0.96 (95% confidence interval, 0.88–0.99, P < 0.001) and 0.86 (95% confidence interval, 0.64–0.95, P < 0.001), respectively. The RV‐to‐pulmonary circulation (PC) coupling, which was assessed by the slope of the relationship between RV s′ velocity and pulmonary artery systolic pressure at rest and low‐load exercise, was worse in the low‐peak VO2 group (<14 mL/kg/min) than the preserved‐peak VO2 group (≥14 mL/kg/min).
Conclusions
The change in RV s′ velocity during low‐load ESE could estimate the exercise capacity in HF patients. The assessments of RV contractile reserve and RV‐to‐PC coupling could be clinically beneficial to distinguish high‐risk HF patients.
Keywords: exercise stress echocardiography, cardiopulmonary exercise testing, right ventricular contractile reserve, heart failure, low‐load exercise, right ventricular‐to‐pulmonary circulation coupling
Introduction
In a clinical setting, cardiopulmonary exercise testing (CPX) is used to evaluate the exercise capacity of patients with heart failure (HF). 1 Peak oxygen uptake (VO2) is the most objective indicator of exercise capacity during maximum exercise as well as a crucial prognostic parameter in patients with HF. 2 Essentially, peak VO2 < 14 mL/kg/min is a critical value when estimating high‐risk patients who require advanced HF interventions such as heart transplantation and ventricular assist devices. 3 Thus, the threshold of peak VO2 < 14 mL/kg/min is one of the most extensively used criteria for heart transplantation. 4 Nevertheless, peak VO2 cannot be precisely measured in some cases because of an insufficient exercise load. Hence, it is clinically beneficial to identify another parameter that can estimate peak VO2 in patients with advanced HF, even those with exercise intolerance.
Recently, a study demonstrated a considerable impact of right ventricular (RV) dysfunction on urgent heart transplantation and mortality. 5 Motoki et al. demonstrated that RV echocardiographic parameters, such as RV systolic (s′) velocity and RV strain, were lower in patients with cardiac events, including all‐cause mortality, cardiac transplantation, and HF hospitalization. 6 Guazzi et al. also reported that the ratio of tricuspid annular plane systolic excursion (TAPSE) to pulmonary artery systolic pressure (PASP) was a potent surrogate of RV contractility and RV‐to‐pulmonary circulation (PC) coupling. 7
As an alternative to CPX, exercise stress echocardiography (ESE) can be used to determine the exercise capacity by assessing the cardiac function. 8 However, reaching the maximum exercise load is challenging for patients with refractory HF because of their exercise intolerance. Thus, this study hypothesizes that low‐load ESE could be used to estimate the exercise capacity in patients with HF. To the best of our knowledge, the potential of low‐load ESE to estimate peak VO2 remains unclear to date.
Hence, this study aims to examine the impact of RV contractile reserve, measured by low‐load ESE, on exercise intolerance, which is defined as peak VO2 < 14 mL/kg/min, in patients with HF.
Methods
Study design
This prospective, single‐centre, cross‐sectional study was conducted at Ehime University Hospital (Toon, Japan). All procedures listed in this study were performed in compliance with the Declaration of Helsinki and the Good Clinical Practice guidelines. This study protocol was approved by the Ethics Committee of Ehime University Hospital. Furthermore, all patients provided written informed consent before any study procedures were initiated.
Study population
We enrolled 76 consecutive hospitalized patients with HF who underwent ESE and CPX from May 2018 to January 2020 at Ehime University Hospital. The HF diagnosis was based on the criteria of the European Society of Cardiology guidelines. 9 The types of HF hospitalization were new‐onset HF (n = 25) and acute exacerbation of chronic HF (n = 51). After stabilizing the HF condition, we performed ESE and CPX, within 48 h of each other. The exclusion criteria were as follows: (i) acute myocardial infarction; (ii) congenital heart disease; (iii) history of tricuspid valve surgery; and (iv) pulmonary arterial hypertension.
Cardiopulmonary exercise testing
All patients underwent incremental symptom‐limited exercise testing using an upright cycle ergometer (Strength Ergo 8; Mitsubishi Electric Engineering Co. Ltd., Tokyo, Japan). In addition, CPX was performed using a ramp protocol, including a 2 min recovery after peak effort. 2 All patients started with 2 min rest and 3 min warm‐up at 10 W, followed by a 10 W ramp. Then, we evaluated breath‐by‐breath VO2, carbon dioxide production, and minute ventilation using the gas analysis system (Cpex‐1; Inter‐Reha Co. Ltd., Tokyo, Japan). Of note, peak VO2 was defined as the highest VO2 observed during CPX.
Exercise stress echocardiography
An experienced echocardiographer performed two‐dimensional echocardiography using the Vivid E9 ultrasound system (GE Healthcare, Milwaukee, WI). Standard two‐dimensional greyscale still and moving images were recorded while three cardiac cycles in sinus rhythm and five cardiac cycles in atrial fibrillation, respectively. All echocardiographic data were transmitted on EchoPAC software (EchoPAC ver. BT13; GE Healthcare) for subsequent offline analyses. In addition, ESE was performed using an ergometer in the semi‐supine and left lateral decubitus position (Ergoline 1200 EL; Inter‐Reha Co. Ltd.). The workload was usually started at 25 W and increased by 25 W every 3 min, and echocardiographic images were recorded at rest and at each exercise stage. 10 Of note, we defined a 25 W load exercise for 3 min as low‐load exercise.
We acquired conventional echocardiographic parameters based on the American Society of Echocardiography guidelines. 11 We evaluated the left ventricular (LV) ejection fraction and left atrial (LA) volume using the biplane disk summation method. The LA volume was indexed to the body surface area. The LV mass index was evaluated according to the area–length method. We obtained early diastolic transmitral flow velocity (E‐wave) in the apical long‐axis view using pulsed‐wave Doppler and placed the sample volume at the level of the mitral valve tips. Then, early diastolic mitral annular motion (e′) was assessed at the septal mitral annular sites in the apical four‐chamber view, and E/e′ was calculated. We evaluated stroke volume by multiplying the cross‐sectional area of the LV outflow tract by the velocity–time integral in the LV outflow tract measured using pulsed‐wave Doppler. Next, PASP was evaluated by the sum of the peak tricuspid pressure gradient and right atrial pressure estimated from the inferior vena cava diameter and collapsibility. We assessed the RV area and RV fractional area change by manually tracing the RV endocardial border. In addition, TAPSE was measured by M‐mode echocardiography from the RV focused apical four‐chamber view. Furthermore, RV s′ velocity was evaluated as the peak systolic velocity at the tricuspid annulus by pulsed‐wave tissue Doppler from the RV focused apical four‐chamber view.
Standard two‐dimensional greyscale images were recorded in the apical four‐chamber, two‐chamber, and long‐axis views as well as the RV focused apical four‐chamber view. Using speckle tracking echocardiography, we measured LV global longitudinal strain (GLS), RV strain, and LA reservoir strain with high frame rates (>60 frames/s); these strain values were analysed using EchoPAC software (EchoPAC ver. BT13; GE Healthcare, Milwaukee, WI). 12 Then, GLS was evaluated by the average peak strain from three apical views. RV strain was evaluated as the average peak strain in the RV free wall, and LA reservoir strain was evaluated as the global positive peak LA longitudinal strain in the apical four‐chamber view. On the basis of the recent recommendation of atrial deformation imaging, ventricular end‐diastole was set as the zero baseline for the atrial strain curve. 13 All references to changes in GLS and RV strain indicated an increase or decrease in the absolute value of strain. When deemed necessary to correct the automatically tracked region of interest by the software, each strain analysis was manually corrected.
In this study, we defined increments in RV s′ velocity, TAPSE, and RV strain during low‐load exercise as a marker of RV contractile reserve. In addition, RV‐to‐PC coupling was assessed by the slopes of the relationship between RV s′ velocity or TAPSE and PASP at rest and low‐load exercise. Furthermore, TAPSE/PASP was applied as a non‐invasive surrogate of RV‐to‐PC coupling. 14
Right heart catheterization
Using the Swan–Ganz catheter, we performed right heart catheterization as adjudged by each physician to assess the haemodynamic condition. We evaluated RV dP/dt/P max, which was RV dP/dt divided by the instantaneously developed isovolumetric pressure, as an index of RV contractility. 15 , 16 Of note, the invasive data were only analysed for patients in whom the duration between ESE and right heart catheterization was within 1 week; on the date of the invasive study, these patients were treated with oral medical treatment without intravenous inotropes.
Statistical analyses
If normal distribution was indicated by the Kolmogorov–Smirnov test, continuous variables were expressed as mean ± standard deviation (SD); else, median values (25th and 75th percentiles) were used. Conversely, categorical variables were presented as numbers with percentages. Patients were categorized into the low‐peak VO2 group (peak VO2 < 14 mL/kg/min) and the preserved‐peak VO2 group (peak VO2 ≥ 14 mL/kg/min). Both groups were compared using the Student t‐test or the Mann–Whitney U‐test, as deemed suitable. We used univariate linear regression analysis with Pearson's correlation or Spearman's correlation coefficient. In addition, the intra‐observer and inter‐observer reproducibilities were evaluated using the intraclass correlation coefficient, and they were assessed in 15 randomly selected patients at a different time point (>1 month). Two experienced observers repeatedly assessed the parameters of RV contractile reserve. We defined statistical significance as P < 0.05. All statistical analyses were performed using the Social Science software version 20.0 (SPSS Inc., Chicago, IL) and EZR (Saitama Medical Center, Jichi Medical University, Saitama, Japan). 17
Results
Patients' characteristics
Table 1 presents the baseline characteristics of the study population. After the exclusion of patients (acute myocardial infarction, n = 2; congenital heart disease, n = 5; history of tricuspid valve surgery, n = 1; pulmonary arterial hypertension, n = 1), we analysed 67 patients with HF.
Table 1.
Baseline characteristics of the study population
| Variables | All patients (n = 67) | Low‐peak VO2 group (n = 26) | Preserved‐peak VO2 group (n = 41) | P |
|---|---|---|---|---|
| Age, years | 65 ± 12 | 71 ± 10 | 62 ± 13 | 0.004 |
| Male | 50 (74.6) | 19 (73.1) | 31 (75.6) | 1.000 |
| Body surface area, m2 | 1.69 ± 0.20 | 1.67 ± 0.19 | 1.70 ± 0.21 | 0.492 |
| NYHA functional class | 0.001 | |||
| NYHA I | 3 (4.5) | 0 (0) | 3 (7.3) | |
| NYHA II | 44 (65.7) | 12 (46.2) | 32 (78.0) | |
| NYHA III | 20 (29.9) | 14 (53.8) | 6 (14.6) | |
| Aetiology of heart failure | ||||
| Ischaemic heart disease | 13 (19.4) | 8 (30.8) | 5 (12.2) | 0.110 |
| Non‐ischaemic heart disease | 54 (80.6) | 18 (69.2) | 36 (87.8) | 0.110 |
| Hypertension | 28 (41.8) | 14 (53.8) | 14 (34.1) | 0.133 |
| Diabetes mellitus | 19 (28.4) | 10 (38.5) | 9 (22.0) | 0.172 |
| Dyslipidaemia | 32 (47.8) | 14 (53.8) | 18 (43.9) | 0.462 |
| Chronic kidney disease | 38 (56.7) | 20 (76.9) | 18 (43.9) | 0.011 |
| Atrial fibrillation | 17 (25.4) | 10 (38.5) | 7 (17.1) | 0.082 |
| Laboratory data | ||||
| Brain natriuretic peptide, pg/mL | 207 (80–361) | 338 (226–546) | 96 (67–233) | <0.001 |
| Haemoglobin, g/dL | 13.3 ± 2.1 | 12.5 ± 1.9 | 13.9 ± 2.1 | 0.011 |
| Albumin, g/dL | 3.9 ± 0.5 | 3.7 ± 0.5 | 4.0 ± 0.5 | 0.011 |
| Creatinine, mg/dL | 1.03 (0.83–1.33) | 1.24 (0.96–1.70) | 0.91 (0.80–1.22) | 0.004 |
| eGFR, mL/min/1.73 m2 | 51.7 ± 17.9 | 42.8 ± 15.3 | 57.3 ± 17.4 | 0.001 |
| Therapy | ||||
| ACE‐I or ARB | 58 (86.6) | 25 (96.2) | 33 (80.5) | 0.138 |
| Beta‐blocker | 59 (88.1) | 25 (96.2) | 34 (82.9) | 0.138 |
| Loop diuretic | 51 (76.1) | 22 (84.6) | 29 (70.7) | 0.247 |
| Aldosterone blocker | 44 (65.7) | 18 (69.2) | 26 (63.4) | 0.793 |
| Inotropic support | 21 (31.3) | 11 (42.3) | 10 (24.4) | 0.177 |
| Device (PM, ICD, CRT) | 19 (28.4) | 12 (46.2) | 7 (17.1) | 0.014 |
| Open heart surgery | 11 (16.4) | 4 (15.4) | 7 (17.1) | 1.000 |
ACE‐I, angiotensin‐converting enzyme inhibitor; ARB, angiotensin receptor blocker; CRT, cardiac resynchronization therapy; eGFR, estimatedglomerular filtration rate; ICD, implantable cardioverter defibrillator; NYHA, New York Heart Association; PM, pacemaker.
Data are expressed as mean ± SD, median (25th and 75th percentiles), or number (%).
Cardiopulmonary exercise test and exercise stress echocardiographic parameters
Table 2 and Appendix S1 present the results of the CPX and ESE parameters. The median load of achieved exercise was 50 W (interquartile range: 25–75 W), and all patients completed low‐load ESE without any adverse events. Among the echocardiographic parameters at rest, TAPSE and RV strain were lower in the low‐peak VO2 group than in the preserved‐peak VO2 group. Among the echocardiographic parameters at low‐load exercise, TAPSE, RV s′ velocity, RV strain, and TAPSE/PASP were lower in the low‐peak VO2 group than in the preserved‐peak VO2 group.
Table 2.
Characteristics during cardiopulmonary exercise testing and exercise stress echocardiography
| Variables | All patients (n = 67) | Low‐peak VO2 group (n = 26) | Preserved‐peak VO2 group (n = 41) | P |
|---|---|---|---|---|
| Cardiopulmonary exercise test | ||||
| Peak workload, W | 71.8 ± 25.4 | 55.4 ± 21.5 | 82.4 ± 22.1 | <0.001 |
| Exercise duration, min | 8.8 ± 3.7 | 7.1 ± 3.3 | 9.6 ± 3.6 | 0.059 |
| Peak VO2, mL/kg/min | 15.1 ± 5.2 | 9.9 ± 2.4 | 18.4 ± 3.4 | <0.001 |
| Peak VO2, % predicted | 63.3 ± 19.6 | 45.3 ± 11.6 | 74.8 ± 14.4 | <0.001 |
| VE/VCO2 slope | 28.7 (26.0–34.0) | 36.7 (32.1–39.6) | 27.6 (24.6–30.2) | <0.001 |
| Minimum VE/VCO2 | 33.3 ± 8.0 | 39.3 ± 8.6 | 29.7 ± 4.9 | <0.001 |
| RER | 1.10 ± 0.11 | 1.09 ± 0.13 | 1.10 ± 0.10 | 0.554 |
| O2 pulse max, mL/beat | 86.8 ± 40.2 | 67.0 ± 17.5 | 99.2 ± 45.4 | 0.004 |
| ETCO2, % | 5.0 ± 0.7 | 4.6 ± 0.6 | 5.3 ± 0.7 | <0.001 |
| Echocardiography at rest | ||||
| LVEF, % | 35.9 ± 17.7 | 32.9 ± 13.1 | 37.8 ± 19.4 | 0.269 |
| LVEF < 40% | 44 (65.7) | 19 (73.1) | 25 (61.0) | 0.429 |
| LVEF ≥ 50% | 13 (19.4) | 3 (11.5) | 10 (24.4) | 0.225 |
| Stroke volume, mL/beat | 49.6 ± 18.5 | 45.0 ± 19.5 | 52.4 ± 17.5 | 0.112 |
| LVGLS, % | −8.4 ± 4.6 | −6.9 ± 4.5 | −9.4 ± 4.5 | 0.036 |
| E/e′ ratio | 15.2 (10.7–21.4) | 18.4 (15.5–25.8) | 13.3 (11.1–18.7) | 0.001 |
| PASP, mmHg | 26.0 ± 14.9 | 33.4 ± 18.5 | 21.3 ± 9.9 | 0.001 |
| RV FAC, % | 39.4 ± 11.8 | 35.1 ± 10.8 | 42.1 ± 11.7 | 0.016 |
| TAPSE, mm | 15.9 ± 3.8 | 14.7 ± 3.5 | 16.7 ± 3.9 | 0.032 |
| RV s′ velocity, cm/s | 8.6 ± 2.4 | 8.2 ± 2.3 | 8.8 ± 2.4 | 0.333 |
| RV strain, % | −15.8 ± 5.6 | −13.6 ± 5.0 | −17.1 ± 5.5 | 0.009 |
| TAPSE/PASP, mm/mmHg | 0.72 (0.43–1.02) | 0.42 (0.33–0.82) | 0.81 (0.62–1.06) | 0.002 |
| RV s′ velocity/PASP, cm/s/mmHg | 0.36 (0.27–0.54) | 0.28 (0.17–0.38) | 0.42 (0.33–0.66) | 0.008 |
| Echocardiography at low‐load | ||||
| LVEF, % | 39.2 ± 17.6 | 34.5 ± 14.3 | 42.1 ± 18.9 | 0.084 |
| Stroke volume, mL/beat | 55.4 ± 19.7 | 45.2 ± 18.9 | 61.8 ± 17.6 | 0.001 |
| LVGLS, % | −9.9 ± 4.9 | −8.3 ± 4.7 | −11.0 ± 4.7 | 0.025 |
| E/e′ ratio | 16.0 (12.6–22.1) | 19.1 (15.5–25.1) | 13.5 (10.2–18.0) | 0.001 |
| PASP, mmHg | 38.9 ± 17.5 | 47.5 ± 20.2 | 33.3 ± 12.9 | 0.001 |
| RV FAC, % | 39.0 ± 12.5 | 31.0 ± 11.8 | 44.1 ± 10.2 | <0.001 |
| TAPSE, mm | 17.5 ± 4.7 | 14.3 ± 3.9 | 19.6 ± 3.9 | <0.001 |
| RV s′ velocity, cm/s | 10.1 ± 3.0 | 8.1 ± 2.2 | 11.4 ± 2.7 | <0.001 |
| RV strain, % | −17.6 ± 6.1 | −13.9 ± 4.8 | −20.0 ± 5.6 | <0.001 |
| TAPSE/PASP, mm/mmHg | 0.46 (0.33–0.71) | 0.27 (0.22–0.45) | 0.60 (0.44–0.81) | <0.001 |
| RV s′ velocity/PASP, cm/s/mmHg | 0.29 (0.18–0.40) | 0.17 (0.13–0.27) | 0.32 (0.27–0.54) | <0.001 |
| Peak workload, W | 50 (25.0–75.0) | 25.0 (25.0–50.0) | 50.0 (50.0–75.0) | <0.001 |
E/e′ ratio, early diastolic transmitral flow velocity and early diastolic mitral annular motion ratio; ETCO2, end‐tidal carbon dioxide; LVEF, left ventricular ejection fraction; LVGLS, left ventricular global longitudinal strain; O2 pulse, oxygen consumption per cardiac cycle; PASP, pulmonary artery systolic pressure; RER, respiratory exchange ratio; RV FAC, right ventricular fractional area change; RV strain, right ventricular strain; RV s′ velocity, right ventricular systolic velocity; RV s′ velocity/PASP, right ventricular systolic velocity and pulmonary artery systolic pressure ratio; TAPSE, tricuspid annular plane systolic excursion; TAPSE/PASP, tricuspid annular plane systolic excursion and pulmonary artery systolic pressure ratio; VE/VCO2, ventilatory equivalent for carbon dioxide; VO2, oxygen uptake.
Data are expressed as mean ± SD, median (25th and 75th percentiles), or number (%).
Echocardiographic correlates of exercise capacity
Table 3 shows the correlations between echocardiographic parameters and peak VO2. The change in RV s′ velocity during low‐load exercise markedly correlated with peak VO2 (Figure 1A), although the change in RV strain during low‐load exercise exhibited a weak correlation with peak VO2 (Figure 1B). Appendix S2 presents the correlations between the change in RV s′ velocity during low‐load and other CPX parameters.
Table 3.
Correlations between peak VO2 and exercise stress echocardiographic parameters
| Variables | Rest (r value) | P | Low load (r value) | P |
|---|---|---|---|---|
| LVEF, % | 0.053 | 0.668 | 0.193 | 0.118 |
| LVEDV, mL | 0.087 | 0.486 | 0.064 | 0.607 |
| LVESV, mL | 0.075 | 0.547 | −0.009 | 0.943 |
| Stroke volume, mL/beat | 0.025 | 0.843 | 0.304 | 0.012 |
| LVGLS, % | −0.190 | 0.124 | −0.207 | 0.093 |
| LA volume index, mL/m2 | −0.334 | 0.006 | −0.318 | 0.009 |
| LA reservoir strain, % | 0.264 | 0.031 | 0.399 | <0.001 |
| E/e′ ratio | −0.387 | 0.001 | −0.384 | 0.001 |
| PASP, mmHg | −0.495 | <0.001 | −0.512 | <0.001 |
| TAPSE, mm | 0.305 | 0.012 | 0.653 | <0.001 |
| RV s′ velocity, cm/s | 0.088 | 0.478 | 0.553 | <0.001 |
| RV strain, % | −0.343 | 0.005 | −0.501 | <0.001 |
| TAPSE/PASP, mm/mmHg | 0.503 | <0.001 | 0.634 | <0.001 |
| RV s′ velocity/PASP, cm/s/mmHg | 0.445 | <0.001 | 0.608 | <0.001 |
E/e′ ratio, early diastolic transmitral flow velocity and early diastolic mitral annular motion ratio; LA, left atrial; LVEDV, left ventricular end‐diastolic volume; LVEF, left ventricular ejection fraction; LVESV, left ventricular end‐systolic volume; LVGLS, left ventricular global longitudinal strain; PASP, pulmonary artery systolic pressure; RV strain, right ventricular strain; RV s′ velocity, right ventricular systolic velocity; RV s′ velocity/PASP, right ventricular systolic velocity and pulmonary artery systolic pressure ratio; TAPSE, tricuspid annular plane systolic excursion; TAPSE/PASP, tricuspid annular plane systolic excursion and pulmonary artery systolic pressure ratio.
Figure 1.

Correlation between peak VO2 and RV function during low‐load exercise. (A) Correlation between the change in RV s′ velocity and peak VO2 during low‐load exercise (r = 0.787; P < 0.001). (B) Correlation between the change in RV strain and peak VO2 during low‐load exercise (r = 0.244; P < 0.001). RV s′ velocity, right ventricular systolic velocity; RV strain, right ventricular strain; VO2, oxygen uptake.
Figure 2 shows two representative cases of low‐peak and preserved‐peak VO2. Table 4 shows that the reproducibility for the change in RV s′ velocity during low‐load exercise was superior to that of TAPSE and RV strain.
Figure 2.

Representative cases of a patient in the low‐peak VO2 group and a patient in the preserved‐peak VO2 group. (A) Representative case in a low‐peak VO2 group (peak VO2, 12.9 mL/kg/min). (B) Representative case in a preserved‐peak VO2 group (peak VO2, 21.0 mL/kg/min). RV s′ velocity did not increase in a patient with low‐peak VO2 compared with a patient with preserved‐peak VO2. PASP was higher in a patient with low‐peak VO2 than a patient with preserved‐peak VO2. PASP, pulmonary artery systolic pressure; RV s′ velocity, right ventricular systolic velocity; VO2, oxygen uptake.
Table 4.
Reproducibility for the change in right ventricular function during low‐load exercise
| Variables | ICC | 95% CI | P |
|---|---|---|---|
| Intra‐observer | |||
| Change in RV s′ velocity, cm/s | 0.96 | 0.88–0.99 | <0.001 |
| Change in TAPSE, mm | 0.59 | 0.14–0.84 | 0.007 |
| Change in RV strain, % | 0.70 | 0.32–0.84 | 0.001 |
| Inter‐observer | |||
| Change in RV s′ velocity, cm/s | 0.86 | 0.64–0.95 | <0.001 |
| Change in TAPSE, mm | 0.41 | 0.11–0.75 | 0.057 |
| Change in RV strain, % | 0.63 | 0.19–0.86 | 0.005 |
CI, confidence interval; ICC, intraclass correlation coefficient; RV strain, right ventricular strain; RV s′ velocity, right ventricular systolic velocity; TAPSE, tricuspid annular plane systolic excursion.
Receiver‐operating characteristic curve analyses showed that the change in RV s′ velocity during low‐load exercise had more predictive value for low‐peak VO2 than that of RV strain (Figure 3). In addition, the cut‐off value of 0.68 cm/s for the change in RV s′ velocity during low‐load exercise exhibited good sensitivity (92.3%), specificity (85.4%), and accuracy (89.6%) to identify patients with low‐peak VO2. Logistic regression analysis showed that the change in RV s′ velocity during low‐load exercise was an independent predictor of low‐peak VO2 (Table 5). Figure 4 illustrates the slope between the relationship of RV s′ velocity or TAPSE and PASP at rest and low‐load exercise. Notably, the slopes were steeper in the low‐peak VO2 group than in the preserved‐peak VO2 group, suggesting higher RV‐to‐PC uncoupling in the low‐peak VO2 group. Appendix S3 shows the relationship between RV s′ velocity and cardiac output at rest and low‐load exercise. In the low‐peak VO2 group, the increase of cardiac output was limited with the blunted increase of RV s′ velocity during low‐load exercise.
Figure 3.
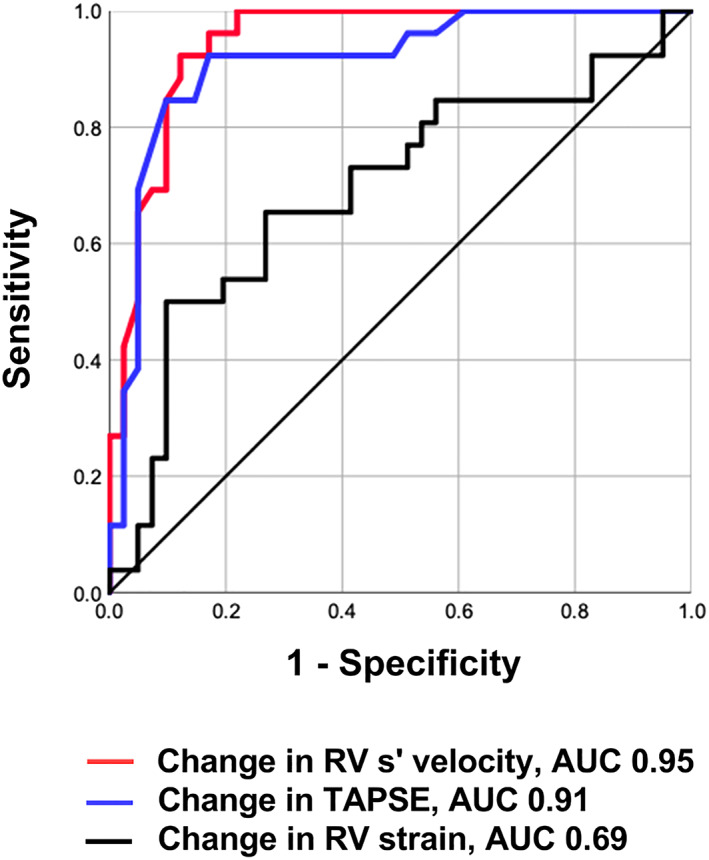
Receiver‐operating characteristic curve analysis of echocardiographic parameters during low‐load exercise to predict low‐peak VO2. The change in RV s′ velocity during low‐load exercise had higher AUC (0.95; P < 0.001) than the change in RV strain. AUC, area under the curve; RV s′ velocity, right ventricular systolic velocity; RV strain, right ventricular strain; TAPSE, tricuspid annular plane systolic excursion; VO2, oxygen uptake.
Table 5.
Logistic regression analysis for association with low‐peak VO2
| Variables | Univariable odds ratio (95% CI) | P | Multivariable odds ratio (95% CI) | P |
|---|---|---|---|---|
| Age, year | 1.07 (1.02–1.12) | 0.007 | 1.11 (1.00–1.23) | 0.054 |
| Atrial fibrillation | 3.04 (0.98–9.40) | 0.055 | ||
| Change in LVEF, % | 0.95 (0.88–1.02) | 0.136 | ||
| E/e′ ratio at low load, per 1 | 1.06 (1.01–1.11) | 0.025 | 0.95 (0.86–1.04) | 0.268 |
| LA volume index at low load, mL/m2 | 1.02 (1.00–1.04) | 0.108 | ||
| LA reservoir strain at low load, % | 0.89 (0.83–0.97) | 0.006 | 0.91 (0.81–1.02) | 0.116 |
| Mitral regurgitation grade at low load (≥moderate) | 3.81 (1.11–13.10) | 0.034 | 0.67 (0.51–8.67) | 0.757 |
| Change in RV s′ velocity, cm/s | 0.10 (0.03–0.33) | <0.001 | 0.08 (0.01–0.45) | 0.004 |
| Change in RV strain, % | 0.88 (0.77–0.99) | 0.040 | 0.94 (0.71–1.25) | 0.678 |
| TAPSE/PASP at low load, mm/mmHg | 0.01 (0.00–0.15) | 0.002 | 2.42 (0.38–152.00) | 0.677 |
E/e′ ratio, early diastolic transmitral flow velocity and early diastolic mitral annular motion ratio; LA, left atrial; LVEF, left ventricular ejection fraction; RV strain, right ventricular strain; RV s′ velocity, right ventricular systolic velocity; TAPSE/PASP, tricuspid annular plane systolic excursion and pulmonary artery systolic pressure ratio; VO2, oxygen uptake.
Figure 4.

Relationship between right ventricular systolic function and pulmonary artery systolic pressure during low‐load exercise. (A) Relationship between RV s′ velocity and PASP at rest and low‐load exercise. (B) Relationship between TAPSE and PASP at rest and low‐load exercise. Red symbols, low‐peak VO2 group; blue symbols, preserved‐peak VO2 group. The slopes in the low‐peak VO2 group were steeper than that in the preserved‐peak VO2 group. PASP, pulmonary artery systolic pressure; RV s′ velocity, right ventricular systolic velocity; TAPSE, tricuspid annular plane systolic excursion; VO2, oxygen uptake.
Correlation between change in right ventricular s′ velocity and right ventricular dP/dt/P max
We analysed invasive parameters in 26 patients during right heart catheterization. The change in RV s′ velocity during low‐load exercise markedly correlated with RV dP/dt/P max (Figure 5). TAPSE/PASP at low‐load exercise also had a significant correlation to RV dP/dt/P max (r = 0.588, P < 0.001).
Figure 5.
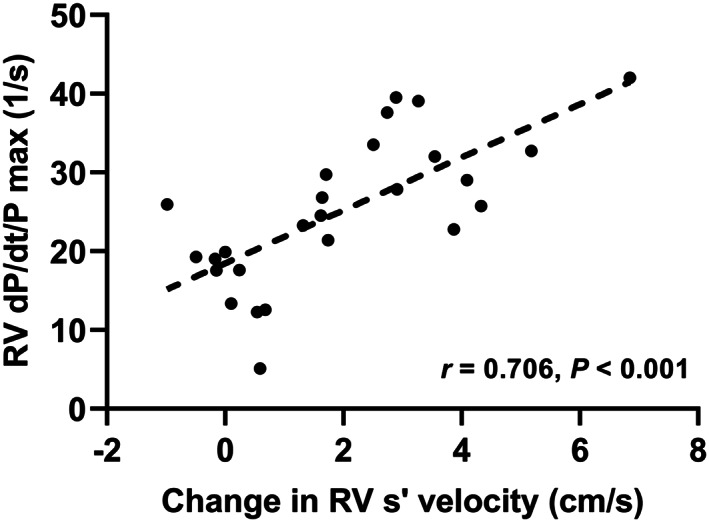
Correlation between RV dP/dt/P max and change in RV s′ velocity during low‐load exercise. The change in RV s′ velocity during low‐load exercise significantly correlated with RV dP/dt/P max (r = 0.706; P < 0.001). RV s′ velocity, right ventricular systolic velocity; RV, right ventricular.
Discussion
The major findings of this study are as follows: (i) low‐load ESE was safely completed in all participants with HF; (ii) the blunted increase in RV s′ velocity during low‐load exercise correlated with low‐peak VO2 and RV‐to‐PC uncoupling was observed in the low‐peak VO2 group; (iii) the diagnostic accuracy of increments in RV s′ velocity and TAPSE during low‐load exercise to predict low‐peak VO2 was superior to that of RV strain; and (iv) the reproducibility of the change in RV s′ velocity was better than that of TAPSE and RV strain.
Assessing the RV function is challenging because of complex RV geometry; however, the RV longitudinal function can be assessed using RV s′ velocity and TAPSE, although it is assumed that the velocity and displacement of the basal segment in the RV focused apical four‐chamber view reflect the function of the entire RV. 18 A recent study reported the utility of RV strain, which could provide a more global function of the RV. 19 However, it remains challenging to obtain optimal curves of RV strain, especially during exercise, because of requirements in its acquisition with adequate image quality. The guideline related to RV function assessment states that RV s′ velocity and TAPSE should be incorporated into routine clinical use, whereas RV strain remains a research tool in experienced laboratories. 20 In a porcine model, RV s′ velocity detected early impairments in RV systolic function. 21 In addition, an observational study reported that RV s′ velocity and RV strain independently correlated with exercise capacity measured by CPX performed in patients with severe LV systolic dysfunction. 22 Besides, Sharma et al. established a correlation between increased RV s′ velocity and exercise capacity. 23 D'Alto et al. suggested that RV s′ velocity was more sensitive to changes in RV longitudinal function than TAPSE. 24 Our study was consistent to their finding that the rate of change in RV s′ velocity increased at low‐load ESE more than that of TAPSE. In this study, the change in RV s′ velocity during low‐load exercise exhibited more predictive and reproducible values for low‐peak VO2 (<14 mL/kg/min) compared with the changes in TAPSE and RV strain. Furthermore, results of RV s′ velocity were obtained immediately after ESE without requiring any additional software.
As judged by the respiratory exchange ratio (RER) > 1.0, evaluation on CPX should start with an assessment of the maximum volitional effort. 25 In a previous study, 42% of patients with HF could not attain peak RER > 1.0 during CPX. 26 In another study, some patients could not attain 50 W load exercise among patients with peak VO2 < 14 mL/kg/min. 27 This study secured the safety of low‐load ESE because all patients with HF completed the tests without any adverse events.
According to Frank Starling's law, cardiac output gradually increases by enhancing the venous return during exercise. An increase in the cardiac output causes an increment in VO2. In a failing heart, a preload recruitment during exercise could elevate the LV filling pressure, which, in turn, increases the RV afterload. As the RV is highly sensitive to afterload than the LV, a lack of RV contractile reserve directly induces exercise intolerance in the presence of left‐sided heart disease. 28 Of note, ESE enables the investigation of RV function when both preload and afterload are increased during exercise; consequently, there could be a clinical potential to evaluate RV contractile reserve during low‐load exercise in patients with reduced exercise capacity. In invasive studies, RV dP/dt is extensively used as one of the haemodynamic indices of RV contractility; however, it has a limitation of preload dependence. Conversely, RV dP/dt/P max is regarded as less independent on both preload and afterload. 15 Kanzaki et al. reported using Doppler echocardiography that there was a significant correlation between RV dP/dt/P max and peak VO2. 16 In this study, the change in RV s′ velocity during low‐load ESE significantly correlated with the invasively measured RV dP/dt/P max, suggesting that the change in RV s′ velocity could be a non‐invasive marker of RV contractility.
Left‐sided HF causes pulmonary hypertension by elevated pulmonary venous pressure besides pulmonary vascular remodelling. The impact of pulmonary hypertension on adverse outcomes in patients with HF is primarily related to the coexistence of RV systolic dysfunction. 29 In our study, higher E/e′, lower LA reservoir strain and higher grade of mitral regurgitation during low‐load exercise were associated with low‐peak VO2. Usually, the RV adapts to increased afterload by enhancing RV contractility; however, the RV dilates to preserve the cardiac output in patients with RV dysfunction and is progressively maladapted to pulmonary hypertension, resulting in a decrease of cardiac output. This study showed that the increment in RV s′ velocity during low‐load exercise was associated with the increase of cardiac output, which is known as a key determinant of peak VO2 as previously reported. 30
Recently, a study reported the concept of RV‐to‐PC coupling as the significance of RV function when considering the afterload in patients with HF. 31 Singh et al. reported that RV‐to‐PC uncoupling impaired the response of stroke volume during exercise and correlated with reduced exercise capacity. 32 The RV‐to‐PC coupling can be assessed by the combined assessments of RV systolic function and PASP. 33 TAPSE/PASP is a clinically relevant and valid surrogate of invasively measured end‐systolic/arterial elastance ratio to assess RV‐to‐PC coupling. As shown in previous studies, TAPSE/PASP < 0.31 mm/mmHg predicted RV‐to‐PC uncoupling, which was associated with poor prognosis in patients with HF. 14 , 33 In this study, TAPSE/PASP was markedly decreased (0.27 mm/mmHg) at low‐load exercise in the low‐peak VO2 group, suggesting RV‐to‐PC uncoupling was provoked during submaximal exercise in patients with exercise intolerance.
Study limitations
This was a single‐centre, cross‐sectional study performed using a relatively small sample size, and the study population included relatively high‐risk patients. We did not assess clinical outcomes. Thus, it is essential to establish that RV contractile reserve assessed by low‐load ESE has a predictive value to identify high‐risk patients with HF. Our protocols in CPX and ESE were different in terms of patient position and loading method. Because Frank Starling's law depends on gravity and venous return, haemodynamic changes may be different in each exercise protocol. Finally, RV s′ velocity is angle dependent and not entirely representative of the RV global function. Despite the limitation, it is clinically crucial that RV s′ velocity is a simple and reproducible measure with good discriminatory ability to determine exercise intolerance in patients with HF.
Conclusions
The change in RV s′ velocity during low‐load ESE correlates with peak VO2 and is a robust predictor to determine exercise intolerance in patients with HF. It could be clinically beneficial to assess RV contractile reserve against afterload increase during exercise to identify high‐risk patients with HF. Nevertheless, further studies are warranted to validate whether RV contractile reserve and RV‐to‐PC coupling during low‐load ESE have a predictive value of prognosis in patients with HF.
Conflict of interest
None declared.
Funding
None
Permission
The authors confirm that all material is original to this submission.
Supporting information
Appendix S1. Characteristics during cardiopulmonary exercise testing and exercise stress echocardiography
Appendix S2. Correlations between the change in RV s′ velocity during low‐load and CPX parameters
Appendix S3. Relationship between RV s′ velocity and cardiac output during low‐load exercise. The increase of cardiac output was limited with the blunted increase of RV s’ velocity during low‐load exercise in the low‐peak VO2 group (Red symbols) compared with the preserved‐peak VO2 group (Blue symbols). RV s′ velocity, right ventricular systolic velocity; VO2, oxygen uptake.
Acknowledgment
The authors would like to thank Enago (www.enago.jp) for the English language review.
Kinoshita, M. , Inoue, K. , Higashi, H. , Akazawa, Y. , Sasaki, Y. , Fujii, A. , Uetani, T. , Inaba, S. , Aono, J. , Nagai, T. , Nishimura, K. , Ikeda, S. , and Yamaguchi, O. (2020) Impact of right ventricular contractile reserve during low‐load exercise on exercise intolerance in heart failure. ESC Heart Failure, 7: 3810–3820. 10.1002/ehf2.12968.
References
- 1. Weber KT, Kinasewitz GT, Janicki JS, Fishman AP. Oxygen utilization and ventilation during exercise in patients with chronic cardiac failure. Circulation 1982; 65: 1213–1223. [DOI] [PubMed] [Google Scholar]
- 2. Adachi H. Cardiopulmonary exercise test. Int Heart J 2017; 58: 654–665. [DOI] [PubMed] [Google Scholar]
- 3. Mancini DM, Eisen H, Kussmaul W, Mull R, Edmonds LH, Wilson JR. Value of peak exercise oxygen consumption for optimal timing of cardiac transplantation in ambulatory patients with heart failure. Circulation 1991; 83: 778–786. [DOI] [PubMed] [Google Scholar]
- 4. Mudge GH, Goldstein S, Addonizio LJ, Caplan A, Mancini D, Levine TB, Ritsch ME, Stevenson LW. Task force 3: recipient guidelines/prioritization. J Am Coll Cardiol 1993; 22: 21–31. [DOI] [PubMed] [Google Scholar]
- 5. Frea S, Pidello S, Bovolo V, Iacovino C, Franco E, Pinneri F, Galluzzo A, Volpe A, Visconti M, Peirone A, Morello M, Bergerone S, Gaita F. Prognostic incremental role of right ventricular function in acute decompensation of advanced chronic heart failure. Eur J Heart Fail 2016; 18: 564–572. [DOI] [PubMed] [Google Scholar]
- 6. Motoki H, Borowski AG, Shrestha K, Hu B, Kusunose K, Troughton RW, Tang WHW, Klein AL. Right ventricular global longitudinal strain provides prognostic value incremental to left ventricular ejection fraction in patients with heart failure. J Am Soc Echocardiogr 2014; 27: 726–732. [DOI] [PubMed] [Google Scholar]
- 7. Guazzi M, Bandera F, Pelissero G, Castelvecchio S, Menicanti L, Ghio S, Temporelli PL, Arena R. Tricuspid annular plane systolic excursion and pulmonary arterial systolic pressure relationship in heart failure: an index of right ventricular contractile function and prognosis. Am J Physiol Heart Circ Physiol 2013; 305: H1373–H1381. [DOI] [PubMed] [Google Scholar]
- 8. Scott JM, Esch BTA, Haykowsky MJ, Warburton DER, Toma M, Jelani A, Taylor D, Paterson I, Poppe D, Liang Y, Thompson R. Cardiovascular responses to incremental and sustained submaximal exercise in heart transplant recipients. Am J Physiol Heart Circ Physiol 2009; 296: H350–H358. [DOI] [PubMed] [Google Scholar]
- 9. Ponikowski P, Voors AA, Anker SD, Bueno H, Cleland JGF, Coats AJS, Falk V, González‐Juanatey JR, Harjola VP, Jankowska EA, Jessup M, Linde C, Nihoyannopoulos P, Parissis JT, Pieske B, Riley JP, Rosano GMC, Ruilope LM, Ruschitzka F, Rutten FH, van der Meer P, ESC Scientific Document Group . 2016 ESC Guidelines for the diagnosis and treatment of acute and chronic heart failure. Eur Heart J 2016; 37: 2129–2200.27206819 [Google Scholar]
- 10. Suzuki K, Hirano Y, Yamada H, Murata M, Daimon M, Takeuchi M, Seo Y, Izumi C, Akaishi M. Practical guidance for the implementation of stress echocardiography. J Echocardiogr 2018; 16: 105–129. [DOI] [PMC free article] [PubMed] [Google Scholar]
- 11. Lang RM, Badano LP, Mor‐Avi V, Afilalo J, Armstrong A, Ernande L, Flachskampf FA, Foster E, Goldstein SA, Kuznetsova T, Lancellotti P, Muraru D, Picard MH, Rietzschel ER, Rudski L, Spencer KT, Tsang W, Voigt J‐U. Recommendations for cardiac chamber quantification by echocardiography in adults: an update from the American Society of Echocardiography and the European Association of Cardiovascular Imaging. J Am Soc Echocardiogr 2015; 28: 1–39. [DOI] [PubMed] [Google Scholar]
- 12. Mor‐Avi V, Lang RM, Badano LP, Belohlavek M, Cardim NM, Derumeaux G, Galderisi M, Marwick T, Nagueh SF, Sengupta PP, Sicari R, Smiseth OA, Smulevitz B, Takeuchi M, Thomas JD, Vannan M, Voigt J‐U, Zamorano JL. Current and evolving echocardiographic techniques for the quantitative evaluation of cardiac mechanics: ASE/EAE consensus statement on methodology and indications endorsed by the Japanese Society of Echocardiography. J Am Soc Echocardiogr 2011; 24: 277–313. [DOI] [PubMed] [Google Scholar]
- 13. Badano LP, Kolias TJ, Muraru D, Abraham TP, Aurigemma G, Edvardsen T, D'Hooge J, Donal E, Fraser AG, Marwick T, Mertens L, Popescu BA, Sengupta PP, Lancellotti P, Thomas JD, Voigt JU. Standardization of left atrial, right ventricular, and right atrial deformation imaging using two‐dimensional speckle tracking echocardiography: a consensus document of the EACVI/ASE/Industry Task Force to standardize deformation imaging. Eur Heart J Cardiovasc Imaging 2018; 19: 591–600. [DOI] [PubMed] [Google Scholar]
- 14. Tello K, Wan J, Dalmer A, Vanderpool R, Ghofrani HA, Naeije R, Roller F, Mohajerani E, Seeger W, Herberg U, Sommer N, Gall H, Richter MJ. Validation of the tricuspid annular plane systolic excursion/systolic pulmonary artery pressure ratio for the assessment of right ventricular–arterial coupling in severe pulmonary hypertension. Circ Cardiovasc Imaging 2019; 12: 1–11. [DOI] [PMC free article] [PubMed] [Google Scholar]
- 15. Kass DA, Maughan WL, Guo ZM, Kono A, Sunagawa K, Sagawa K. Comparative influence of load versus inotropic states on indexes of ventricular contractility: experimental and theoretical analysis based on pressure–volume relationships. Circulation 1987; 76: 1422–1436. [DOI] [PubMed] [Google Scholar]
- 16. Kanzaki H, Nakatani S, Kawada T, Yamagishi M, Sunagawa K, Miyatake K. Right ventricular dP/dt/P (max), not dP/dt (max), noninvasively derived from tricuspid regurgitation velocity is a useful index of right ventricular contractility. J Am Soc Echocardiogr 2002; 15: 136–142. [DOI] [PubMed] [Google Scholar]
- 17. Kanda Y. Investigation of the freely available easy‐to‐use software ‘EZR’ for medical statistics. Bone Marrow Transplant 2013; 48: 452–458. [DOI] [PMC free article] [PubMed] [Google Scholar]
- 18. Meluzin J, Špinarová L, Hude P, Krejčí J, Dušek L, Vítovec J, Panovsky R. Combined right ventricular systolic and diastolic dysfunction represents a strong determinant of poor prognosis in patients with symptomatic heart failure. Int J Cardiol 2005; 105: 164–173. [DOI] [PubMed] [Google Scholar]
- 19. Hamada‐Harimura Y, Seo Y, Ishizu T, Nishi I, Machino‐Ohtsuka T, Yamamoto M, Sugano A, Sato K, Sai S, Obara K, Yoshida I, Aonuma K. Incremental prognostic value of right ventricular strain in patients with acute decompensated heart failure. Circ Cardiovasc Imaging 2018; 11: e007249. [DOI] [PubMed] [Google Scholar]
- 20. Rudski LG, Lai WW, Afilalo J, Hua L, Handschumacher MD, Chandrasekaran K, Solomon SD, Louie EK, Schiller NB. Guidelines for the echocardiographic assessment of the right heart in adults: a report from the American Society of Echocardiography. Endorsed by the European Association of Echocardiography, a registered branch of the European Society of Cardiology, and the Canadian Society of Echocardiography. J Am Soc Echocardiogr 2010; 23: 685–713. [DOI] [PubMed] [Google Scholar]
- 21. Hodzic A, Bobin P, Mika D, Ly M, Lefebvre F, Lechêne P, Le Bret E, Gouadon E, Coblence M, Vandecasteele G, Capderou A, Leroy J, Rucker‐Martin C, Lambert V. Standard and strain measurements by echocardiography detect early overloaded right ventricular dysfunction: validation against hemodynamic and myocyte contractility changes in a large animal model. J Am Soc Echocardiogr 2017; 30: 1138–1147. [DOI] [PubMed] [Google Scholar]
- 22. Zaborska B, Smarz K, Makowska E, Czepiel A, Tkowski MS, Jaxa‐Chamiec T, Budaj A. Echocardiographic predictors of exercise intolerance in patients with heart failure with severely reduced ejection fraction. Medicine 2018; 97: e11523. [DOI] [PMC free article] [PubMed] [Google Scholar]
- 23. Sharma T, Lau EMT, Choudhary P, Torzillo PJ, Munoz PA, Simmons LR, Naeije R, Celermajer DS. Dobutamine stress for evaluation of right ventricular reserve in pulmonary arterial hypertension. Eur Respir J 2015; 45: 700–708. [DOI] [PubMed] [Google Scholar]
- 24. D'Alto M, Pavelescu A, Argiento P, Romeo E, Correra A, Di Marco GM, D'Andrea A, Sarubbi B, Russo MG, Naeije R. Echocardiographic assessment of right ventricular contractile reserve in healthy subjects. Echocardiography 2017; 34: 61–68. [DOI] [PubMed] [Google Scholar]
- 25. Malhotra R, Bakken K, D'Elia E, Lewis GD. Cardiopulmonary exercise testing in heart failure. JACC Hear Fail 2016; 4: 607–616. [DOI] [PubMed] [Google Scholar]
- 26. Ingle L, Witte KK, Cleland GJF, Clark AL. The prognostic value of cardiopulmonary exercise testing with a peak respiratory exchange ratio of <1.0 in patients with chronic heart failure. Int J Cardiol 2008; 127: 88–92. [DOI] [PubMed] [Google Scholar]
- 27. Podolec P, Rubís P, Tomkiewicz‐Pajak L, Kopeć G, Tracz W. Usefulness of the evaluation of left ventricular diastolic function changes during stress echocardiography in predicting exercise capacity in patients with ischemic heart failure. J Am Soc Echocardiogr 2008; 21: 834–840. [DOI] [PubMed] [Google Scholar]
- 28. Konstam MA, Kiernan MS, Bernstein D, Bozkurt B, Jacob M, Kapur NK, Kociol RD, Lewis EF, Mehra MR, Pagani FD, Raval AN, Ward C. Evaluation and management of right‐sided heart failure: a scientific statement from the American Heart Association. Circulation 2018; 137: e758–e622. [DOI] [PubMed] [Google Scholar]
- 29. Ghio S, Gavazzi A, Campana C, Inserra C, Klersy C, Sebastiani R, Arbustini E, Recusani F, Tavazzi L. Independent and additive prognostic value of right ventricular systolic function and pulmonary artery pressure in patients with chronic heart failure. J Am Coll Cardiol 2001; 37: 183–188. [DOI] [PubMed] [Google Scholar]
- 30. Guazzi M, Bandera F, Ozemek C, Systrom D, Arena R. Cardiopulmonary exercise testing: what is its value? J Am Coll Cardiol 2017; 70: 1618–1636. [DOI] [PubMed] [Google Scholar]
- 31. Guazzi M, Borlaug BA. Pulmonary hypertension due to left heart disease. Circulation 2012; 126: 975–990. [DOI] [PubMed] [Google Scholar]
- 32. Singh I, Rahaghi FN, Naeije R, Oliveira RKF, Vanderpool RR, Waxman AB, Systrom DM. Dynamic right ventricular–pulmonary arterial uncoupling during maximum incremental exercise in exercise pulmonary hypertension and pulmonary arterial hypertension. Pulm Circ 2019; 9: 1–10. [DOI] [PMC free article] [PubMed] [Google Scholar]
- 33. Iacoviello M, Monitillo F, Citarelli G, Leone M, Grande D, Antoncecchi V, Rizzo C, Terlizzese P, Romito R, Caldarola P, Ciccone MM. Right ventriculo‐arterial coupling assessed by two‐dimensional strain: a new parameter of right ventricular function independently associated with prognosis in chronic heart failure patients. Int J Cardiol 2017; 241: 318–321. [DOI] [PubMed] [Google Scholar]
Associated Data
This section collects any data citations, data availability statements, or supplementary materials included in this article.
Supplementary Materials
Appendix S1. Characteristics during cardiopulmonary exercise testing and exercise stress echocardiography
Appendix S2. Correlations between the change in RV s′ velocity during low‐load and CPX parameters
Appendix S3. Relationship between RV s′ velocity and cardiac output during low‐load exercise. The increase of cardiac output was limited with the blunted increase of RV s’ velocity during low‐load exercise in the low‐peak VO2 group (Red symbols) compared with the preserved‐peak VO2 group (Blue symbols). RV s′ velocity, right ventricular systolic velocity; VO2, oxygen uptake.