Abstract
Purpose
To implement, validate, and apply a self-gated free-running whole-heart five-dimensional (5D) flow MRI framework to evaluate respiration-driven effects on three-dimensional (3D) hemodynamics in a clinical setting.
Materials and Methods
In this prospective study, a free-running five-dimensional (5D) flow sequence was implemented with 3D radial sampling, self-gating, and a compressed-sensing reconstruction. The 5D flow was evaluated in a pulsatile phantom and adult participants with aortic and/or valvular disease who were enrolled between May and August 2019. Conventional twofold-accelerated four-dimensional (4D) flow of the thoracic aorta with navigator gating was performed as a reference comparison. Continuous parameters were evaluated for parameter normality and were compared between conventional 4D flow and 5D flow using a signed-rank or two-tailed paired t test. Differences between respiratory states were evaluated using a repeated-measure analysis of variance or a nonparametric Friedman test.
Results
A total of 20 adult participants (mean age, 49 years ± 17 [standard deviation]; 18 men and two women) were included. In vitro 5D flow results showed excellent agreement with conventional 4D flow–derived values (peak and net flow, <7% difference over all quantified planes). Whole-heart 5D flow data were collected in all participants in 7.65 minutes ± 0.35 (acceleration rate = 36.0–76.9) versus 9.88 minutes ± 3.17 for conventional aortic 4D flow. In vivo, 5D flow demonstrated moderate agreement with conventional 4D flow but demonstrated overestimation in net flow and peak velocity (up to 26% and 12%, respectively) in the ascending aorta and underestimation (<12%) in the arch and descending aorta. Respiratory-resolved analyses of caval veins showed significantly increased net and peak flow in the inferior vena cava in end inspiration compared with end expiration, and the opposite trend was shown in the superior vena cava.
Conclusion
A free-running 5D flow MRI framework consistently captured cardiac and respiratory motion–resolved 3D hemodynamics in less than 8 minutes.
Supplemental material is available for this article.
© RSNA, 2020
Summary
A free-running fully self-gated five-dimensional flow MRI framework was introduced and validated in vitro and in vivo; results demonstrated that this technique can consistently and reliably capture respiratory-driven effects on cardiovascular flow in less than 8 minutes.
Key Points
■ A fully self-gated free-running five-dimensional (5D) flow MRI framework for acquisition and evaluation of cardiac and respiratory motion–resolved three-dimensional hemodynamics was implemented and validated.
■ Whole-heart 5D flow data were collected in all participants in 7.65 minutes ± 0.35 (acceleration rate = 36.0–76.9) versus 9.88 minutes ± 3.17 for conventional four-dimensional (4D) flow of the thoracic aorta (P < .05).
■ In vitro validations in a pulsatile phantom suggest good agreement (within 7%) between conventional 4D flow and 5D flow, whereas in vivo respiratory-resolved analyses suggested that peak velocities and flows increase in the superior vena cava and decrease in the inferior vena cava at end inspiration compared with end expiration.
Introduction
Three-dimensional (3D) cine phase-contrast MRI, also known as four-dimensional (4D) flow MRI, enables time-resolved quantification and visualization of 3D hemodynamics. However, clinical implementation of 4D flow MRI is still limited by long imaging times associated with multidimensional imaging. In addition, respiratory motion is typically addressed through the use of a navigator, which follows the motion of the diaphragm and discards data acquired outside of end expiration (Resp1). Not only does this approach result in reduced imaging efficiency, but it also prohibits measurement of respiration-resolved flow dynamics. Moreover, respiratory effects on cardiopulmonary circulation may be of clinical interest in patients who have undergone the Fontan procedure, for example (1).
Studies (2–5) have demonstrated the feasibility of an optimized and automated five-dimensional (5D) compressed-sensing whole-heart sparse MRI framework for fully self-gated cardiac and respiratory motion–resolved imaging of the heart. This framework incorporates continuous data acquisition for a set imaging time following a 3D radial spiral phyllotaxis sampling pattern, which allows for flexible temporal binning and high undersampling factors. However, prior work on this technique has focused primarily on functional and anatomic imaging of the heart and coronary vessels (2–5).
Several groups (6–12) have investigated the use of similar techniques (fixed imaging times, self-gating, and compressed sensing) for respiratory-resolved 3D hemodynamics. A combined approach using both cardiac and respiratory self-gating with 3D radial sampling remains to be explored. Here, we propose an expansion of a previously described and validated fully self-gated 5D MRI framework to cardiac and respiratory motion–resolved 3D flow imaging—5D flow MRI (4). This technique incorporates 3D radial imaging and fully integrated cardiac and respiratory self-gating into a highly accelerated, flexible framework with predictable imaging time. This study thus aimed to validate and evaluate the initial feasibility and performance of 5D flow MRI in vitro and in participants in a standard clinical setting.
Materials and Methods
Pulse Sequence
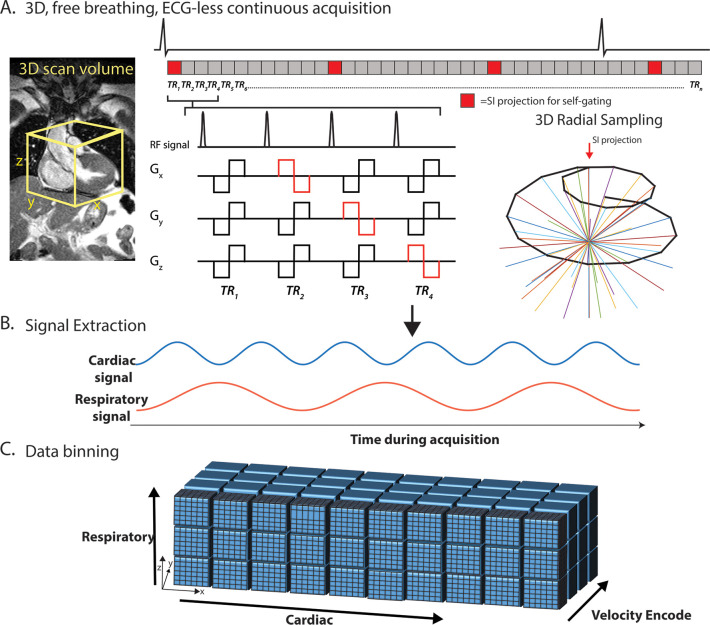
A prototypic 5D flow MRI sequence was implemented using a free-running framework (Fig 1) (2–4). All images were acquired with a 1.5-T MAGNETOM Aera scanner (Siemens Healthcare, Erlangen, Germany). An uninterrupted sequence following a 3D radial spiral phyllotaxis sampling pattern (13) was segmented into multiple interleaves (Fig 1, A). Each interleaf started with a superior-inferior direction acquisition for self-gating, and each subsequent readout was repeated four times for balanced four-point velocity encoding. Interleaves were sequentially rotated by the golden angle (137.51°) throughout the sequence. For this study, each interleaf consisted of six total angles, resulting in 21 total readouts per interleaf (one superior-inferior plus 5 × 4 velocity encodes), to maintain a self-gating sampling rate of approximately 9.5 Hz for reliable sampling of cardiac motion within a normal but robust range of heart rates (14).
Figure 1:
Five-dimensional flow MRI framework. A, Pulse sequence: continuous acquisition with spatial encoding following a three-dimensional (3D) radial, spiral phyllotaxis sampling pattern, interspersed with superior-inferior (SI) projections, which were used to extract, B, cardiac and respiratory self-gating signals. Bipolar flow–encoding gradients were added to spatial-encoding gradients in patterns of four successive repetition times (TR) required for 3D velocity-encoding. The total number of TRs per interleaf has been reduced in this figure for demonstration purposes (see Methods). C, Data are retrospectively binned into cardiac, respiratory, and velocity-encoded dimensions and gridded onto Cartesian coordinates for reconstruction using a compressed-sensing framework with a data-fidelity term and cardiac and respiratory regularization. The electrocardiogram (ECG) is shown for demonstration purposes only. TR representations are lengthened relative to the ECG. Gx, Gy, and Gz represent the magnetic gradients in the x, y, and z directions, respectively. RF = radiofrequency pulse.
Motion Extraction, Data Sorting, and Compressed Reconstruction
Cardiac and respiratory-motion signals were extracted from the superior-inferior profiles using a previously validated principal component analysis approach (Fig 1, B) (4,15,16). A one-dimensional fast-Fourier transform was performed on the superior-inferior k-space lines, which were then concatenated into a (Np × Nc)-by-Ns matrix, where Np is the number of readout samples, Nc is the number of coils, and Ns is the number of total superior-inferior projections. Trajectory-related signal modulations were first filtered out of each superior-inferior projection (17,18). Principal component analysis was performed along the Np × Nc dimensions. The principal component with the highest energy in the 0.5 to 2.0-Hz range was selected as the cardiac component, band-pass filtered, with an automatic algorithm searching for participant-specific physiologic motion frequencies, and transformed back into the time domain for cardiac data sorting. A similar principal component analysis and filtering process was applied to the respiratory component (0.1−0.5 Hz) for binning.
These signals were then used to bin the continuously acquired radial lines into a multidimensional data set (kx-ky-kz-cardiac-respiratory-vxyz; Fig 1, C). A cardiac temporal resolution equal to eight repetition times totaling approximately 40 msec was used for all reconstructions. All in vivo data were binned into four respiratory-motion states, ranging from Resp1 to end inspiration (Resp4) on the basis of the amplitude of the respiratory signal. Bin widths were determined automatically to yield the same number of k-space lines in each respiratory bin.
Highly undersampled 5D flow images were reconstructed using compressed sensing by solving the following optimization equation:
where m is the reconstructed 5D flow data set, F is the nonuniform fast-Fourier transform operator, and s is the acquired radial data. λc, λr, and λσ represent the regularization weights along the cardiac, respiratory, and spatial dimensions, respectively (see Appendix E1 [supplement]).  is the finite difference sparsifying operator.
In Vitro Experiments
The 5D flow workflow was validated using a previously described in vitro MRI-compatible pulsatile flow phantom delivering flow rates of approximately 250 mL/sec and a U-shaped polyvinyl-chloride pipe (schedule 40, 0.75 inches), representing a simplified aorta (19). Gadolinium-enhanced water was used as fluid, with the following 5D imaging parameters: 101 220 radial views; velocity encoding, 150 cm/sec; acquisition matrix, 112 × 112 × 112; spatial resolution, 2.3 mm3; echo time, 2.93 msec; repetition time, 4.7 msec; flip angle, 15°; and reconstruction with one respiratory bin. Data were binned using acquired electrocardiographic timestamps from a trigger signal that was synced to the pulsatile flow and reconstructed using only a nonuniform fast-Fourier transform (to grid and transform the radial data without compressed sensing) to evaluate the validity of the sequence gradients, using the full multidimensional compressed-sensing framework. A conventional Cartesian 4D flow image (retrospective triggering, generalized autocalibrating partially parallel acquisition, acceleration rate = 2) was acquired with matched imaging parameters as a reference standard. All components of this experiment were performed once.
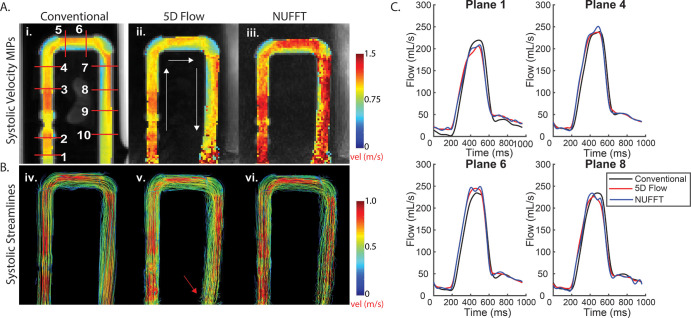
The 4D flow and 5D flow preprocessing included noise-filtering, background phase correction (Fig E1–E3 [supplement]), and correction for velocity aliasing when necessary for all in vivo and in vitro data (20). Fluid flow was visualized using peak velocity maximum-intensity projections and systolic 3D streamlines (EnSight; Computational Engineering International, The Woodlands, Tex). Ten analysis planes were placed throughout the segmentation for calculation of time-resolved peak velocities and peak flow (Fig 2).
Figure 2:
Results from in vitro studies. A, Peak systolic velocity maximum intensity projections (MIPs) show hemodynamics among i, conventional four-dimensional (4D) flow data (1–10, 10 planar locations for flow quantification); ii, five-dimensional (5D) flow–reconstructed data; and iii, nonuniform fast-Fourier transform (NUFFT) data (gridded, no compressed-sensing reconstruction). B, Peak systolic streamlines show similar hemodynamics among iv, conventional 4D flow data; v, 5D flow–reconstructed data; and vi, nonuniform NUFFT data. C, Four representative flow curves show good agreement between 5D and conventional 4D flow data. The MIPs project the maximum velocities onto the imaging plane. Although MIPs are useful for a simple three-dimensional representation of peak velocities, these numbers are likely higher in the NUFFT data without compressed sensing, because this reconstruction is much noisier than the compressed-sensing reconstruction (as compressed sensing aims to remove aliasing artifacts). Because the MIPs are a projection of the absolute velocity, all noise values that increase the absolute velocity value of a voxel are captured as higher velocities.
In Vivo Cohort
This Health Insurance Portability and Accountability Act–compliant study was approved by our local institutional review boards, and all participants provided written informed consent. One participant with bicuspid aortic valve disease was excluded because they were unable to finish the imaging protocol, and thus 20 participants were included in the final analysis (mean age, 49 years ± 17 [standard deviation]; 18 men). Participants were recruited between May and August 2019. A total of 21 adult participants who underwent contrast material–enhanced (0.2 mmol/kg of gadobutrol [Gadavist; Bayer, Leverkusen, Germany] or gadoterate meglumine [Dotarem; Guerbet, Villepinte, France]) cardiothoracic standard-of-care MRI for aortic valve disease (n = 16, where 12 of 16 received clinical calculations of left ventricular stroke volume based on clinical cine imaging) or research MRI (n = 5, recruited on prior MRI indications for cardiovascular or cerebrovascular disease), including conventional navigator-gated 4D flow MRI of the aorta, were prospectively recruited for a same-session whole-heart 5D flow MRI examination (additional details in Appendix E2 and Table E1 [supplement]).
The thoracic aorta of the Resp1 respiratory position of the 5D flow data were segmented and compared with conventional 4D flow data using maximum intensity projections and flow curves. Respiratory-resolved 5D flow hemodynamics were evaluated in the superior vena cava (SVC) and inferior vena cava (IVC), and their inflow into the right atrium was also evaluated (Fig 3) using peak velocities (SVC, IVC; Fig 3, A) and peak and net flows in five planes (planes 1–3 of SVC, planes 1–2 of IVC; Fig 3, D). The 5D and 4D flow net flow values in an ascending aortic plane were additionally compared with clinically derived left ventricular stroke volume.
Figure 3:
A–C, Respiration-resolved evaluation of three-dimensional hemodynamics in a 65-year-old man with thoracic aortic aneurysm and no valve disease (heart rate, 50 beats per minute during imaging). A, Evaluation of caval inflow (superior vena cava [SVC] and inferior vena cava [IVC]) into the right atrium shows some increased peak velocities in the SVC and decreased velocities in the IVC at end expiration. B, C, Color maps reveal an increase in IVC peak flow and a potential temporal flow shift in this participant. D–F, Respiration-resolved evaluation of three-dimensional hemodynamics in a 61-year-old woman with a bicuspid aortic valve (heart rate, 59 beats per minute during the imaging) shows similar hemodynamic patterns. SVC and IVC color maps show differences in potential temporal shifts between respiratory flow curves. This participant also has noticeably less-noisy flow curves than the participant in A–C. See Movies 4–7 (supplement). IVC1 = IVC plane 1, IVC2 = IVC plane 2, Resp 1 = end expiration, Resp 2 = intermediate respiratory position more proximal to Resp 1, Resp 3 = intermediate respiratory position more proximal to Resp 4, Resp 4 = end inspiration, SVC = superior vena cava, SVC1 = SVC plane 1, SVC2 = SVC plane 2, SVC3 = SVC plane 3.
Movie 1:
Animated gifs shows both respiratory and cardiac motion-resolved representative magnitude and phase images of a patient with bicuspid aortic valve disease (shown in Fig 3). Within each of the four image matrices, each column depicts the magnitude and phase images for an axial, coronal, and sagittal view of the heart and great vessels. The top row represents magnitude, first row velocity in the x-direction, followed by velocity in the y and z directions. Resp position 1 corresponds to end expiration, while 4 corresponds to end inspiration.
Movie 2:
Time-resolved pathlines emitted from the segmented caval veins and right atrium and aorta for clinically-indicated conventional 4D flow data of the patient with bicuspid aortic valve disease in Figure 3. 4D flow pathlines depict the complex helical flow in the aorta in diastole and regurgitant flow through the aortic valve.
Movie 3:
Time resolved pathlines emitted from the segmented caval veins and right atrium and aorta for end-expiratory 5D flow data of the patient with bicuspid aortic valve disease in Figure 3. Radial technique is able to capture the complex helical flow in the aorta in diastole and the regurgitant flow through the aortic valve.
Movie 4:
Animated gifs showing both respiratory and cardiac motion-resolved representative magnitude and phase images of a patient with thoracic aortic aneurysm and a heart rate of 50 beats per minute (shown in Fig 4A). Within each of the four image matrices, each column depicts the magnitude and phase images for an axial, coronal, and sagittal view of the heart and great vessels. The top row represents magnitude, first row velocity in the x direction, followed by velocity in the y and z directions. Resp position 1 corresponds to end expiration, while 4 corresponds to end inspiration.
Figure 4:
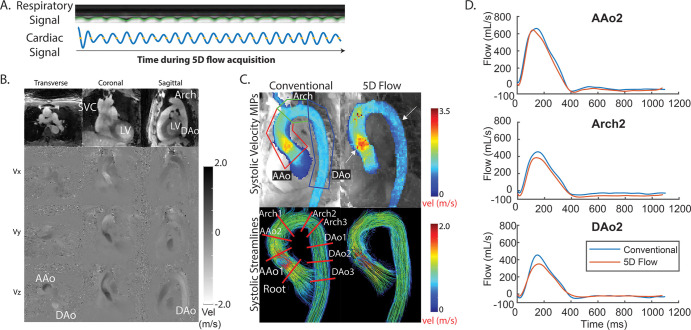
Example from a 41-year-old man with bicuspid aortic valve disease (heart rate, 52 beats per minute during imaging). A, Five-dimensional (5D) flow respiratory and cardiac signals were successfully extracted and used for binning. B, Representative magnitude- and phase-difference images show three views and three velocity (vel) directions (Vx, Vy, and Vz) for a slice and time point. C, Peak systolic maximum intensity projections (MIPs) and streamlines show good agreement between conventional and 5D flow techniques, with some overestimation in the ascending aorta (AAo) and underestimation in the arch and descending aorta (DAo) (white arrows). Peak velocity is quantified in three regions of interest (top left), and flow is evaluated over nine two-dimensional planes placed throughout the entire aorta (bottom left). D, Representative flow curves demonstrate good agreement between techniques. See corresponding Movies 1–3 (supplement). AAo2 = plane 2 of the AAo, Arch2 = plane 2 of the arch, DAo2 = plane 2 of the DAo, LV = left ventricle, SVC = superior vena cava.
Movie 5:
Animated gif shows both respiratory and cardiac motion-resolved representative magnitude and phase images of a patient with bicuspid aortic valve disease and a heart rate of 59 beats per minute (shown in Fig 4B). Within each of the four image matrices, each column depicts the magnitude and phase images for an axial, coronal, and sagittal view of the heart and great vessels. Top row represents magnitude, first-row velocity in the x direction, followed by velocity in the y and z directions. Resp position 1 corresponds to end expiration, while 4 corresponds to end inspiration.
Movie 6:
Video of a bicuspid aortic valve diseasegoes through four respiratory states (heart rate, 53 beats per minute), while depicting peak velocity maximum intensity projection through the respiratory states (resp1 = end expiration, resp4 = end inspiration). Unlike in the main manuscript, the same segmentation is used for all respiratory states (end-expiratory segmentation), to maintain the approximate same number of voxels for the velocity histogram shown in the right panel. The histogram shifts toward lower velocities in end inspiration (Resp4) compared with end expiration (Resp1).
Movie 7:
Video of a patient with a thoracic aortic aneurysm (heartrate = 50 bpm, shown in Fig 4A) goes through four respiratory states, while depicting peak velocity maximum intensity projection through the respiratory states (resp1 = end-expiration, resp4 = end-inspiration). Unlike in the main manuscript, the same segmentation is used for all respiratory states (end-expiratory segmentation), to maintain the approximate same number of voxels for the velocity histogram shown in the right panel. The histogram shifts toward lower velocities in end inspiration (Resp4) compared with end expiration (Resp1).
Statistical Analyses
All continuous variables were evaluated for parameter normality using a Lilliefors test. For conventional 4D flow comparisons, a nonparametric Wilcoxon signed rank or two-tailed paired t test was used to evaluate differences between quantified parameters. Continuous variables were reported as the mean ± standard deviation. Differences between respiratory states were evaluated using a repeated-measures analysis of variance or nonparametric Friedman test. In the case of an F or Q statistic less than .05, individual respiratory timeframes were compared using a two-tailed paired t test or Wilcoxon signed rank test with Bonferroni correction (P < .008).
Results
In Vitro
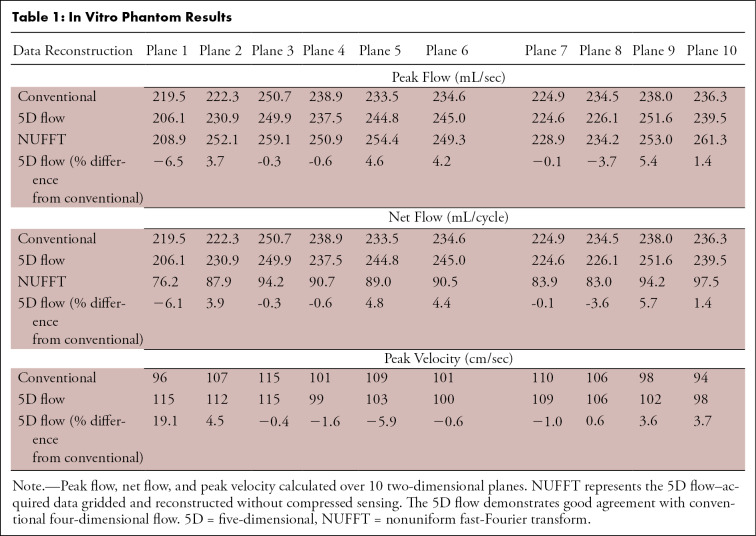
Phantom maximum intensity projections and 3D streamlines (Fig 2) demonstrated good agreement among 5D flow compressed sensing, nonuniform fast-Fourier transform, and conventional 4D flow reconstructions. Although compressed-sensing flow curves and streamlines appeared less noisy than those from the nonuniform fast Fourier transform reconstruction, both reconstructions resulted in hemodynamics similar to those of the conventional 4D flow acquisition. Time-resolved flow curves (Fig 2) demonstrated good-to-excellent quantitative agreement (Table 1), with peak flow, net flow, and peak velocity within 7% of those for conventional 4D at all planes except plane 1, at the edge of the field of view.
Table 1:
In Vitro Phantom Results
Adult Participants
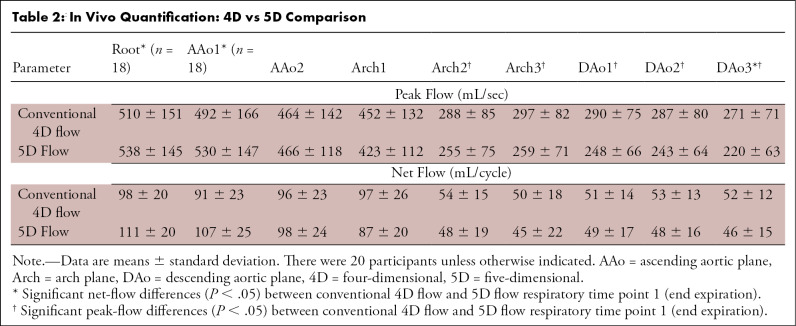
Whole-heart 5D flow MRI times were shorter than those for conventional 4D flow of the aorta (7.65 minutes ± 0.35 vs 9.88 minutes ± 3.17; P < .01). Figure 4 shows a participant with a bicuspid aortic valve, for which the end-expiratory 5D flow data showed reasonable visual agreement of hemodynamics with those of conventional 4D flow. Time-resolved net and peak flow analyses demonstrated moderate agreement (generally <15%; Table 2). The 5D flow peak velocity increased in the ascending aorta and decreased in both the arch and descending aorta compared with 4D flow (5D flow: ascending aortic peak velocity = 247 cm/sec ± 94, arch = 112 cm/sec ± 34, descending aortic peak velocity = 110 cm/sec ± 40; 4D flow: ascending aortic peak velocity = 224 cm/sec ± 90, arch = 121 cm/sec ± 40, descending aortic peak velocity = 119 cm/sec ± 43; P < .05 for all).
Table 2:
In Vivo Quantification: 4D vs 5D Comparison
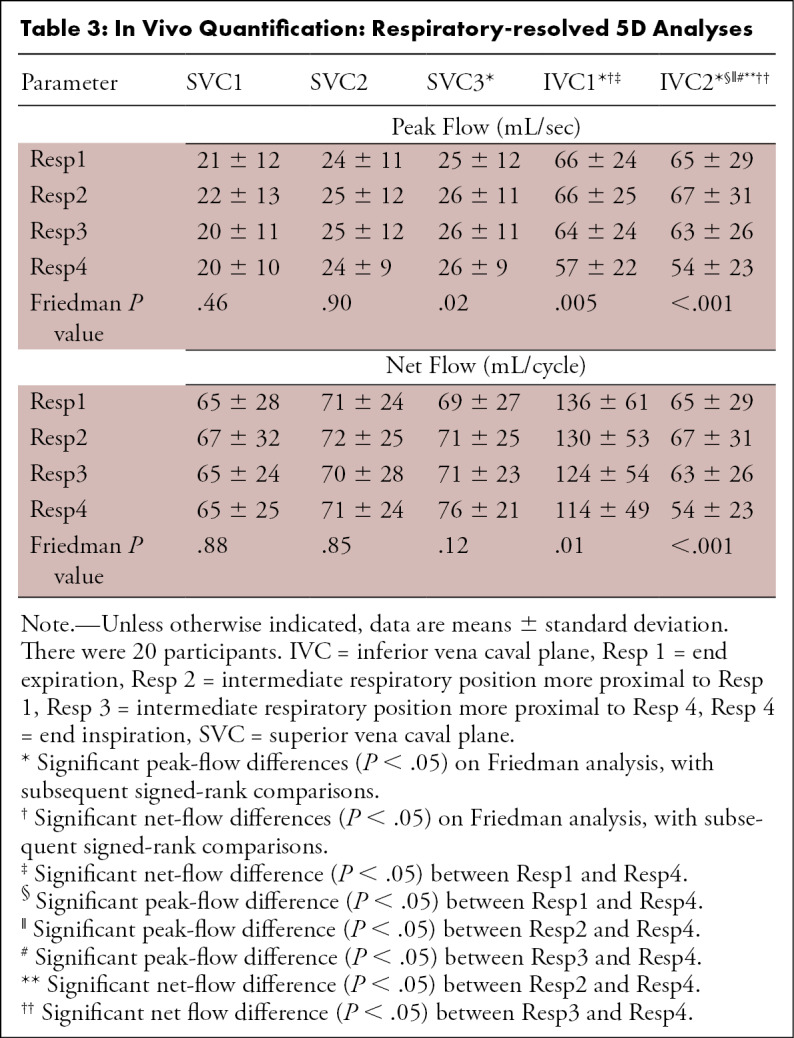
Respiratory-resolved visualization revealed increased caval flow in Resp4 compared with Resp1 in the SVC, with a reversed relationship in the IVC (Fig 3, A). Quantitative analysis demonstrated significantly decreased net and peak flow in Resp4 in planes 1–2 of the IVC compared with Resp1, and the opposite relationship was shown (increased in Resp4) in plane 3 of the SVC (Table 3). SVC peak velocities were increased in Resp4 compared with Resp1 (peak velocity Resp1: 68 cm/sec ± 25, Resp4: 73 cm/sec ± 31; P = .05), with no significant differences in the IVC.
Table 3:
In Vivo Quantification: Respiratory-resolved 5D Analyses
The 4D and 5D flow–derived net flow values were within −3.7% ± 26.8 and 5.2% ± 40.5, respectively, of the clinical cine-derived left ventricular stroke volume (left ventricular stroke volume = 103.5 mL ± 26.2, 4D flow = 92.7 mL ± 20.3, 5D flow = 95.9 mL ± 22.9).
Discussion
We have demonstrated that fully self-gated free-running 5D flow MRI shows good-to-excellent agreement with conventional 4D flow in a pulsatile in vitro phantom and that 5D flow can capture whole-heart respiratory-motion effects on cardiovascular hemodynamics in less than 8 minutes.
In vitro experiments validated 5D flow imaging gradients and the reconstruction pipeline and demonstrated good agreement of the 5D flow reconstructions (<7%) with conventional 4D flow in net flow, peak flow, and peak velocity. Larger deviations from conventional 4D flow tended to be concentrated at the edges of the field of view, potentially because of uncorrected background phase effects. Radial techniques are known to have less-predictable background phases, and this was thus extensively investigated prior to analysis of all data sets (Figs E1–E3 [supplement]).
In vivo experiments demonstrated the potential of 5D flow MRI to resolve respiration-dependent changes in hemodynamics. Although the cohort of patients with aortic disease may not be ideal for respiratory-induced investigations, these participants were among the only individuals to receive standard-of-care 4D flow at our institution and were thus chosen for clinical workflow evaluation. The 5D flow overestimation in the ascending aorta compared with 4D flow may have been caused by the background phase by means of the radial trajectory that could not be adequately corrected. However, this effect was not observed in vitro; thus, physiologic effects captured by the 3D radial technique, which traverses the center of the k space with each line, but not those captured by the Cartesian imaging, cannot be ruled out. Prior studies of highly accelerated imaging have found that temporal undersampling and regularization often lead to blunted peak velocities and flows, potentially accounting for the significant 5D flow underestimation in the arch and descending aorta (21,22). In addition, 4D and 5D flow demonstrated good agreement with clinically derived stroke volume but demonstrated high variability between participants. Increased variability in 5D flow may be related to inadequate acquisition lengths for participants with bradycardia as well as to variable times after contrast material injection (Appendix E3 [supplement]).
Respiratory-resolved analyses suggested increased peak velocity and net flow in the SVC and decreased peak and net flow in the IVC at Resp4. Although the influence of respiration on cardiopulmonary flow has been investigated for decades, the exact relationship is still unclear (1,23,24). The varying effects of respiration reported in this study and in previous studies suggest that studies with more respiratory bins are warranted.
A main limitation of this study was the number of participants relative to the variety of diseases. In addition, time between contrast material injection could not always be optimized to the same time window based on the clinical speed and workflow (5D flow MRI was performed 10–30 minutes after injection). Reconstruction times were also long, ranging from 8 to 15 hours (4D flow, <2 minutes at the scanner). However, as hardware and reconstruction techniques rapidly improve, these times should be reduced accordingly. Future studies should include increased participant recruitment, a “breathing” phantom, contrast material investigation, a deep-breathing protocol for emphasis of respiration-driven effects, and application of techniques used in this study to further accelerate 4D flow imaging.
In summary, we have successfully implemented and applied a fully self-gated free-running 5D flow MRI framework for acquisition and evaluation of cardiac and respiratory motion–resolved 3D hemodynamics in less than 8 minutes. Although this technique requires further exploration of differences from conventional 4D flow, 5D flow is a promising starting point for a variety of applications and easy-to-operate protocols.
APPENDIX
SUPPLEMENTAL FIGURES
Acknowledgments
Acknowledgments
The authors would like to thank Julie Blaisdell, Ryan Avery, MD, Jeesoo Lee, and the staff at the Center for Translational Imaging at Northwestern University for help with statistics and facilitating participant recruitment and scanning.
Disclosures of Conflicts of Interest: L.E.M. disclosed no relevant relationships. J.Y. disclosed no relevant relationships. D.P. Activities related to the present article: disclosed no relevant relationships. Activities not related to the present article: employment with and stock/stock options for Siemens Heathineers. Other relationships: disclosed no relevant relationships. L.D.S. disclosed no relevant relationships. C.W.R. disclosed no relevant relationships. J.C.C. Activities related to the present article: disclosed no relevant relationships. Activities not related to the present article: consultancy for Bracco; consultancy, grants/grants pending, and payment for lectures from Bayer and Siemens Healthineers; grants/grants pending from Guerbet. Other relationships: disclosed no relevant relationships. C.K.R. disclosed no relevant relationships. D.K. disclosed no relevant relationships. M.S. disclosed no relevant relationships. M.M. Activities related to the present article: disclosed no relevant relationships. Activities not related to the present article: consultancy and grants/grants pending for Circle Cardiovascular Imaging, grants/grants pending from Cryolife and Siemens Healthineers. Other relationships: disclosed no relevant relationships.
Supported by the National Institutes of Health grants (NHLBI R01HL115828, NHLBI F30HL137279, and SNF 320030-173129). M.S. supported by the Swiss National Science Foundation grant (320030-173129).
Abbreviations:
- 5D
- five-dimensional
- 4D
- four-dimensional
- ICV
- inferior vena cava
- Resp1
- end expiration
- Resp4
- end inspiration
- SVC
- superior vena cava
- 3D
- three-dimensional
References
- 1.Wei Z, Whitehead KK, Khiabani RH, et al. Respiratory effects on Fontan circulation during rest and exercise using real-time cardiac magnetic resonance imaging. Ann Thorac Surg 2016;101(5):1818–1825. [DOI] [PMC free article] [PubMed] [Google Scholar]
- 2.Coppo S, Piccini D, Bonanno G, et al. Free-running 4D whole-heart self-navigated golden angle MRI: Initial results. Magn Reson Med 2015;74(5):1306–1316. [DOI] [PubMed] [Google Scholar]
- 3.Feng L, Coppo S, Piccini D, et al. 5D whole-heart sparse MRI. Magn Reson Med 2018;79(2):826–838. [DOI] [PMC free article] [PubMed] [Google Scholar]
- 4.Di Sopra L, Piccini D, Coppo S, Stuber M, Yerly J. An automated approach to fully self-gated free-running cardiac and respiratory motion-resolved 5D whole-heart MRI. Magn Reson Med 2019;82(6):2118–2132. [DOI] [PubMed] [Google Scholar]
- 5.Bastiaansen JAM, Piccini D, Di Sopra L, et al. Natively fat-suppressed 5D whole-heart MRI with a radial free-running fast-interrupted steady-state (FISS) sequence at 1.5T and 3T. Magn Reson Med 2020;83(1):45–55. [DOI] [PMC free article] [PubMed] [Google Scholar]
- 6.Cheng JY, Hanneman K, Zhang T, et al. Comprehensive motion-compensated highly accelerated 4D flow MRI with ferumoxytol enhancement for pediatric congenital heart disease. J Magn Reson Imaging 2016;43(6):1355–1368. [DOI] [PMC free article] [PubMed] [Google Scholar]
- 7.Schrauben EM, Lim JM, Goolaub DS, Marini D, Seed M, Macgowan CK. Motion robust respiratory-resolved 3D radial flow MRI and its application in neonatal congenital heart disease. Magn Reson Med 2020;83(2):535–548. [DOI] [PubMed] [Google Scholar]
- 8.Walheim J, Dillinger H, Kozerke S. Multipoint 5D flow cardiovascular magnetic resonance - accelerated cardiac- and respiratory-motion resolved mapping of mean and turbulent velocities. J Cardiovasc Magn Reson 2019;21(1):42. [DOI] [PMC free article] [PubMed] [Google Scholar]
- 9.Gu T, Korosec FR, Block WF, et al. PC VIPR: a high-speed 3D phase-contrast method for flow quantification and high-resolution angiography. AJNR Am J Neuroradiol 2005;26(4):743–749. [PMC free article] [PubMed] [Google Scholar]
- 10.Bastkowski R, Bindermann R, Brockmeier K, Weiss K, Maintz D, Giese D. Respiration dependency of caval blood flow in patients with fontan circulation: quantification using 5D flow MRI. Radiol Cardiothorac Imaging 2019;1(4):e190005. [DOI] [PMC free article] [PubMed] [Google Scholar]
- 11.Rutkowski DR, Barton G, François CJ, Bartlett HL, Anagnostopoulos PV, Roldán-Alzate A. Analysis of cavopulmonary and cardiac flow characteristics in Fontan patients: comparison with healthy volunteers. J Magn Reson Imaging 2019;49(6):1786–1799. [DOI] [PMC free article] [PubMed] [Google Scholar]
- 12.Schrauben EM, Anderson AG, Johnson KM, Wieben O. Respiratory-induced venous blood flow effects using flexible retrospective double-gating. J Magn Reson Imaging 2015;42(1):211–216. [DOI] [PubMed] [Google Scholar]
- 13.Piccini D, Littmann A, Nielles-Vallespin S, Zenge MO. Spiral phyllotaxis: the natural way to construct a 3D radial trajectory in MRI. Magn Reson Med 2011;66(4):1049–1056. [DOI] [PubMed] [Google Scholar]
- 14.Pang J, Sharif B, Fan Z, et al. ECG and navigator-free four-dimensional whole-heart coronary MRA for simultaneous visualization of cardiac anatomy and function. Magn Reson Med 2014;72(5):1208–1217. [DOI] [PMC free article] [PubMed] [Google Scholar]
- 15.Chandarana H, Feng L, Ream J, et al. Respiratory motion-resolved compressed sensing reconstruction of free-breathing radial acquisition for dynamic liver magnetic resonance imaging. Invest Radiol 2015;50(11):749–756. [DOI] [PMC free article] [PubMed] [Google Scholar]
- 16.Feng L, Axel L, Chandarana H, Block KT, Sodickson DK, Otazo R. XD-GRASP: Golden-angle radial MRI with reconstruction of extra motion-state dimensions using compressed sensing. Magn Reson Med 2016;75(2):775–788. [DOI] [PMC free article] [PubMed] [Google Scholar]
- 17.Grimm R, Block K, Kiefer B, Hornegger J. Bias correction for respiration detection in radial 3D gradient-echo imaging [abstr]. In: Reinhold C, ed. Proceedings of the International Society for Magnetic Resonance in Medicine. Vol. 19. Berkeley, Calif: International Society for Magnetic Resonance in Medicine, 2011; 2677. [Google Scholar]
- 18.Hsia TY, Khambadkone S, Redington AN, Migliavacca F, Deanfield JE, de Leval MR. Effects of respiration and gravity on infradiaphragmatic venous flow in normal and Fontan patients. Circulation 2000;102(19 Suppl 3):III148–III153. [DOI] [PubMed] [Google Scholar]
- 19.Lorenz R, Benk C, Bock J, et al. Closed circuit MR compatible pulsatile pump system using a ventricular assist device and pressure control unit. Magn Reson Med 2012;67(1):258–268. [DOI] [PubMed] [Google Scholar]
- 20.Bock J, Kreher B, Hennig J, Markl M. Optimized pre-processing of time-resolved 2D and 3D phase contrast MRI data [abstr]. In: Proceedings of the the International Society for Magnetic Resonance in Medicine. Vol. 15. Berkeley, Calif: International Society for Magnetic Resonance in Medicine, 2007; 3138. [Google Scholar]
- 21.Ma LE, Markl M, Chow K, et al. Aortic 4D flow MRI in 2 minutes using compressed sensing, respiratory controlled adaptive k-space reordering, and inline reconstruction. Magn Reson Med 2019;81(6):3675–3690. [DOI] [PMC free article] [PubMed] [Google Scholar]
- 22.Giese D, Wong J, Greil GF, Buehrer M, Schaeffter T, Kozerke S. Towards highly accelerated Cartesian time-resolved 3D flow cardiovascular magnetic resonance in the clinical setting. J Cardiovasc Magn Reson 2014;16(1):42. [DOI] [PMC free article] [PubMed] [Google Scholar]
- 23.Gabbert DD, Hart C, Jerosch-Herold M, et al. Heart beat but not respiration is the main driving force of the systemic venous return in the Fontan circulation. Sci Rep 2019;9(1):2034 [Published correction appears in Sci Rep 2019;9(1):14353.]. [DOI] [PMC free article] [PubMed] [Google Scholar]
- 24.Préau S, Dewavrin F, Soland V, et al. Hemodynamic changes during a deep inspiration maneuver predict fluid responsiveness in spontaneously breathing patients. Cardiol Res Pract 2012;2012;191807. [DOI] [PMC free article] [PubMed] [Google Scholar]
Associated Data
This section collects any data citations, data availability statements, or supplementary materials included in this article.


![A–C, Respiration-resolved evaluation of three-dimensional hemodynamics in a 65-year-old man with thoracic aortic aneurysm and no valve disease (heart rate, 50 beats per minute during imaging). A, Evaluation of caval inflow (superior vena cava [SVC] and inferior vena cava [IVC]) into the right atrium shows some increased peak velocities in the SVC and decreased velocities in the IVC at end expiration. B, C, Color maps reveal an increase in IVC peak flow and a potential temporal flow shift in this participant. D–F, Respiration-resolved evaluation of three-dimensional hemodynamics in a 61-year-old woman with a bicuspid aortic valve (heart rate, 59 beats per minute during the imaging) shows similar hemodynamic patterns. SVC and IVC color maps show differences in potential temporal shifts between respiratory flow curves. This participant also has noticeably less-noisy flow curves than the participant in A–C. See Movies 4–7 (supplement). IVC1 = IVC plane 1, IVC2 = IVC plane 2, Resp 1 = end expiration, Resp 2 = intermediate respiratory position more proximal to Resp 1, Resp 3 = intermediate respiratory position more proximal to Resp 4, Resp 4 = end inspiration, SVC = superior vena cava, SVC1 = SVC plane 1, SVC2 = SVC plane 2, SVC3 = SVC plane 3.](https://cdn.ncbi.nlm.nih.gov/pmc/blobs/7a20/7977997/92b42efa77bb/ryct.2020200219.fig3.jpg)
