PLOS ONE logoLink to PLOS ONE
. 2020 Dec 22;15(12):e0243812. doi: 10.1371/journal.pone.0243812

Transferrin receptor regulates malignancies and the stemness of hepatocellular carcinoma-derived cancer stem-like cells by affecting iron accumulation

Chong Xiao 1,#, Xi Fu 2,#, Yuting Wang 2, Hong Liu 2, Yifang Jiang 2, Ziyi Zhao 2,*, Fengming You 2,*
Editor: Gianpaolo Papaccio3
PMCID: PMC7755206  PMID: 33351833

Abstract

Background

Iron metabolism is essential because it plays regulatory roles in various physiological and pathological processes. Disorders of iron metabolism balance are related to various cancers, including hepatocellular carcinoma. Cancer stem-like cells (CSCs) exert critical effects on chemotherapy failure, cancer metastasis, and subsequent disease recurrence and relapse. However, little is known about how iron metabolism affects liver CSCs. Here, we investigated the expression of transferrin receptor 1 (TFR1) and ferroportin (FPN), two iron importers, and an upstream regulator, iron regulatory protein 2 (IRP2), in liver hepatocellular carcinoma (LIHC) and related CSCs.

Methods

The expression levels of TFR1, FPN and IRP2 were analysed using the GEPIA database. CSCs were derived from parental LIHC cells cultured in serum-free medium. After TFR1 knockdown, ROS accumulation and malignant behaviours were measured. The CCK-8 assay was performed to detect cell viability after TFR1 knockdown and erastin treatment.

Results

TFR1 expression was upregulated in LIHC tissue and CSCs derived from LIHC cell lines, prompting us to investigate the roles of TFR1 in regulating CSCs. Knockdown of TFR1 expression decreased iron accumulation and inhibited malignant behaviour. Knockdown of TFR1 expression decreased reactive oxygen species (ROS) accumulation induced by erastin treatment and maintained mitochondrial function, indicating that TFR1 is critical in regulating erastin-induced cell death in CSCs. Additionally, knockdown of TFR1 expression decreased sphere formation by decreasing iron accumulation in CSCs, indicating a potential role for TFR1 in maintaining stemness.

Conclusion

These findings, which revealed TFR1 as a critical regulator of LIHC CSCs in malignant behaviour and stemness that functions by regulating iron accumulation, may have implications to improve therapeutic approaches.

Introduction

Cancer stem-like cells (CSCs) are a subpopulation of cancer cells that are characterized by self-renewal and differentiation capacities that are similar to those of normal stem cells [1]. CSCs are tightly associated with tumourigenesis, metastasis and the development of chemotherapy and radiation resistance and may cause tumour relapse after treatment [2]. CSCs derived from hepatocellular carcinoma have been identified by several potential surface markers, including CD24, CD44, and CD133 [3]. They display specific features that enable certain processes, including tumourigenesis, chemoresistance, metastasis and recurrence [4]; thus, investigation of CSCs is needed to develop a potential therapeutic strategy for hepatocellular carcinoma.

Iron is a crucial element in physiological and pathological cell metabolism and biosynthesis and is essential for cell growth and proliferation. Iron homeostasis increases intracellular iron accumulation and availability [5]. Iron uptake is necessary for various vital enzyme functions, including those of mitochondrial enzymes that are essential for the production of energy and reactive oxygen species (ROS), which are responsible for the antioxidant machinery of cells [6]. Iron is also essential in both tumour initiation and tumour progression. In hepatocellular carcinoma, iron overload occurs, leading to ROS formation and mutagenesis [7]. Raggi and colleagues reported that CSCs derived from cholangiocarcinoma expressed increased levels of iron proteins and exhibited high iron accumulation and increased oxidative stress and CSC marker expression compared with parental cells growing as monolayers [8], demonstrating that iron metabolism may also regulate malignancies and CSC stemness in hepatocellular carcinoma.

Transferrin receptor 1 (TFR1) is one of the most crucial proteins for iron uptake and is expressed universally among cell types [9]. Its ligand, transferrin (TF), forms a heterodimer with TFR1 to carry Fe2 for transmembrane transport [10]. TFR1 activity is vital for cancer cells to absorb iron and is deeply involved in tumour onset and progression [11]. In many cancers, TFR1 is significantly dysregulated, and iron uptake is abnormal [12], demonstrating that TFR1 may act as a critical regulator of cancers by affecting iron accumulation. In hepatocellular carcinoma, systemic and intracellular iron homeostasis is altered [6, 13] because of the overexpression of TFR1, indicating the critical role of TFR1 in regulating iron homeostasis [14]. Moreover, TFR1 expression is upregulated in cholangiocarcinoma CSCs, and its activity is associated with increased iron uptake [8]. Knockdown of TFR1 expression decreases iron accumulation and stemness marker expression, indicating a critical role for TFR1 in the stem cell compartment mediated by regulating iron accumulation. However, little is known about how TFR1 affects the malignancy and stemness of CSCs in hepatocellular carcinoma.

This study aimed to determine the expression level and potential roles of TFR1 in the regulation of stemness and malignancy in CSCs derived from hepatocellular carcinoma cells. We show that the presence of TFR1 is essential for iron uptake, malignancy and stemness in CSCs derived from hepatocellular carcinoma. Moreover, TFR1 is critical in regulating ferroptosis-related cell death, indicating its potential as a therapeutic target.

Material and methods

Gene expression analysis

Gene Expression Profiling Interactive Analysis (GEPIA, http://gepia.cancer-pku.cn/) was employed as a convenient and accurate online tool based on data from the TCGA and Genotype-Tissue Expression databases [15]. To analyse the mRNA expression of TFR1, FPN and IRP2, we used GEPIA to compare their expression in LHIC samples and normal samples. Moreover, the Human Protein Atlas (https://www.proteinatlas.org/) database was used for immunohistochemistry (IHC) analysis.

Cell culture

The hepatocellular carcinoma cell line Huh-7 was obtained from the Japanese Cell Research Bank (catalogue No.: JCRB0403), and SK-HEP-1 was obtained from the American Type Culture Collection (ATCC; Manassas, VA, USA; cat. No.: ATCC®HTB-52) and stored in our laboratory. These cells were incubated in Dulbecco Modified Eagle Medium-F12 (DMEM/F12; Life Technologies, Grand Island, NY, USA) without 10% foetal bovine serum (FBS; Sigma Chemical Co., St. Louis, MO) supplemented with 2% B-27 (Life Technologies, Grand Island, NY, USA), 20 ng/ml of epidermal growth factor (EGF) and 10 ng/ml of fibroblast growth factor-basic (bFGF; PeproTech, Rocky Hill, NJ, USA). The cells were passaged every 12 days and replated in SFM.

Serial replating experiments

Cells were replated at clonal density (1,000 cells/well) and cultured in serum-free medium supplemented with 2% B 27, 10 ng/ml of EGF and 20 ng/ml of bFGF. When indicated, the medium was half replaced. After 14 days, the cells were washed with PBS, fixed with 4% paraformaldehyde in PBS, stained with 0.1% crystal violet (Sigma-Aldrich, St. Louis, MO, USA) for 10 min, washed with PBS, and subjected to colony counting. For replating, the same number of cells were plated in SFM. After 14 days, the same procedure was performed.

Western blotting

Total protein was prepared using RIPA buffer (Thermo Scientific, Waltham, MA, USA) following the manufacturer’s instructions. Next, 20 μg of protein was fractionated using Tris-glycine gels and transferred to PVDF membranes. The PVDF membranes were blocked in 5% milk/TBS buffer at room temperature for 60 min and then incubated for 1 h with primary antibodies at a dilution of 1:1000. The following primary antibodies were purchased from Abcam (Cambridge, England): CD24 (cat. No.: ab202073), CD44 (cat. No.: ab18668), CD133 (cat. No.: ab216323), β-actin (cat. No.: ab8226) and TFR1 (cat. No.: ab214039). After washing three times with PBS-T (containing 0.1% Tween-20), the HRP-conjugated secondary antibody (cat. No.: ab6721) was incubated with the PVDF membranes for another 1 h. The blots were developed using Pierce ECL Western Blotting Substrate (Thermo Scientific, Waltham, MA, USA) according to the manufacturer’s instructions.

shRNA transfection

shRNAs targeting TRF1 (shTRF1-1 and shTRF1-2) were purchased from Sigma-Aldrich. The relative sequences were as follows: shTRF1-1, 5’- CCCAGCAACAAGACCTTAATA-3’; and shTRF1-2, 5’- CCCTTGATGCACAGTTTGAAA-3’. An shRNA with a scrambled sequence (5’- GAAGCTGCCCACCAGATTG-3’) was used as a negative control (shScrambled). For each transfection, 1×10³ spheres from the second passage (>50 μm in diameter) were transferred to a 12-well plate, and 0.8 μg of plasmid was mixed with 4 μl of Lipofectamine 2000 transfection reagent (Thermo Scientific, Waltham, MA, USA) in 0.5 ml of OptiMEM medium (Thermo Scientific, Waltham, MA, USA); this mixture was then applied to cells for 4 h followed by medium replenishment.

Cell cycle analysis

Spheres from the second passage were collected and washed 3 times with pre-chilled PBS. Next, 0.25% trypsin was applied to obtain single cells, which were fixed using 1 ml of 75% ice-cold alcohol for 2 h at 4°C and washed twice with PBS with the addition of 100 μl of RNase A and 400 μl of propidium iodide (PI) (Sigma-Aldrich Chemical Company, St Louis, MO, USA), followed by incubation for 30 min at room temperature. The stained cells were measured using a FACS LSRII flow cytometer (BD Biosciences, Franklin Lakes, NJ, USA), and data were analysed using the ModFit analysis software program (version 4.0; Verity Software House, Inc., Topsham, ME, USA).

Tumour formation in soft agar

Next, 4×10³ single cells from spheres of the second passage were seeded in serum-free RPMI 1640 medium and dissolved in 0.3% low-melting agarose (Sigma-Aldrich, St. Louis, MO, USA) supplemented with 2% B 27, 10 ng/ml of EGF and 20 ng/ml of bFGF. Cells were grown for 14 days, and colonies were visualized with 5% 4-nitro blue tetrazolium chloride staining, for which>50 cells indicated approximately>50 μm in diameter.

Inductively coupled plasma-mass spectrometry (ICP-MS) analysis

Samples were digested in 70% trace metal basis nitric acid (Sigma-Aldrich, St Louis, MO, USA) and then diluted with double-distilled H2O. The prepared samples were analysed using ICP-MS (Thermo Fisher Scientific, Bremen, Germany) following the manufacturer’s instructions. The iron concentration was presented as μg per gram of sample weight. Data are representative of 3 separate experiments.

Mitochondrial labile iron pool measurement

RPA (Squarix Biotechnology GmbH, Marl, Germany) was used to detect free mitochondrial iron. Cell culture media were removed and replaced with RPA (0.5 μM for 20 min in HBSS (Biotime) at 37°C), and cells were washed and imaged under an X71 (U-RFL-T) fluorescence microscope (Olympus, Melville, NY).

CCK-8 assay

Cell viability was determined with the CCK-8 assay. Briefly, for each 96-well plate, 100 spheres from the second passage (>50 μm in diameter) were seeded. After treatment with 0, 0.2 or 0.8 μM erastin for 16 h, 10 μl of freshly prepared CCK-8 solution was added to the cell culture for a 2-h co-incubation. The absorbance was measured at 620 nm.

Mitochondrial fraction collection

Mitochondria were isolated using a Cell Mitochondria Isolation Kit (Beyotime Jiangsu, China). Briefly, the collected cells were resuspended and homogenized in extraction buffer on ice for 15 min. The cell lysate was then centrifuged at 800 g for 10 min at 4°C. The pellets were collected as the mitochondrial fraction.

Statistical analysis

All the results are expressed as the mean ± standard error of the mean (SEM). Differences between two independent groups were evaluated using an unpaired Student’s t test, and differences between multiple groups for one or two variables were evaluated using one-way or two-way ANOVA, respectively, with GraphPad Prism 5 software (GraphPad Software, Inc.). Bonferroni’s post-hoc test was employed after ANOVA to test all pairwise comparisons. A 2-tailed value of P < 0.05 was considered statistically significant.

Results

The expression levels of iron metabolism-related genes and proteins are consistently altered in liver hepatocellular carcinoma (LIHC)

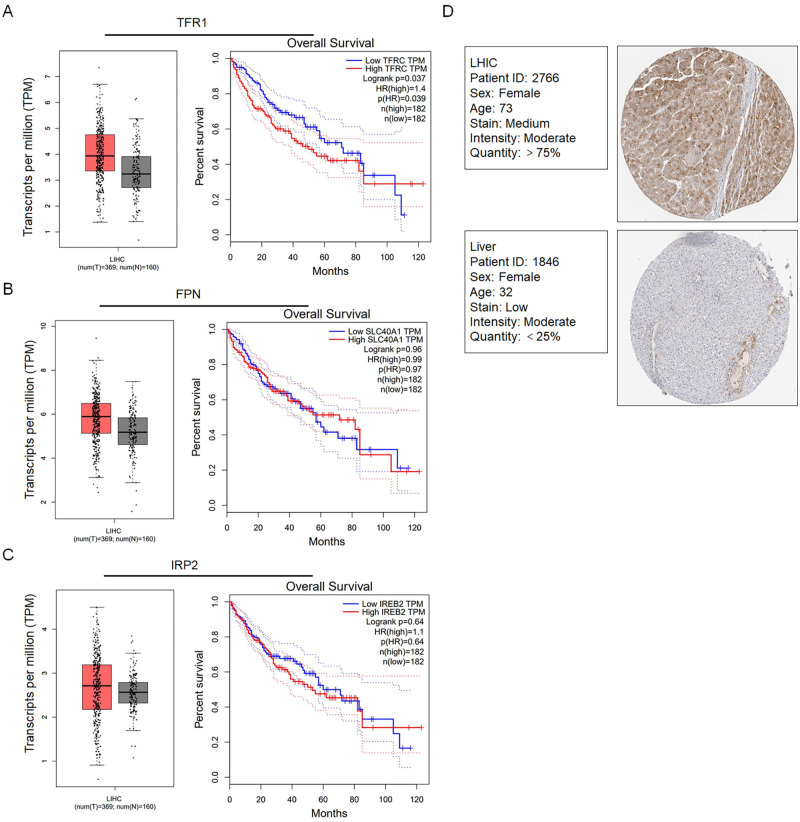
We first detected whether iron metabolism-related genes, including TFR1, FPN and IRP2, were altered in LIHC from the TCGA by using the GEPIA online tool (369 LIHC samples and 160 normal samples) (http://gepia.cancer-pku.cn/), which showed that the gene expression levels were upregulated compared with those in normal samples (Fig 1A–1C). Next, we analysed overall survival in patients with high expression of TFR1 but not FPN and IRP2 and found a significantly short overall survival time (TFR1 P = 0.039). Additionally, IHC demonstrated that the TFR1 protein levels in LIHC were upregulated (Fig 1D).

Fig 1. Expression of iron metabolism-related genes in hepatocarcinoma tissues using the GEPIA platform.

Fig 1

The expression levels of TFR1 (A), FPN (B), and IRP2 (C) in hepatocarcinoma tissues and their relationship with the survival rate of 369 patients were compared with those in normal liver tissues from 160 patients. D. Comparison of TFR1 protein expression between hepatocarcinoma tissues and normal liver tissues from the TCGA CAB005052 dataset in the Human Protein Atlas was performed using immunohistochemistry.

TFR1 is upregulated in CSCs derived from hepatocellular carcinoma cell lines

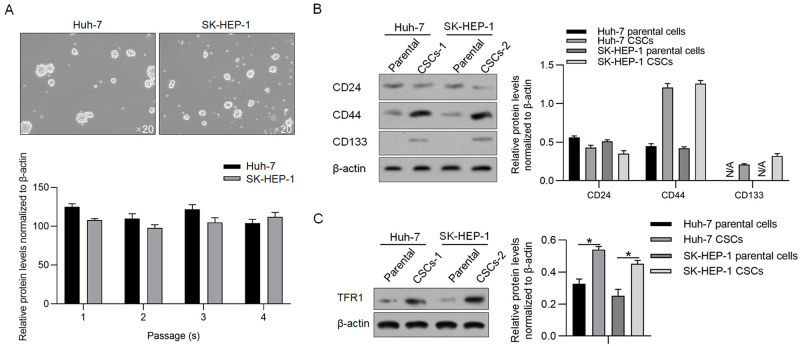
To evaluate the role of TFR1 in CSCs derived from hepatocellular carcinoma cell lines, including Huh-7 and SK-HEP-1, we first enriched CSCs by culturing them in serum-free medium. Tumour sphere formation and self-renewal capacity are typical properties of CSCs in vitro [16, 17]. Both cell lines formed unattached tumour spheres and exhibited self-renewal capacity (Fig 2A). Compared with relative parental cells, CSCs presented significantly higher expression levels of CD44 and CD133, two stemness markers [1820]. Surprisingly, CD24, a stemness marker of HCC [21], was not different between parental cells and CSCs (Fig 2B). Western blotting confirmed that TFR1 was significantly increased in CSCs derived from relative parental cells (Fig 2C). These results indicated that CSCs derived from HCC presented stemness and upregulated TFR1 protein levels.

Fig 2. TFR1 protein levels in CSCs derived from hepatocarcinoma cell lines.

Fig 2

A. Spheres were observed by culturing Huh-7 and SK-HEP-1 cells in serum-free medium. Images were obtained using a 20× objective. B. Stemness markers, including CD24, CD133 and CD44, were measured by performing western blotting. C. TFR1 protein expression was measured in CSCs and compared with that in the parental cells. *P<0.05, vs. parental cells.

TFR1 induces aggressive phenotypes in CSCs derived from human hepatocellular cancer cells

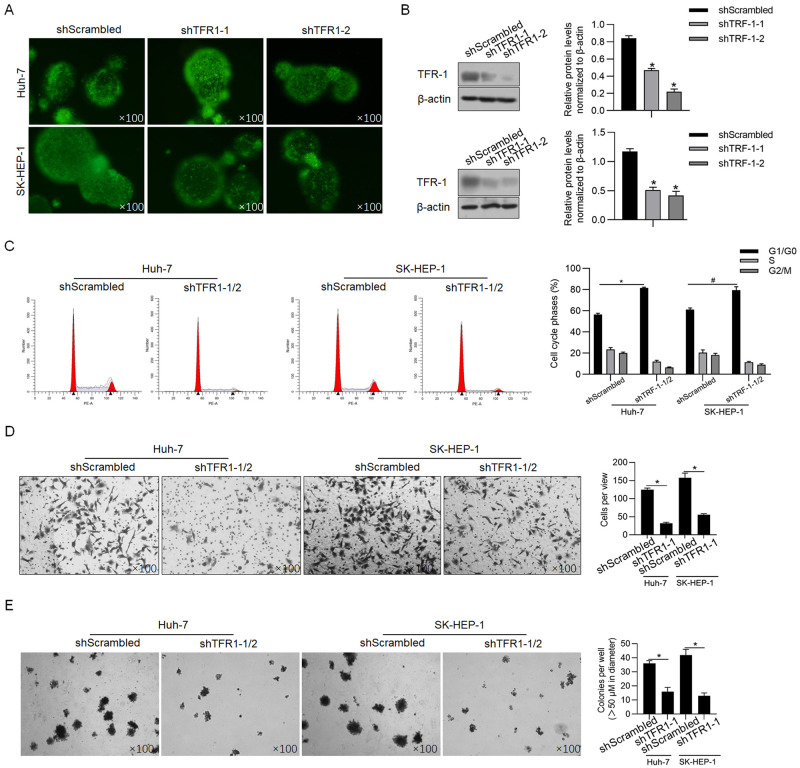
Considering the relatively high endogenous level of TFR1 in both Huh-7- and SK-HEP-1-derived CSCs (Fig 2C), two shRNAs targeting TFR1 mRNA were efficiently introduced into CSCs to knockdown the TFR1 mRNA level (Fig 3A). Compared with the scrambled control group (shScrambled), the TFR1 protein levels in CSCs derived from Huh-7 and SK-HEP-1 cells were significantly downregulated by both shRNAs (Fig 3B), prompting us to transfect mixed shRNAs (shTFR1-1/2). Forty-eight hours after transfection, indicators of malignant behaviours, including cell cycle distribution, invasive capacity and colony formation, were analysed. Consistent with previous reports presenting that TRF1 promotes malignant behaviours in several types of cancers, including breast cancer [22], lung cancer [23], and liver cancer [24], we observed that TFR1 downregulation significantly blocked the cell cycle at G1/G0 phase (Fig 3C). The Transwell assay revealed that the number of transferred cells in the TFR1 knockdown group (26.5±1.7 cells/view for Huh-7; 53.5±1.4 cells/view for SK-HEP-1) was significantly less than that in the shScrambled group (122.5±3.8 cells/view for Huh-7; 153.2±16.5 cells/view for SK-HEP-1) (Fig 3D). Expectedly, the colony formation ability was also significantly decreased in CSCs derived from Huh-7 or SK-HEP-1 cells (Fig 3E).

Fig 3. Effects of TFR1 on the malignant behaviours of CSCs.

Fig 3

A. Fluorescence was observed 48 h after shRNA transfection. Images were obtained using a 100× objective. B. TFR1 knockdown efficacy was measured by performing western blotting. *P<0.05, vs. shScrambled-transfected cells. After TRF1 knockdown in CSCs derived from Huh-7 and SK-HEP-1 cells, malignant behaviours, including cell cycle distribution (C), invasive ability (D) and tumour formation in soft agar (E), were measured. *P<0.05, vs. shScrambled-transfected cells. Images were obtained using a 100× objective.

TFR1 regulates iron accumulation

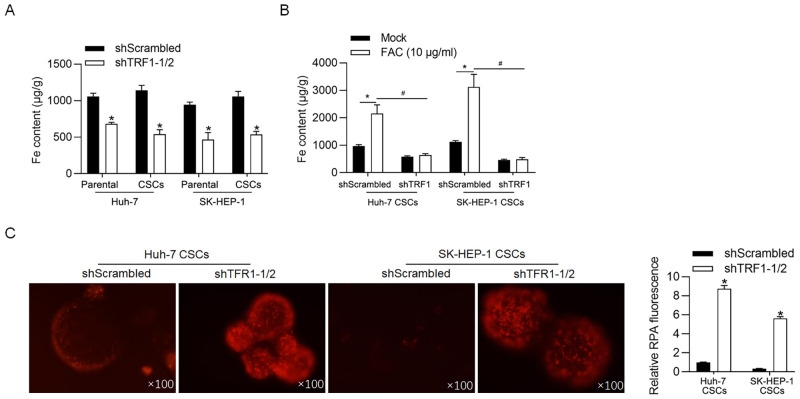
TFR1-induced iron accumulation contributes to the promotion of malignant behaviours in triple-negative breast cancer cells [25]. Thus, we confirmed whether TFR1 regulates iron accumulation in CSCs. Expectedly, after cells were transfected with shTFR1-1/2 for 48 h, the iron concentration in CSCs derived from both Huh-7 and SK-HEP-1 cells was markedly decreased compared with that in shScrambled cells (Fig 4A), indicating that TFR1 is essential for iron uptake. Although CSCs expressed high levels of TFR1, no difference in the iron level was observed in CSCs compared with that in parental cells, likely because of the low iron level in the medium. Thus, CSCs and parental cells were treated with 10 μg/ml of ferric ammonium citrate (FAC, iron source; Sigma-Aldrich). As shown in Fig 4B, the addition of FAC significantly increased iron accumulation in CSCs derived from both Huh-7 and SK-HEP-1 cells, and the knockdown of TFR1 abolished the effect of FAC addition on the iron level. Next, we measured the levels of the mitochondrial labile iron pool after TFR1 knockdown. Knockdown of TFR1 increased the fluorescence signal of rhodamine B4-[(1,10-phenanthroline-5-yl) aminocarbonyl] benzyl ester (RPA) (Fig 4C).

Fig 4. TFR1 accumulates intracellular iron in CSCs.

Fig 4

A. Intracellular iron levels were measured 48 h later TFR1 knockdown. *P<0.05, vs. shScrambled-transfected cells. B. After the addition of 10 μg/ml of FAC, the intracellular iron levels were measured. *P<0.05, vs. shScrambled-transfected cells. #P<0.05, vs. shScrambled-transfected+FAC cells. C. The level of chelatable intracellular iron was measured with RPA. Images were obtained using a 100× objective. *P<0.05, vs. shScrambled-transfected cells.

TFR1 is critical for the erastin-induced cell viability decrease in CSCs

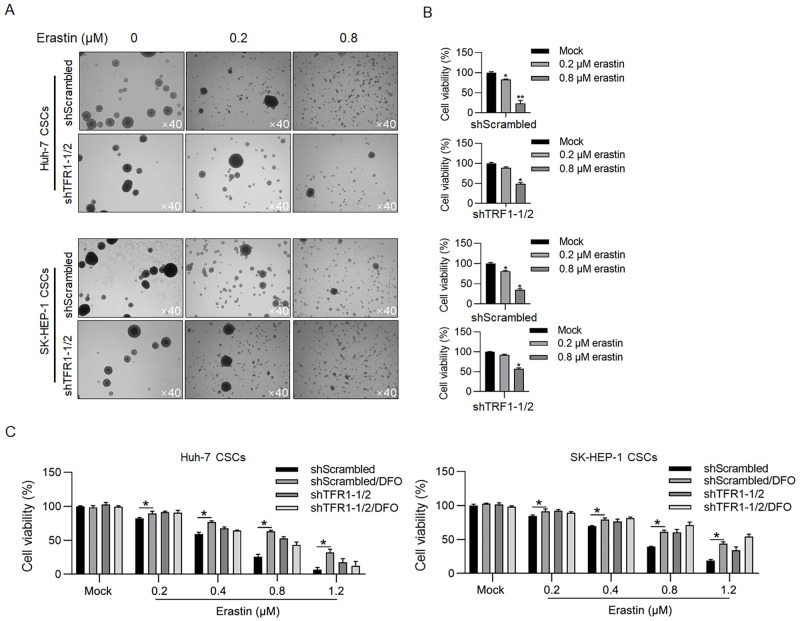
Considering that the expression level of TFR1 is tightly associated with ferroptosis, which is dependent on the presence of iron, we next evaluated the effect of TFR1 on ferroptosis in CSCs. To induce ferroptosis, erastin, a widely used ferroptosis inducer, was employed. Spheres derived from both Huh-7 and SK-HEP-1 cells were dissociated by the addition of erastin (Fig 5A), and a decrease in cell viability was observed (19.3±5.3% in Huh-7 and 27.2±2.9% in SK-HEP-1 after 0.8-μM erastin treatment; Fig 5B). Knockdown of TFR1-1/2 protected spheres against erastin in sphere formation and cell viability (49.1±2.5% in Huh-7 and 56.9±1.5% in SK-HEP-1 after 0.8-μM erastin treatment; Fig 5A & 5B). To further confirm whether TFR1 is critical for erastin-induced ferroptosis in CSCs, deferoxamine mesylate (DFO), an iron chelator, was employed as a ferroptosis inhibitor. The addition of DFO reversed the decrease in cell viability induced by erastin, a finding that was similar to the effect of TFR1 knockdown (Fig 5C). Taken together, these data show that TFR1 is critical for erastin-induced ferroptosis in CSCs.

Fig 5. TFR1 promoted erastin-induced death in CSCs.

Fig 5

A. After TFR1 knockdown, sphere formation under the presence of 0.2 or 0.8 μM erastin was observed. Images were obtained using a 40× objective. B. After TFR1 knockdown, cell viability was measured in the presence of 0.2 or 0.8 μM erastin by performing the CCK-8 assay. *P<0.05, vs. the Mock group; **P<0.01, vs. the Mock group. C. Cell viability was measured in the presence of DFO, a ferroptosis inhibitor. *P<0.05, vs. the shScrambled group.

TFR1 regulates mitochondrial function via iron accumulation

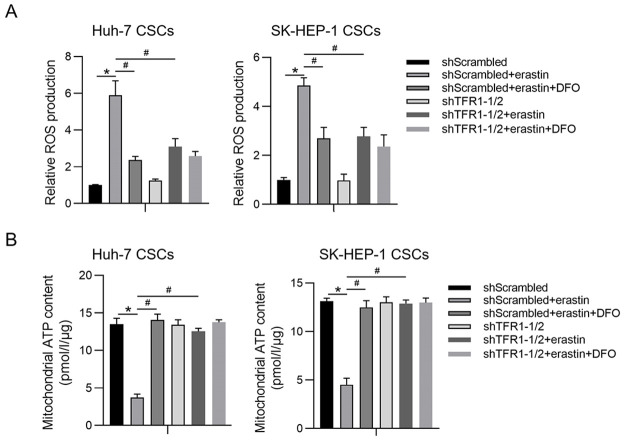
Mitochondria are the major sites of intracellular iron distribution, and iron accumulation is tightly related to mitochondrial function [26]. Next, we determined whether TFR1 regulates mitochondrial function after erastin treatment. To explore whether TFR1 affects ROS accumulation, spheres were treated with carboxyl-2’, 7’-dichlorofluorescein diacetate (DCFH-DA). The intracellular ROS levels were significantly increased in CSCs after erastin treatment and were significantly decreased by TFR1 knockdown or DFO addition (Fig 6A). Intracellular ROS tightly regulate mitochondrial function, particularly mitochondrial ATP synthesis, by modifying mitochondrial membrane potential homeostasis [27]. Thus, we extracted mitochondria and measured mitochondrial ATP synthesis. Expectedly, knockdown of TFR1 reversed the inhibition of mitochondrial ATP synthesis by erastin, indicating that TFR1 may maintain mitochondrial function under erastin treatment (Fig 6B).

Fig 6. TFR1 maintains ROS homeostasis by regulating iron accumulation.

Fig 6

A. Intracellular ROS were measured. *P<0.05, vs. the shScrambled group; #P<0.05, vs. the shScrambled+erastin group. B. Mitochondrial ATP synthesis was measured. *P<0.05, vs. the shScrambled group; #P<0.05, vs. the shScrambled+erastin group.

TFR1 may maintain the stemness of CSCs by regulating iron accumulation

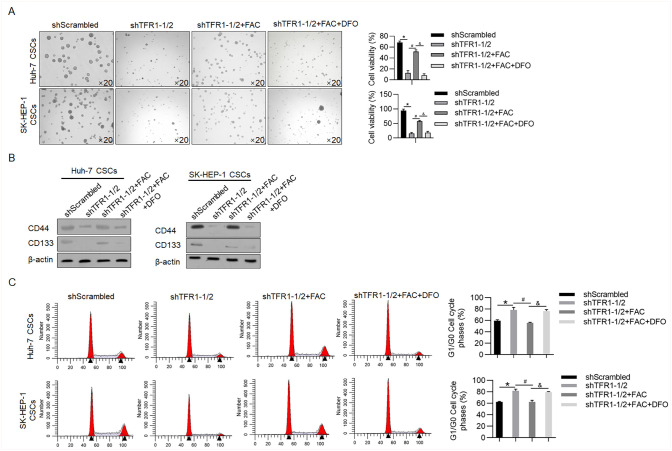
The addition of iron induces the stemness and malignant behaviours of CSCs in human lung cancer cells in an epithelial-to-mesenchymal transition-independent manner without affecting the role of TFR1 [8, 28], indicating that TFR1 may regulate the stemness of CSCs by modifying iron accumulation. Knockdown of TFR1 significantly decreased sphere formation (11.5±7.7% vs 67.5±3.1% in Huh-7 CSCs; 13.6±1.5% vs. 94.5±4.1% in SK-HEP-1 CSCs; p<0.05; Fig 7A). The addition of FAC obviously reversed the effect of the knockdown of TFR1 on sphere formation that was abolished by the addition of DFO (51.2±4.1% vs. 11.5±7.7% in Huh-7 CSCs; 57.4±1.3% vs. 13.6±1.5% in SK-HEP-1 CSCs; p<0.05; Fig 7B). A decrease in CD44 and CD133 also confirmed that the knockdown of TFR1 decreased CSC stemness (Fig 7B). We further analysed the cell cycle after TFR1 knockdown using FAC or DFO. The knockdown of TFR1 decreased the number of cells in G1/G0 phase, and the addition of FAC reversed the decrease in G1/G0, which was abolished by the addition of DFO (Fig 7C). This result indicates that TFR1 might also regulate cell proliferation by modifying iron accumulation in CSCs.

Fig 7. TFR1 may maintain the stemness and proliferation of CSCs by regulating iron accumulation.

Fig 7

Sphere formation (A), expression of stemness markers (B), and cell cycle (C) analyses were performed after TFR1 knockdown in the presence or absence of FAC and DFO. Images were obtained using a 20× objective. *P<0.05, vs. the shScrambled group. #P<0.05, vs. the shTFR1-1/2 group; &P<0.05, vs. the shTFR1-1/2+FAC group.

Discussion

Tumour heterogeneity can be used to characterize several different subpopulations, including parental tumour cells (most tumour cells), CSCs (also identified as tumour-initiating cells) and neighbouring cells (including immune cells, cancer-associated fibroblasts and endothelial cells) [29]. These cells comprise the solid tumour and form the tumour microenvironment [30]. Accumulating evidence supports that the presence of CSCs in a subpopulation is essential for tumour growth and progression and that the ability of this subpopulation to induce chemo- and/or radioresistance is the main cause of disease relapse and recurrence. It is crucial to determine the regulatory mechanisms of CSCs to understand their aggressive behaviour and provide a promising therapeutic strategy for cancer therapy.

The results presented here demonstrate that TFR1 expression is dramatically upregulated and that TFR1 regulates the iron metabolism balance in CSCs derived from hepatocellular carcinoma cells. Specifically, CSCs are characterized by enhanced iron accumulation, which is reversed by TFR1 knockdown or the addition of DFO. Knockdown of TFR1 expression not only affects the iron metabolism balance but also decreases CSC malignancy and stemness, potentially by inducing mitochondrial dysfunction. Increased iron uptake sensitises CSCs to erastin, a ferroptotic inducer, and leads to increased cell death. Furthermore, our results suggest that CSCs develop an enhanced dependence on iron via upregulated TFR1 expression that may be targeted by both agents that induce iron-dependent ferroptosis and agents activated by concentrated iron.

Accumulating evidence has shown that the iron metabolism balance is altered in cancers and that tumour cells require more iron uptake than their normal or adjacent counterparts to support several malignant behaviours, including proliferation, migration, invasion and tumourigenesis [3135]. Accordingly, most cancer cells exhibit upregulated expression of TFR1 and reduced levels of FPN, causing intracellular iron accumulation [36]. In this study, the analysis of TCGA data and survival correlation analysis using GEPIA revealed that TFR1 expression but not FPN or IRP2 expression was upregulated in LIHC tissue compared with normal liver tissue, prompting us to focus on the potential effect of TFR1 on CSCs derived from liver cancer cells. Given the well-known inverse correlation between TFR1 and FPN [36], we surprisingly found that TFR1 was not negatively correlated with FPN, indicating that TFR1 may function in a manner that is dependent on FPN.

In several cancer types, ROS accumulation in tumour cells and the tumour microenvironment promotes carcinogenesis and metastasis [3739]. Moreover, iron-induced ROS accumulation in normal stem cells and CSCs was also found to augment malignant behaviours, in part, through enrichment of the CSC stem-like phenotype [28]. Chanvorachote and colleagues reported that in CSCs derived from non-small cell lung tumours, iron exposure and elevated levels of hydroxyl radicals correlated well with an increased CSC subpopulation and promoted malignant behaviours, including sphere formation, proliferation, migration and invasion [28]. They also determined that iron exposure stimulated sex-determining region Y (SRY)-box 9 protein, thus promoting stemness. Consistent with previous findings, we found that iron accumulation induced by TFR1 maintained stemness and promoted malignant behaviours in CSCs derived from hepatocellular carcinoma cells. Moreover, erastin-induced ROS accumulation was significantly decreased by TFR1 knockdown, indicating that TFR1 may be a critical regulator of iron accumulation, thus regulating the malignancy and stemness of CSCs. However, we failed to determine whether TFR1 and FPN are inversely correlated in CSCs, which is worth further investigation.

We also investigated the effect of increased iron accumulation mediated by TFR1 on ferroptosis, which is a characterized programmed cell death process dependent on the presence of iron. As expected, knockdown of TFR1 expression significantly decreased erastin-induced cell death in CSCs, indicating that TFR1 may be an indicator for therapeutic decision-making. Notably, considering the high endogenous level of TFR1, we chose to knock down rather than overexpress TFR1 to study its function. Taken together, our results indicate that a ferroptosis-inducing strategy for the treatment of hepatocellular carcinoma has the potential to address this clinical difficulty.

Supporting information

S1 File

(ZIP)

Acknowledgments

The authors would like to thank Mr. Tao Hong for language editing and suggestions for statistical analysis.

Data Availability

All relevant data are within the manuscript and its Supporting information files.

Funding Statement

This work was supported by Young Scientists Fund of the National Natural Science Foundation of China (Grant No. 81803994), General Program of National Natural Science Foundation of China (Grant No. 81774284), International Cooperation Project of Sichuan Science and Technology Department (Grant No. 2019YFH0152) and Science and Technology Developmental Foundation of Chengdu University of TCM (Grant No. QNXZ2019022) The funders had no role in study design, data collection and analysis, decision to publish, or preparation of the manuscript.

References

  • 1.Baylin SB, Jones PA (2011) A decade of exploring the cancer epigenome—biological and translational implications. Nat Rev Cancer 11: 726–734. 10.1038/nrc3130 [DOI] [PMC free article] [PubMed] [Google Scholar]
  • 2.Liu YC, Yeh CT, Lin KH (2020) Cancer Stem Cell Functions in Hepatocellular Carcinoma and Comprehensive Therapeutic Strategies. Cells 9 10.3390/cells9061331 [DOI] [PMC free article] [PubMed] [Google Scholar]
  • 3.Zhu Z, Hao X, Yan M, Yao M, Ge C, et al. (2010) Cancer stem/progenitor cells are highly enriched in CD133+CD44+ population in hepatocellular carcinoma. Int J Cancer 126: 2067–2078. 10.1002/ijc.24868 [DOI] [PubMed] [Google Scholar]
  • 4.Yoon SK (2012) The biology of cancer stem cells and its clinical implication in hepatocellular carcinoma. Gut Liver 6: 29–40. 10.5009/gnl.2012.6.1.29 [DOI] [PMC free article] [PubMed] [Google Scholar]
  • 5.Heath JL, Weiss JM, Lavau CP, Wechsler DS (2013) Iron deprivation in cancer—potential therapeutic implications. Nutrients 5: 2836–2859. 10.3390/nu5082836 [DOI] [PMC free article] [PubMed] [Google Scholar]
  • 6.Torti SV, Torti FM (2013) Iron and cancer: more ore to be mined. Nat Rev Cancer 13: 342–355. 10.1038/nrc3495 [DOI] [PMC free article] [PubMed] [Google Scholar]
  • 7.Tirnitz-Parker JE, Glanfield A, Olynyk JK, Ramm GA (2013) Iron and hepatic carcinogenesis. Crit Rev Oncog 18: 391–407. 10.1615/critrevoncog.2013007759 [DOI] [PubMed] [Google Scholar]
  • 8.Raggi C, Gammella E, Correnti M, Buratti P, Forti E, et al. (2017) Dysregulation of Iron Metabolism in Cholangiocarcinoma Stem-like Cells. Sci Rep 7: 17667 10.1038/s41598-017-17804-1 [DOI] [PMC free article] [PubMed] [Google Scholar]
  • 9.Levy JE, Jin O, Fujiwara Y, Kuo F, Andrews NC (1999) Transferrin receptor is necessary for development of erythrocytes and the nervous system. Nat Genet 21: 396–399. 10.1038/7727 [DOI] [PubMed] [Google Scholar]
  • 10.Hentze MW, Muckenthaler MU, Andrews NC (2004) Balancing acts: molecular control of mammalian iron metabolism. Cell 117: 285–297. 10.1016/s0092-8674(04)00343-5 [DOI] [PubMed] [Google Scholar]
  • 11.Jeong SM, Hwang S, Seong RH (2016) Transferrin receptor regulates pancreatic cancer growth by modulating mitochondrial respiration and ROS generation. Biochem Biophys Res Commun 471: 373–379. 10.1016/j.bbrc.2016.02.023 [DOI] [PubMed] [Google Scholar]
  • 12.Buas MF, Rho JH, Chai X, Zhang Y, Lampe PD, et al. (2015) Candidate early detection protein biomarkers for ER+/PR+ invasive ductal breast carcinoma identified using pre-clinical plasma from the WHI observational study. Breast Cancer Res Treat 153: 445–454. 10.1007/s10549-015-3554-5 [DOI] [PMC free article] [PubMed] [Google Scholar]
  • 13.Sorrentino P, D’Angelo S, Ferbo U, Micheli P, Bracigliano A, et al. (2009) Liver iron excess in patients with hepatocellular carcinoma developed on non-alcoholic steato-hepatitis. J Hepatol 50: 351–357. 10.1016/j.jhep.2008.09.011 [DOI] [PubMed] [Google Scholar]
  • 14.Kindrat I, Tryndyak V, de Conti A, Shpyleva S, Mudalige TK, et al. (2016) MicroRNA-152-mediated dysregulation of hepatic transferrin receptor 1 in liver carcinogenesis. Oncotarget 7: 1276–1287. 10.18632/oncotarget.6004 [DOI] [PMC free article] [PubMed] [Google Scholar]
  • 15.Tang Z, Li C, Kang B, Gao G, Li C, et al. (2017) GEPIA: a web server for cancer and normal gene expression profiling and interactive analyses. Nucleic Acids Res 45: W98–W102. 10.1093/nar/gkx247 [DOI] [PMC free article] [PubMed] [Google Scholar]
  • 16.Ablett MP, Singh JK, Clarke RB (2012) Stem cells in breast tumours: are they ready for the clinic? Eur J Cancer 48: 2104–2116. 10.1016/j.ejca.2012.03.019 [DOI] [PubMed] [Google Scholar]
  • 17.Tominaga K, Shimamura T, Kimura N, Murayama T, Matsubara D, et al. (2017) Addiction to the IGF2-ID1-IGF2 circuit for maintenance of the breast cancer stem-like cells. Oncogene 36: 1276–1286. 10.1038/onc.2016.293 [DOI] [PMC free article] [PubMed] [Google Scholar]
  • 18.Ma S, Chan KW, Hu L, Lee TK, Wo JY, et al. (2007) Identification and characterization of tumorigenic liver cancer stem/progenitor cells. Gastroenterology 132: 2542–2556. 10.1053/j.gastro.2007.04.025 [DOI] [PubMed] [Google Scholar]
  • 19.Ma S, Tang KH, Chan YP, Lee TK, Kwan PS, et al. (2010) miR-130b Promotes CD133(+) liver tumor-initiating cell growth and self-renewal via tumor protein 53-induced nuclear protein 1. Cell Stem Cell 7: 694–707. 10.1016/j.stem.2010.11.010 [DOI] [PubMed] [Google Scholar]
  • 20.Dhar D, Antonucci L, Nakagawa H, Kim JY, Glitzner E, et al. (2018) Liver Cancer Initiation Requires p53 Inhibition by CD44-Enhanced Growth Factor Signaling. Cancer Cell 33: 1061–1077. 10.1016/j.ccell.2018.05.003 [DOI] [PMC free article] [PubMed] [Google Scholar]
  • 21.Lee TK, Castilho A, Cheung VC, Tang KH, Ma S, et al. (2011) CD24(+) liver tumor-initiating cells drive self-renewal and tumor initiation through STAT3-mediated NANOG regulation. Cell Stem Cell 9: 50–63. 10.1016/j.stem.2011.06.005 [DOI] [PubMed] [Google Scholar]
  • 22.Weston C, Klobusicky J, Weston J, Connor J, Toms SA, et al. (2016) Aberrations in the Iron Regulatory Gene Signature Are Associated with Decreased Survival in Diffuse Infiltrating Gliomas. PLoS One 11: e166593 10.1371/journal.pone.0166593 [DOI] [PMC free article] [PubMed] [Google Scholar]
  • 23.Kukulj S, Jaganjac M, Boranic M, Krizanac S, Santic Z, et al. (2010) Altered iron metabolism, inflammation, transferrin receptors, and ferritin expression in non-small-cell lung cancer. Med Oncol 27: 268–277. 10.1007/s12032-009-9203-2 [DOI] [PubMed] [Google Scholar]
  • 24.Camp ER, Wang C, Little EC, Watson PM, Pirollo KF, et al. (2013) Transferrin receptor targeting nanomedicine delivering wild-type p53 gene sensitizes pancreatic cancer to gemcitabine therapy. Cancer Gene Ther 20: 222–228. 10.1038/cgt.2013.9 [DOI] [PMC free article] [PubMed] [Google Scholar]
  • 25.Liu P, He K, Song H, Ma Z, Yin W, et al. (2016) Deferoxamine-induced increase in the intracellular iron levels in highly aggressive breast cancer cells leads to increased cell migration by enhancing TNF-alpha-dependent NF-kappaB signaling and TGF-beta signaling. J Inorg Biochem 160: 40–48. 10.1016/j.jinorgbio.2016.04.014 [DOI] [PubMed] [Google Scholar]
  • 26.Paul BT, Manz DH, Torti FM, Torti SV (2017) Mitochondria and Iron: current questions. Expert Rev Hematol 10: 65–79. 10.1080/17474086.2016.1268047 [DOI] [PMC free article] [PubMed] [Google Scholar]
  • 27.Winterbourn CC (1995) Toxicity of iron and hydrogen peroxide: the Fenton reaction. Toxicol Lett 82–83: 969–974. 10.1016/0378-4274(95)03532-x [DOI] [PubMed] [Google Scholar]
  • 28.Chanvorachote P, Luanpitpong S (2016) Iron induces cancer stem cells and aggressive phenotypes in human lung cancer cells. Am J Physiol Cell Physiol 310: C728–C739. 10.1152/ajpcell.00322.2015 [DOI] [PubMed] [Google Scholar]
  • 29.Ailles LE, Weissman IL (2007) Cancer stem cells in solid tumors. Curr Opin Biotechnol 18: 460–466. 10.1016/j.copbio.2007.10.007 [DOI] [PubMed] [Google Scholar]
  • 30.Quail DF, Joyce JA (2013) Microenvironmental regulation of tumor progression and metastasis. Nat Med 19: 1423–1437. 10.1038/nm.3394 [DOI] [PMC free article] [PubMed] [Google Scholar]
  • 31.Chen Y, Zhang S, Wang X, Guo W, Wang L, et al. (2015) Disordered signaling governing ferroportin transcription favors breast cancer growth. Cell Signal 27: 168–176. 10.1016/j.cellsig.2014.11.002 [DOI] [PubMed] [Google Scholar]
  • 32.Tesfay L, Clausen KA, Kim JW, Hegde P, Wang X, et al. (2015) Hepcidin regulation in prostate and its disruption in prostate cancer. Cancer Res 75: 2254–2263. 10.1158/0008-5472.CAN-14-2465 [DOI] [PMC free article] [PubMed] [Google Scholar]
  • 33.Lobello N, Biamonte F, Pisanu ME, Faniello MC, Jakopin Z, et al. (2016) Ferritin heavy chain is a negative regulator of ovarian cancer stem cell expansion and epithelial to mesenchymal transition. Oncotarget 7: 62019–62033. 10.18632/oncotarget.11495 [DOI] [PMC free article] [PubMed] [Google Scholar]
  • 34.Pinnix ZK, Miller LD, Wang W, D’Agostino RJ, Kute T, et al. (2010) Ferroportin and iron regulation in breast cancer progression and prognosis. Sci Transl Med 2: 43r–56r. 10.1126/scisignal.3001127 [DOI] [PMC free article] [PubMed] [Google Scholar]
  • 35.Yang WS, Stockwell BR (2016) Ferroptosis: Death by Lipid Peroxidation. Trends Cell Biol 26: 165–176. 10.1016/j.tcb.2015.10.014 [DOI] [PMC free article] [PubMed] [Google Scholar]
  • 36.Hentze MW, Muckenthaler MU, Galy B, Camaschella C (2010) Two to tango: regulation of Mammalian iron metabolism. Cell 142: 24–38. 10.1016/j.cell.2010.06.028 [DOI] [PubMed] [Google Scholar]
  • 37.Chung-man HJ, Zheng S, Comhair SA, Farver C, Erzurum SC (2001) Differential expression of manganese superoxide dismutase and catalase in lung cancer. Cancer Res 61: 8578–8585. [PubMed] [Google Scholar]
  • 38.Haigis MC, Deng CX, Finley LW, Kim HS, Gius D (2012) SIRT3 is a mitochondrial tumor suppressor: a scientific tale that connects aberrant cellular ROS, the Warburg effect, and carcinogenesis. Cancer Res 72: 2468–2472. 10.1158/0008-5472.CAN-11-3633 [DOI] [PMC free article] [PubMed] [Google Scholar]
  • 39.Ho MM, Ng AV, Lam S, Hung JY (2007) Side population in human lung cancer cell lines and tumors is enriched with stem-like cancer cells. Cancer Res 67: 4827–4833. 10.1158/0008-5472.CAN-06-3557 [DOI] [PubMed] [Google Scholar]

Decision Letter 0

Gianpaolo Papaccio

8 Nov 2020

PONE-D-20-32299

Transferrin receptor regulates malignancies and stemness of hepatocellular carcinoma derived cancer stem-like cells via affecting iron accumulation

PLOS ONE

Dear Dr. Zhao,

Thank you for submitting your manuscript to PLOS ONE. After careful consideration, we feel that it has merit but does not fully meet PLOS ONE’s publication criteria as it currently stands. Therefore, we invite you to submit a revised version of the manuscript that addresses the points raised during the review process.

==============================

This manuscript is affected by several flaws and mainly by the lack of novelty of the majority of the findings. Regarding the new data they must be better analysed and interpreted. Moreover several other critical points, highlighted by the two referees in their comments, must be taken into consideration and need adequate answers. Lastly English that is considerably substandard, needs to be completely revised by a native English speaker expert in scientific English. The Authors must answer point by point to each criticism raised by the referees in their rebuttal letter, highlighting in red all the amendments made in the text, when submitting their revised version.

==============================

Please submit your revised manuscript by Dec 17 2020 11:59PM. If you will need more time than this to complete your revisions, please reply to this message or contact the journal office at plosone@plos.org. When you're ready to submit your revision, log on to https://www.editorialmanager.com/pone/ and select the 'Submissions Needing Revision' folder to locate your manuscript file.

Please include the following items when submitting your revised manuscript:

  • A rebuttal letter that responds to each point raised by the academic editor and reviewer(s). You should upload this letter as a separate file labeled 'Response to Reviewers'.

  • A marked-up copy of your manuscript that highlights changes made to the original version. You should upload this as a separate file labeled 'Revised Manuscript with Track Changes'.

  • An unmarked version of your revised paper without tracked changes. You should upload this as a separate file labeled 'Manuscript'.

If you would like to make changes to your financial disclosure, please include your updated statement in your cover letter. Guidelines for resubmitting your figure files are available below the reviewer comments at the end of this letter.

If applicable, we recommend that you deposit your laboratory protocols in protocols.io to enhance the reproducibility of your results. Protocols.io assigns your protocol its own identifier (DOI) so that it can be cited independently in the future. For instructions see: http://journals.plos.org/plosone/s/submission-guidelines#loc-laboratory-protocols

We look forward to receiving your revised manuscript.

Kind regards,

Gianpaolo Papaccio, M.D., Ph.D.

Academic Editor

PLOS ONE

Journal Requirements:

When submitting your revision, we need you to address these additional requirements.

1. Please ensure that your manuscript meets PLOS ONE's style requirements, including those for file naming. The PLOS ONE style templates can be found at

https://journals.plos.org/plosone/s/file?id=wjVg/PLOSOne_formatting_sample_main_body.pdf and

https://journals.plos.org/plosone/s/file?id=ba62/PLOSOne_formatting_sample_title_authors_affiliations.pdf

2. Please provide additional information about each of the cell lines used in this work, including the source and any quality control testing procedures (authentication, characterisation, and mycoplasma testing). For more information, please see http://journals.plos.org/plosone/s/submission-guidelines#loc-cell-lines.

3. In the Methods section, please provide the source, product number and any lot numbers of the primary antibodies purchased for your study.

4. Please note that PLOS does not permit references to “data not shown.” Authors should provide the relevant data within the manuscript, the Supporting Information files, or in a public repository. If the data are not a core part of the research study being presented, we ask that authors remove any references to these data.

5. To comply with PLOS ONE submission guidelines, in your Methods section, please provide additional information regarding your statistical analyses, including the version of the software used in the analyses. For more information on PLOS ONE's expectations for statistical reporting, please see https://journals.plos.org/plosone/s/submission-guidelines.#loc-statistical-reporting.

6. At this time, we ask that you please provide scale bars on the microscopy images presented in Figure 2, 3, 4, 5 and 7 and refer to the scale bar in the corresponding Figure legend.

7.Thank you for stating the following in the Funding statement Section of your manuscript:

[This work was supported by Young Scientists Fund of the National Natural Science Foundation

of China (Grant No. 81803994), General Program of National Natural Science Foundation of China

(Grant No. 81774284), International Cooperation Project of Sichuan Science and Technology

Department (Grant No. 2019YFH0152) and Science and Technology Developmental Foundation of

Chengdu University of TCM (Grant No. QNXZ2019022)]

We note that you have provided funding information that is not currently declared in your Funding Statement. However, funding information should not appear in the Acknowledgments section or other areas of your manuscript. We will only publish funding information present in the Funding Statement section of the online submission form.

Please remove any funding-related text from the manuscript and let us know how you would like to update your Funding Statement. Currently, your Funding Statement reads as follows:

 [The funders had no role in study design, data collection and analysis, decision to publish, or preparation of the manuscript.]

Please include your amended statements within your cover letter; we will change the online submission form on your behalf.

8.PLOS ONE now requires that authors provide the original uncropped and unadjusted images underlying all blot or gel results reported in a submission’s figures or Supporting Information files. This policy and the journal’s other requirements for blot/gel reporting and figure preparation are described in detail at https://journals.plos.org/plosone/s/figures#loc-blot-and-gel-reporting-requirements and https://journals.plos.org/plosone/s/figures#loc-preparing-figures-from-image-files. When you submit your revised manuscript, please ensure that your figures adhere fully to these guidelines and provide the original underlying images for all blot or gel data reported in your submission. See the following link for instructions on providing the original image data: https://journals.plos.org/plosone/s/figures#loc-original-images-for-blots-and-gels.

In your cover letter, please note whether your blot/gel image data are in Supporting Information or posted at a public data repository, provide the repository URL if relevant, and provide specific details as to which raw blot/gel images, if any, are not available. Email us at plosone@plos.org if you have any questions.

9. PLOS requires an ORCID iD for the corresponding author in Editorial Manager on papers submitted after December 6th, 2016. Please ensure that you have an ORCID iD and that it is validated in Editorial Manager. To do this, go to ‘Update my Information’ (in the upper left-hand corner of the main menu), and click on the Fetch/Validate link next to the ORCID field. This will take you to the ORCID site and allow you to create a new iD or authenticate a pre-existing iD in Editorial Manager. Please see the following video for instructions on linking an ORCID iD to your Editorial Manager account: https://www.youtube.com/watch?v=_xcclfuvtxQ

[Note: HTML markup is below. Please do not edit.]

Reviewers' comments:

Reviewer's Responses to Questions

Comments to the Author

1. Is the manuscript technically sound, and do the data support the conclusions?

The manuscript must describe a technically sound piece of scientific research with data that supports the conclusions. Experiments must have been conducted rigorously, with appropriate controls, replication, and sample sizes. The conclusions must be drawn appropriately based on the data presented.

Reviewer #1: Partly

Reviewer #2: Yes

**********

2. Has the statistical analysis been performed appropriately and rigorously?

Reviewer #1: I Don't Know

Reviewer #2: Yes

**********

3. Have the authors made all data underlying the findings in their manuscript fully available?

The PLOS Data policy requires authors to make all data underlying the findings described in their manuscript fully available without restriction, with rare exception (please refer to the Data Availability Statement in the manuscript PDF file). The data should be provided as part of the manuscript or its supporting information, or deposited to a public repository. For example, in addition to summary statistics, the data points behind means, medians and variance measures should be available. If there are restrictions on publicly sharing data—e.g. participant privacy or use of data from a third party—those must be specified.

Reviewer #1: Yes

Reviewer #2: Yes

**********

4. Is the manuscript presented in an intelligible fashion and written in standard English?

PLOS ONE does not copyedit accepted manuscripts, so the language in submitted articles must be clear, correct, and unambiguous. Any typographical or grammatical errors should be corrected at revision, so please note any specific errors here.

Reviewer #1: No

Reviewer #2: No

**********

5. Review Comments to the Author

Please use the space provided to explain your answers to the questions above. You may also include additional comments for the author, including concerns about dual publication, research ethics, or publication ethics. (Please upload your review as an attachment if it exceeds 20,000 characters)

Reviewer #1: In this manuscript the Authors are investigating about the role of transferrin receptor 1 (TFR1) in cancer stem cells (CSCs) from hepatocellular carcinoma. They firstly used patient’s database to show the correlation between TRF1 expression and disease overall survival. Then they showed that TRF1 is overexpressed on CSCs. Knocking down TRF1 results in reduce spheroids formation, cell cycle alteration, reduced colony formation. Moreover, TRF1 knockdown CSCs contain less iron and are resistance to ferroptosis. The work is meaningful in principle, however there are few concerns that need to be addressed as follows:

1. The quality of the English language is poor and the manuscript need a deep revision by a native English speaker.

2. The role of TRF1 in cancer and especially in liver cancer is well documented, the novelty of this work is represented mainly by the role of TRF1 in CSCs. The Authors should point this out more clearly in the manuscript.

3. The Authors state that TRF1 “sensitize” CSCs to erastin; this concept is misleading as TRF1 is normally expressed by CSCs and being TRF1 the major iron transporter is it expected that its knockdown will result in resistance to ferroptosis. All the experiments should be considered as a validation of the role of TRF1 in iron transport in CSCs.

4. One important question regarding CSCs remain unanswered: besides reducing viability does TRF1 knockdown reduce stemness? Even a simple immunoblot with CD44 and CD133 on shTRF1 cells will give at least a preliminary answer.

Reviewer #2: The Authors investigated the expression of transferrin receptor (TFR1) and ferroportin (FPN), two iron importers, and an upstream regulator, iron regulatory protein 2 (IRP2), in liver hepatocellular carcinoma (LIHC) and related CSCs.

The manuscript is very interesting, but there are some points that need to be clarified.

In M&M the authors must indicate what is the passage of spheres used for experiments.

For cell cycle evaluation,the authors must report the software of analysis.

Regarding soft agar, the authors must explain how they detected the colonies. Moreover, how can the authors know that the sphere consists of 50 cells? In my opinion, the authors should evaluate the size.

In figure 2A, the Authors must add the scale bars. The blots showed in Figure 2C must be changed, they are out of focus. Moreover, these results must be better explained in Results Section. It is unclear what is the passage of culture where it has been evaluated the stemness.

In Figure 3B, please change the blots. In Results section, the Authors must make more organic the data regarding cell cycle, indicating, for example, the percentage of cells in each phase.

Also in the case of invasive capacity and colony forming activity, the authors should better describe the results with percentages and differences between shScramble and shTRF.

In Figure 3A, C and D, add the scale bars.

The results showed in figure 4A are unclear. In my opinion, transfected cells showed low levels of iron compared to non transfected cells. In Results section, it is reported there are no differences. Please clarify.

In figure 5A, please add the scale bars. Moreover, cell viability results must be more organic and the authors should stress the differences adding the percentage in text.

In figure 7A, please add the scale bars. Also here, the authors must rewrite the results regarding cell viability and cell cycle, highlighting the differences with percentages.

In addition, the authors should evaluate the stemness in trasfected cells.

In conclusion, the authors should rewrite the results pointing on better the data and the differences among each experimental group. The Discussion Section must be revised and also here, the authors must stress the novelty and limitation of study and not discuss papers already published.

**********

6. PLOS authors have the option to publish the peer review history of their article (what does this mean?). If published, this will include your full peer review and any attached files.

If you choose “no”, your identity will remain anonymous but your review may still be made public.

Do you want your identity to be public for this peer review? For information about this choice, including consent withdrawal, please see our Privacy Policy.

Reviewer #1: No

Reviewer #2: No

[NOTE: If reviewer comments were submitted as an attachment file, they will be attached to this email and accessible via the submission site. Please log into your account, locate the manuscript record, and check for the action link "View Attachments". If this link does not appear, there are no attachment files.]

While revising your submission, please upload your figure files to the Preflight Analysis and Conversion Engine (PACE) digital diagnostic tool, https://pacev2.apexcovantage.com/. PACE helps ensure that figures meet PLOS requirements. To use PACE, you must first register as a user. Registration is free. Then, login and navigate to the UPLOAD tab, where you will find detailed instructions on how to use the tool. If you encounter any issues or have any questions when using PACE, please email PLOS at figures@plos.org. Please note that Supporting Information files do not need this step.

PLoS One. 2020 Dec 22;15(12):e0243812. doi: 10.1371/journal.pone.0243812.r002

Author response to Decision Letter 0


20 Nov 2020

When submitting your revision, we need you to address these additional requirements.

1. Please ensure that your manuscript meets PLOS ONE's style requirements, including those for file naming. The PLOS ONE style templates can be found at

https://journals.plos.org/plosone/s/file?id=wjVg/PLOSOne_formatting_sample_main_body.pdf and

https://journals.plos.org/plosone/s/file?id=ba62/PLOSOne_formatting_sample_title_authors_affiliations.pdf

Answer: We have confirmed that this manuscript meets the style requirements of PLOS ONE.

2. Please provide additional information about each of the cell lines used in this work, including the source and any quality control testing procedures (authentication, characterisation, and mycoplasma testing). For more information, please see http://journals.plos.org/plosone/s/submission-guidelines#loc-cell-lines.

Answer: The description of the cell lines was added to the Materials and methods section as follows:

“Cell culture

The hepatocellular carcinoma cell line Huh-7 was obtained from the Japanese Cell Research Bank (catalogue no.: JCRB0403), and SK-HEP-1 was obtained from the American Type Culture Collection (ATCC; Manassas, VA, USA; cat. No.: ATCC®HTB-52TM) and stored in our laboratory. These cells were incubated in Dulbecco Modified Eagle Medium-F12 (DMEM/F12; Life Technologies, Grand Island, NY, USA) without 10% foetal bovine serum (FBS; Sigma Chemical Co., St. Louis, MO) supplemented with 2% B-27 (Life Technologies, Grand Island, NY, USA), 20 ng/ml of epidermal growth factor (EGF) and 10 ng/ml of fibroblast growth factor-basic (bFGF; PeproTech, Rocky Hill, NJ, USA). The cells were passaged every 12 days and replated in SFM.”

3. In the Methods section, please provide the source, product number and any lot numbers of the primary antibodies purchased for your study.

Answer: The catalogue number has been added to the Material and methods section as follows:

“Western blotting

Total protein was prepared using RIPA buffer (Thermo Scientific, Waltham, MA, USA) following the manufacturer’s instructions. Next, 20 µg of protein was fractionated using Tris-glycine gels and transferred to PVDF membranes. The PVDF membranes were blocked in 5% milk/TBS buffer at room temperature for 60 min and then incubated for 1 h with primary antibodies at a dilution of 1:1000. The following primary antibodies were purchased from Abcam (Cambridge, England): CD24 (cat. No.: ab202073), CD44 (cat. No.: ab18668), CD133 (cat. No.: ab216323), β-actin (cat. No.: ab8226) and TFR1 (cat. No.: ab214039). After washing three times with PBS-T (containing 0.1% Tween-20), the HRP-conjugated secondary antibody (cat. No.: ab6721) was incubated with the PVDF membranes for another 1 h. The blots were developed using PierceTM ECL Western Blotting Substrate (Thermo Scientific, Waltham, MA, USA) according to the manufacturer’s instructions.”

4. Please note that PLOS does not permit references to “data not shown.” Authors should provide the relevant data within the manuscript, the Supporting Information files, or in a public repository. If the data are not a core part of the research study being presented, we ask that authors remove any references to these data.

Answer: We have modified the text accordingly.

5. To comply with PLOS ONE submission guidelines, in your Methods section, please provide additional information regarding your statistical analyses, including the version of the software used in the analyses. For more information on PLOS ONE's expectations for statistical reporting, please see https://journals.plos.org/plosone/s/submission-guidelines.#loc-statistical-reporting.

Answer: The Statistical analysis section has been modified as follows:

“Statistical analysis

All the results are expressed as the mean ± standard error of the mean (SEM). Differences between two independent groups were evaluated using an unpaired Student’s t test, and differences between multiple groups for one or two variables were evaluated using one-way or two-way ANOVA, respectively, with GraphPad Prism 5 software (GraphPad Software, Inc.). Bonferroni’s post-hoc test was employed after ANOVA to test all pairwise comparisons. A 2-tailed value of P < 0.05 was considered statistically significant.”

6. At this time, we ask that you please provide scale bars on the microscopy images presented in Figure 2, 3, 4, 5 and 7 and refer to the scale bar in the corresponding Figure legend.

Answer: We have added this information.

7.Thank you for stating the following in the Funding statement Section of your manuscript:

[This work was supported by Young Scientists Fund of the National Natural Science Foundation

of China (Grant No. 81803994), General Program of National Natural Science Foundation of China

(Grant No. 81774284), International Cooperation Project of Sichuan Science and Technology

Department (Grant No. 2019YFH0152) and Science and Technology Developmental Foundation of

Chengdu University of TCM (Grant No. QNXZ2019022)]

We note that you have provided funding information that is not currently declared in your Funding Statement. However, funding information should not appear in the Acknowledgments section or other areas of your manuscript. We will only publish funding information present in the Funding Statement section of the online submission form.

Please remove any funding-related text from the manuscript and let us know how you would like to update your Funding Statement. Currently, your Funding Statement reads as follows:

[The funders had no role in study design, data collection and analysis, decision to publish, or preparation of the manuscript.]

Please include your amended statements within your cover letter; we will change the online submission form on your behalf.

Answer: We have included this information in the cover letter.

8.PLOS ONE now requires that authors provide the original uncropped and unadjusted images underlying all blot or gel results reported in a submission’s figures or Supporting Information files. This policy and the journal’s other requirements for blot/gel reporting and figure preparation are described in detail at https://journals.plos.org/plosone/s/figures#loc-blot-and-gel-reporting-requirements and https://journals.plos.org/plosone/s/figures#loc-preparing-figures-from-image-files. When you submit your revised manuscript, please ensure that your figures adhere fully to these guidelines and provide the original underlying images for all blot or gel data reported in your submission. See the following link for instructions on providing the original image data: https://journals.plos.org/plosone/s/figures#loc-original-images-for-blots-and-gels.

In your cover letter, please note whether your blot/gel image data are in Supporting Information or posted at a public data repository, provide the repository URL if relevant, and provide specific details as to which raw blot/gel images, if any, are not available. Email us at plosone@plos.org if you have any questions.

Answer: All the original uncropped and unadjusted images were attached as supporting information.

9. PLOS requires an ORCID iD for the corresponding author in Editorial Manager on papers submitted after December 6th, 2016. Please ensure that you have an ORCID iD and that it is validated in Editorial Manager. To do this, go to ‘Update my Information’ (in the upper left-hand corner of the main menu), and click on the Fetch/Validate link next to the ORCID field. This will take you to the ORCID site and allow you to create a new iD or authenticate a pre-existing iD in Editorial Manager. Please see the following video for instructions on linking an ORCID iD to your Editorial Manager account: https://www.youtube.com/watch?v=_xcclfuvtxQ

Answer: The corresponding author has linked the ORCID ID.

5. Review Comments to the Author

Please use the space provided to explain your answers to the questions above. You may also include additional comments for the author, including concerns about dual publication, research ethics, or publication ethics. (Please upload your review as an attachment if it exceeds 20,000 characters)

Reviewer #1: In this manuscript the Authors are investigating about the role of transferrin receptor 1 (TFR1) in cancer stem cells (CSCs) from hepatocellular carcinoma. They firstly used patient’s database to show the correlation between TRF1 expression and disease overall survival. Then they showed that TRF1 is overexpressed on CSCs. Knocking down TRF1 results in reduce spheroids formation, cell cycle alteration, reduced colony formation. Moreover, TRF1 knockdown CSCs contain less iron and are resistance to ferroptosis. The work is meaningful in principle, however there are few concerns that need to be addressed as follows:

1. The quality of the English language is poor and the manuscript need a deep revision by a native English speaker.

Answer: The language has been edited by American Journal Experts, a professional language editing service.

2. The role of TRF1 in cancer and especially in liver cancer is well documented, the novelty of this work is represented mainly by the role of TRF1 in CSCs. The Authors should point this out more clearly in the manuscript.

Answer: We have included this information in the Introduction section as follows:

Introduction section:

“Transferrin receptor 1 (TFR1) is one of the most crucial proteins for iron uptake and is expressed universally among cell types [9]. Its ligand, transferrin (TF), forms a heterodimer with TFR1 to carry Fe2 for transmembrane transport [10]. TFR1 activity is vital for cancer cells to absorb iron and is deeply involved in tumour onset and progression [11]. In many cancers, TFR1 is significantly dysregulated, and iron uptake is abnormal [12], demonstrating that TFR1 may act as a critical regulator of cancers by affecting iron accumulation. In hepatocellular carcinoma, systemic and intracellular iron homeostasis is altered [6,13] because of the overexpression of TFR1, indicating the critical role of TFR1 in regulating iron homeostasis [14]. Moreover, TFR1 expression is upregulated in cholangiocarcinoma CSCs, and its activity is associated with increased iron uptake [8]. Knockdown of TFR1 expression decreased iron accumulation and stemness marker expression, indicating a critical role for TFR1 in the stem cell compartment mediated by regulating iron accumulation. However, little is known about how TFR1 affects the malignancy and stemness of CSCs in hepatocellular carcinoma.”

3. The Authors state that TRF1 “sensitize” CSCs to erastin; this concept is misleading as TRF1 is normally expressed by CSCs and being TRF1 the major iron transporter is it expected that its knockdown will result in resistance to ferroptosis. All the experiments should be considered as a validation of the role of TRF1 in iron transport in CSCs.

Answer: Thank you for the suggestions. The word “sensitize” is misleading, and we have modified the description of “sensitivity” throughout the manuscript.

4. One important question regarding CSCs remain unanswered: besides reducing viability does TRF1 knockdown reduce stemness? Even a simple immunoblot with CD44 and CD133 on shTRF1 cells will give at least a preliminary answer.

Answer: The identification of decreased stemness after TRF1 knockdown was performed as described in figure 7b .

Reviewer #2: The Authors investigated the expression of transferrin receptor (TFR1) and ferroportin (FPN), two iron importers, and an upstream regulator, iron regulatory protein 2 (IRP2), in liver hepatocellular carcinoma (LIHC) and related CSCs.

The manuscript is very interesting, but there are some points that need to be clarified.

In M&M the authors must indicate what is the passage of spheres used for experiments.

Answer: The passage used for experiments was described as follows:

“CCK-8 assay

Cell viability was determined with the CCK-8 assay. Briefly, for each 96-well plate, 100 spheres from the second passage (>50 μm in diameter) were seeded. After treatment with 0, 0.2 or 0.8 μM erastin for 16 h, 10 μl of freshly prepared CCK-8 solution was added to the cell culture for a 2-h co-incubation. The absorbance was measured at 620 nm.”

“Tumour formation in soft agar

Next, 4×10³ single cells from spheres of the second passage were seeded in serum-free RPMI 1640 medium and dissolved in 0.3% low-melting agarose (Sigma-Aldrich, St. Louis, MO, USA), supplemented with 2% B 27, 10 ng/ml of EGF and 20 ng/ml of bFGF. Cells were grown for 14 days, and colonies were visualised with 5% 4-nitro blue tetrazolium chloride staining, for which >50 cells indicated approximately >50 μm in diameter.”

“shRNA transfection

shRNAs targeting TRF1 (shTRF1-1 and shTRF1-2) were purchased from Sigma-Aldrich. The relative sequences were as follows: shTRF1-1, 5’- CCCAGCAACAAGACCTTAATA-3’; and shTRF1-2, 5’- CCCTTGATGCACAGTTTGAAA-3’. An shRNA with a scrambled sequence (5’- GAAGCTGCCCACCAGATTG-3’) was used as a negative control (shScrambled). For each transfection, 1×10³ spheres from the second passage (>50 μm in diameter) were transferred to a 12-well plate and 0.8 μg of plasmid was mixed with 4 μl of Lipofectamine™ 2000 transfection reagent (Thermo Scientific, Waltham, MA, USA) in 0.5 ml of OptiMEM medium (Thermo Scientific, Waltham, MA, USA); this mixture was then applied to cells for 4 h followed by medium replenishment.”

“Cell cycle analysis

Spheres from the second passage were collected and washed 3 times with pre-chilled PBS. Next, 0.25% trypsin was applied to obtain single cells, which were fixed using 1 ml of 75% ice-cold alcohol for 2 h at 4℃ and washed twice with PBS with the addition of 100 μl of RNase A and 400 μl of propidium iodide (PI) (Sigma-Aldrich Chemical Company, St Louis, MO, USA), followed by incubation for 30 min at room temperature. The stained cells were measured using a FACS LSRII flow cytometer (BD Biosciences, Franklin Lakes, NJ, USA), and data were analysed using the ModFit analysis software program (version 4.0; Verity Software House, Inc., Topsham, ME, USA).”

For cell cycle evaluation, the authors must report the software of analysis.

Answer: The software used to analyse the cell cycle was described as follows:

“Cell cycle analysis

Spheres from the second passage were collected and washed 3 times with pre-chilled PBS. Next, 0.25% trypsin was applied to obtain single cells, which were fixed using 1 ml of 75% ice-cold alcohol for 2 h at 4℃ and washed twice with PBS with the addition of 100 μl of RNase A and 400 μl of propidium iodide (PI) (Sigma-Aldrich Chemical Company, St Louis, MO, USA), followed by incubation for 30 min at room temperature. The stained cells were measured using a FACS LSRII flow cytometer (BD Biosciences, Franklin Lakes, NJ, USA), and data were analysed using the ModFit analysis software program (version 4.0; Verity Software House, Inc., Topsham, ME, USA).”

Regarding soft agar, the authors must explain how they detected the colonies. Moreover, how can the authors know that the sphere consists of 50 cells? In my opinion, the authors should evaluate the size.

Answer: The staining of colonies was described, and colonies approximately >50 µm in diameter were counted.

“Tumour formation in soft agar

Next, 4×10³ single cells from spheres of the second passage were seeded in serum-free RPMI 1640 medium and dissolved in 0.3% low-melting agarose (Sigma-Aldrich, St. Louis, MO, USA), supplemented with 2% B 27, 10 ng/ml of EGF and 20 ng/ml of bFGF. Cells were grown for 14 days, and colonies were visualised with 5% 4-nitro blue tetrazolium chloride staining, for which >50 cells indicated approximately >50 μm in diameter.”

In figure 2A, the Authors must add the scale bars. The blots showed in Figure 2C must be changed, they are out of focus. Moreover, these results must be better explained in Results Section. It is unclear what is the passage of culture where it has been evaluated the stemness.

Answer: Figure 2 has been modified and attached, and the results were modified specifically as follows:

“TFR1 is upregulated in CSCs derived from hepatocellular carcinoma cell lines

To evaluate the role of TFR1 in CSCs derived from hepatocellular carcinoma cell lines, including Huh-7 and SK-HEP-1, we first enriched CSCs by culturing them in serum-free medium. Tumour sphere formation and self-renewal capacity are typical properties of CSCs in vitro [16,17]. Both cell lines formed unattached tumour spheres and exhibited self-renewal capacity (Figure 2A). Compared with relative parental cells, CSCs presented significantly higher expression levels of CD44 and CD133, two stemness markers [18,19,20]. Surprisingly, CD24, a stemness marker of HCC [21], was not different between parental cells and CSCs (Figure 2B). Western blotting confirmed that TFR1 was significantly increased in CSCs derived from relative parental cells (Figure 2C). These results indicated that CSCs derived from HCC presented stemness and upregulated TFR1 protein levels.”

In Figure 3B, please change the blots. In Results section, the Authors must make more organic the data regarding cell cycle, indicating, for example, the percentage of cells in each phase.

Answer: Figure 3B has been modified.

Also in the case of invasive capacity and colony forming activity, the authors should better describe the results with percentages and differences between shScramble and shTRF.

Answer: The results were further described as follows:

“Considering the relatively high endogenous level of TFR1 in both Huh-7- and SK-HEP-1-derived CSCs (Figure 2C), two shRNAs targeting TFR1 mRNA were efficiently introduced into CSCs to knockdown the TFR1 mRNA level (Figure 3A). Compared with the scrambled control group (shScrambled), the TFR1 protein levels in CSCs derived from Huh-7 and SK-HEP-1 cells were significantly downregulated by both shRNAs (Figure 3B), prompting us to transfect mixed shRNAs (shTFR1-1/2). Forty-eight hours after transfection, indicators of malignant behaviours, including cell cycle distribution, invasive capacity and colony formation, were analysed. Consistent with previous reports presenting that TRF1 promotes malignant behaviours in several types of cancers, including breast cancer [22], lung cancer [23], and liver cancer [24], we observed that TFR1downregulation significantly blocked the cell cycle at G1/G0 phase (Figure 3C). The Transwell assay revealed that the number of transferred cells in the TFR1 knockdown group (26.5±1.7 cells/view for Huh-7; 53.5±1.4 cells/view for SK-HEP-1) was significantly less than that in the shScrambled group (122.5±3.8 cells/view for Huh-7; 153.2±16.5 cells/view for SK-HEP-1) (Figure 3D). Expectedly, the colony formation ability was also significantly decreased in CSCs derived from Huh-7 or SK-HEP-1 cells (Figure 3E).”

In Figure 3A, C and D, add the scale bars.

Answer: The amplification is shown in the figures.

The results showed in figure 4A are unclear. In my opinion, transfected cells showed low levels of iron compared to non transfected cells. In Results section, it is reported there are no differences. Please clarify.

Answer: The results of figure 4A were further described as follows:

“TFR1-induced iron accumulation contributes to the promotion of malignant behaviours in triple-negative breast cancer cells [25]. Thus, we confirmed whether TFR1 regulates iron accumulation in CSCs. Expectedly, after cells were transfected with shTFR1-1/2 for 48 h, the iron concentration in CSCs derived from both Huh-7 and SK-HEP-1 cells was markedly decreased compared with that in shScrambled cells (Figure 4A), indicating that TFR1 is essential for iron uptake. Although CSCs expressed high levels of TFR1, no difference in the iron level was observed in CSCs compared with that in parental cells, likely because of the low iron level in the medium. Thus, CSCs and parental cells were treated with 10 μg/ml of ferric ammonium citrate (FAC, iron source; Sigma-Aldrich). As shown in figure 4B, the addition of FAC significantly increased iron accumulation in CSCs derived from both Huh-7 and SK-HEP-1 cells, and the knockdown of TFR1 abolished the effect of FAC addition on the iron level. Next, we measured the levels of the mitochondrial labile iron pool after TFR1 knockdown. Knockdown of TFR1 increased the fluorescence signal of rhodamine B4-[(1,10-phenanthroline-5-yl) aminocarbonyl] benzyl ester (RPA) (figure 4C).”

In figure 5A, please add the scale bars. Moreover, cell viability results must be more organic and the authors should stress the differences adding the percentage in text.

Answer: The amplification of each image was added, and the results were further described as follows:

“Considering that the expression level of TFR1 is tightly associated with ferroptosis, which is dependent on the presence of iron, we next evaluated the effect of TFR1 on ferroptosis in CSCs. To induce ferroptosis, erastin, a widely used ferroptosis inducer, was employed. Spheres derived from both Huh-7 and SK-HEP-1 cells were dissociated by the addition of erastin (figure 5A), and a decrease in cell viability was observed (19.3±5.3% in Huh-7 and 27.2±2.9% in SK-HEP-1 after 0.8-μM erastin treatment; figure 5B). Knockdown of TFR1-1/2 protected spheres against erastin in sphere formation and cell viability (49.1±2.5% in Huh-7 and 56.9±1.5% in SK-HEP-1 after 0.8-μM erastin treatment; figure 5A&B). To further confirm whether TFR1 is critical for erastin-induced ferroptosis in CSCs, deferoxamine mesylate (DFO), an iron chelator, was employed as a ferroptosis inhibitor. The addition of DFO reversed the decrease in cell viability induced by erastin, a finding that was similar to the effect of TFR1 knockdown (figure 5C). Taken together, these data show that TFR1 is critical for erastin-induced ferroptosis in CSCs.”

In figure 7A, please add the scale bars. Also here, the authors must rewrite the results regarding cell viability and cell cycle, highlighting the differences with percentages.

Answer: The amplification of each image was added, and the differences with percentages were described as follows:

“The addition of iron induces the stemness and malignant behaviours of CSCs in human lung cancer cells in an epithelial-to-mesenchymal transition-independent manner without affecting the role of TFR1 [28,29], indicated that TFR1 may regulate the stemness of CSCs by modifying iron accumulation. Knockdown of TFR1 significantly decreased sphere formation (11.5±7.7% vs 67.5±3.1% in Huh-7 CSCs; 13.6±1.5% vs. 94.5±4.1% in SK-HEP-1 CSCs; p<0.05; figure 7a). The addition of FAC obviously reversed the effect of the knockdown of TFR1 on sphere formation that was abolished by the addition of DFO (51.2±4.1% vs. 11.5±7.7% in Huh-7 CSCs; 57.4±1.3% vs. 13.6±1.5% in SK-HEP-1 CSCs; p<0.05; figure 7a). A decrease in CD44 and CD133 also confirmed that the knockdown of TFR1 decreased CSC stemness (figure 7b). We further analysed the cell cycle after TFR1 knockdown using FAC or DFO. The knockdown of TFR1 decreased the number of cells in G1/G0 phase, and the addition of FAC reversed the decrease in G1/G0, which was abolished by the addition of DFO (figure 7c). This result indicates that TFR1 might also regulate cell proliferation by modifying iron accumulation in CSCs.”

In addition, the authors should evaluate the stemness in trasfected cells.

Answer: The stemness was evaluated in figure 7b.

In conclusion, the authors should rewrite the results pointing on better the data and the differences among each experimental group. The Discussion Section must be revised and also here, the authors must stress the novelty and limitation of study and not discuss papers already published.

Answer: The Discussion section has been modified.

Attachment

Submitted filename: response to reviewers.docx

Decision Letter 1

Gianpaolo Papaccio

27 Nov 2020

Transferrin receptor regulates malignancies and the stemness of hepatocellular carcinoma-derived cancer stem-like cells by affecting iron accumulation

PONE-D-20-32299R1

Dear Dr. Zhao,

We’re pleased to inform you that your manuscript has been judged scientifically suitable for publication and will be formally accepted for publication once it meets all outstanding technical requirements.

Within one week, you’ll receive an e-mail detailing the required amendments. When these have been addressed, you’ll receive a formal acceptance letter and your manuscript will be scheduled for publication.

An invoice for payment will follow shortly after the formal acceptance. To ensure an efficient process, please log into Editorial Manager at http://www.editorialmanager.com/pone/, click the 'Update My Information' link at the top of the page, and double check that your user information is up-to-date. If you have any billing related questions, please contact our Author Billing department directly at authorbilling@plos.org.

If your institution or institutions have a press office, please notify them about your upcoming paper to help maximize its impact. If they’ll be preparing press materials, please inform our press team as soon as possible -- no later than 48 hours after receiving the formal acceptance. Your manuscript will remain under strict press embargo until 2 pm Eastern Time on the date of publication. For more information, please contact onepress@plos.org.

Kind regards,

Gianpaolo Papaccio, M.D., Ph.D.

Academic Editor

PLOS ONE

Additional Editor Comments (optional):

Reviewers' comments:

Reviewer's Responses to Questions

Comments to the Author

1. If the authors have adequately addressed your comments raised in a previous round of review and you feel that this manuscript is now acceptable for publication, you may indicate that here to bypass the “Comments to the Author” section, enter your conflict of interest statement in the “Confidential to Editor” section, and submit your "Accept" recommendation.

Reviewer #1: All comments have been addressed

Reviewer #2: All comments have been addressed

**********

2. Is the manuscript technically sound, and do the data support the conclusions?

The manuscript must describe a technically sound piece of scientific research with data that supports the conclusions. Experiments must have been conducted rigorously, with appropriate controls, replication, and sample sizes. The conclusions must be drawn appropriately based on the data presented.

Reviewer #1: Yes

Reviewer #2: Yes

**********

3. Has the statistical analysis been performed appropriately and rigorously?

Reviewer #1: I Don't Know

Reviewer #2: Yes

**********

4. Have the authors made all data underlying the findings in their manuscript fully available?

The PLOS Data policy requires authors to make all data underlying the findings described in their manuscript fully available without restriction, with rare exception (please refer to the Data Availability Statement in the manuscript PDF file). The data should be provided as part of the manuscript or its supporting information, or deposited to a public repository. For example, in addition to summary statistics, the data points behind means, medians and variance measures should be available. If there are restrictions on publicly sharing data—e.g. participant privacy or use of data from a third party—those must be specified.

Reviewer #1: Yes

Reviewer #2: Yes

**********

5. Is the manuscript presented in an intelligible fashion and written in standard English?

PLOS ONE does not copyedit accepted manuscripts, so the language in submitted articles must be clear, correct, and unambiguous. Any typographical or grammatical errors should be corrected at revision, so please note any specific errors here.

Reviewer #1: Yes

Reviewer #2: Yes

**********

6. Review Comments to the Author

Please use the space provided to explain your answers to the questions above. You may also include additional comments for the author, including concerns about dual publication, research ethics, or publication ethics. (Please upload your review as an attachment if it exceeds 20,000 characters)

Reviewer #1: The Authors have addressed all the concerns raised by this reviewer. The Manuscript is now greatly improved.

Reviewer #2: (No Response)

**********

7. PLOS authors have the option to publish the peer review history of their article (what does this mean?). If published, this will include your full peer review and any attached files.

If you choose “no”, your identity will remain anonymous but your review may still be made public.

Do you want your identity to be public for this peer review? For information about this choice, including consent withdrawal, please see our Privacy Policy.

Reviewer #1: No

Reviewer #2: No

Acceptance letter

Gianpaolo Papaccio

10 Dec 2020

PONE-D-20-32299R1

Transferrin receptor regulates malignancies and the stemness of hepatocellular carcinoma-derived cancer stem-like cells by affecting iron accumulation

Dear Dr. Zhao:

I'm pleased to inform you that your manuscript has been deemed suitable for publication in PLOS ONE. Congratulations! Your manuscript is now with our production department.

If your institution or institutions have a press office, please let them know about your upcoming paper now to help maximize its impact. If they'll be preparing press materials, please inform our press team within the next 48 hours. Your manuscript will remain under strict press embargo until 2 pm Eastern Time on the date of publication. For more information please contact onepress@plos.org.

If we can help with anything else, please email us at plosone@plos.org.

Thank you for submitting your work to PLOS ONE and supporting open access.

Kind regards,

PLOS ONE Editorial Office Staff

on behalf of

Prof. Gianpaolo Papaccio

Academic Editor

PLOS ONE


Articles from PLoS ONE are provided here courtesy of PLOS

RESOURCES