The high-gamma-amino butyric acid (GABA)-producing bacterium Levilactobacillus brevis strain NPS-QW 145, along with Streptococcus thermophilus (one of the two starter bacteria used to make yogurt for its proteolytic activity), enhances GABA production in milk. However, a mechanistic understanding of how Levilactobacillus brevis cooperates with S. thermophilus to stimulate GABA production has been lacking. Comparative peptidomic and metatranscriptomic analyses were carried out to unravel the casein and lactose utilization patterns during milk fermentation with the coculture.
KEYWORDS: Levilactobacillus brevis, Streptococcus thermophilus, GABA, coculture ecosystem
ABSTRACT
The high-gamma-amino butyric acid (GABA)-producing bacterium Levilactobacillus brevis strain NPS-QW 145, along with Streptococcus thermophilus (one of the two starter bacteria used to make yogurt for its proteolytic activity), enhances GABA production in milk. However, a mechanistic understanding of how Levilactobacillus brevis cooperates with S. thermophilus to stimulate GABA production has been lacking. Comparative peptidomic and metatranscriptomic analyses were carried out to unravel the casein and lactose utilization patterns during milk fermentation with the coculture. We found that particular peptides hydrolyzed by S. thermophilus ASCC1275 were transported and biodegraded with peptidase in Lb. brevis 145 to meet the growth needs of the latter. In addition, amino acid synthesis and metabolism in Lb. brevis 145 were activated to further support its growth. Glucose, as a result of lactose hydrolysis by S. thermophilus 1275, but not available lactose in milk, was metabolized as the main carbon source by Lb. brevis 145 for ATP production. In the stationary phase, under acidic conditions due to the accumulation of lactic acid produced by S. thermophilus 1275, the expression of genes involved in pyridoxal phosphate (coenzyme of glutamic acid decarboxylase) metabolism and glutamic acid decarboxylase (Gad) in Lb. brevis 145 was induced for GABA production.
SIGNIFICANCE A huge market for GABA-rich milk as a dietary therapy for the management of hypertension is anticipated. The novelty of this work lies in applying peptide profiles supported by metatranscriptomics to elucidate (i) the pattern of casein hydrolysis by S. thermophilus 1275, (ii) the supply of peptides and glucose by S. thermophilus 1275 to Lb. brevis 145, (iii) the transportation of peptides in Lb. brevis and the degradation of peptides by this organism, which was reported to be nonproteolytic, and (iv) GABA production by Lb. brevis 145 under acidic conditions. Based on the widely reported contribution of lactic acid bacteria (LAB) and GABA to human health, the elucidation of interactions between the two groups of bacterial communities in the production of GABA-rich milk is important for promoting the development of functional dairy food and may provide new insight into the development of industrial GABA production.
INTRODUCTION
Gamma-amino butyric acid (GABA) is a 4-carbon nonprotein amino acid that acts as the major inhibitory neurotransmitter of the central nervous system (1). GABA and GABA-rich food are widely reported to exhibit multiple pharmaceutical properties, such as antihypertensive and antidepressive effects (2, 3). Nowadays, manufacturers prefer to add probiotic bacteria together with yogurt bacteria (Streptococcus thermophilus and Lactobacillus delbrueckii subsp. bulgaricus) to improve the functionality of dairy foods. The consumption of milk containing a physiological dose of GABA may be a promising way to help hypertensive patients improve their blood pressure.
Levilactobacillus brevis strains, such as Lb. brevis RK03 (4), Lb. brevis NCL912 (5), Lb. brevis HYE1 (6), and Lb. brevis 145, hold promise for GABA production (7). In all the completely sequenced Lb. brevis strains, two functionally distinct Gad (glutamic acid decarboxylase) operons and one intact Gad operon were observed and are suggested to have the ability to synthesize GABA (8). However, no genes encoding cell envelope proteinases have been found in the genomes of most Lb. brevis strains (hence, they are nonproteolytic) (9). These Lb. brevis strains may not be able to survive or even ferment milk. Surprisingly, S. thermophilus has been found to improve the viability of Lb. brevis 145 cells and the GABA biosynthesis ability of Lb. brevis 145 during milk fermentation (10). To date, studies of interactions among probiotic bacteria and the lactic acid starter used by the dairy industry have been restricted to investigating the influence on mutual bacterial growth by the plate-counting method, or growth kinetics (11); no studies have been carried out to investigate the association of yogurt bacteria and GABA-producing probiotic bacteria for GABA production at the molecular and regulatory levels.
Massive transcriptomics provides a more dynamic and functional view of microbial activity under particular conditions by accumulating RNA expression profiles. For example, metatranscriptome analysis helped reveal the breakdown of the cheese matrix and the sensory properties created by fungal strains Penicillium camemberti and Geotrichum candidum in ripened Camembert-type cheese (12) and whole-ecosystem gene expression of the microflora in spontaneous wheat and spelt sourdough fermentations (13). In addition, mixed-culture growth of S. thermophilus and L. delbrueckii subsp. bulgaricus has been established on the basis of in-depth RNA microarray analysis, which revealed that amino acids were supplied by L. delbrueckii subsp. bulgaricus for both organisms while S. thermophilus provided L. delbrueckii subsp. bulgaricus with organic acids (14). However, RNA expression was not able to elucidate the casein hydrolysis pattern and the peptides utilized by bacteria in general. With the development of peptidomics, peptide profiling by liquid chromatography-tandem mass spectrometry (LC–MS-MS) has revealed that bacteria in general have the ability to alter the composition of the peptide fraction during fermentation (15) and that the casein cleavage pattern is strain dependent (16). This suggested that comparative peptidomics is a remarkable method for analyzing the dairy proteins digested by microbes. In this study, the two different omic techniques were first combined and applied to enable understanding of nutrient utilization and RNA expression regulation in the cocultivation of Lb. brevis 145 and S. thermophilus 1275 during fermentation to enrich GABA content in milk.
In the present study, we aimed to examine (i) the regulatory responses in the cocultivation of Lb. brevis and S. thermophilus during milk fermentation, with the goal of increasing GABA production in milk, and (ii) the breakdown of proteins and lactose and the patterns of transportation and utilization of carbon and nitrogen sources by the two organisms during milk fermentation.
RESULTS
GABA production, pH, utilization of lactose, glucose, and galactose, and lactic acid production.
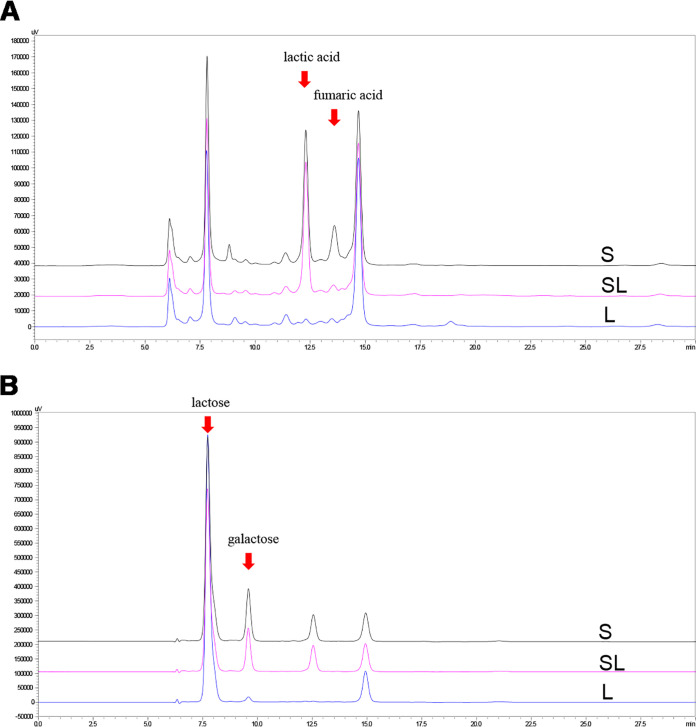
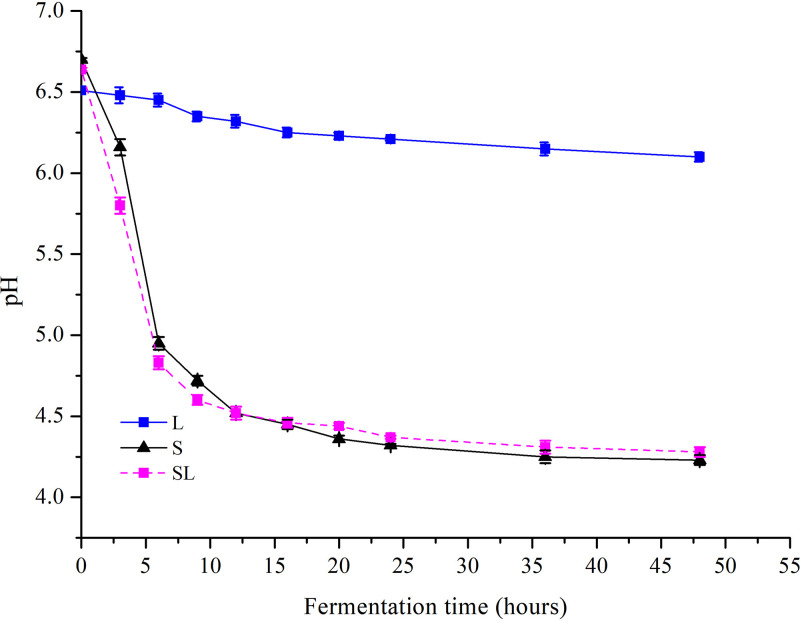
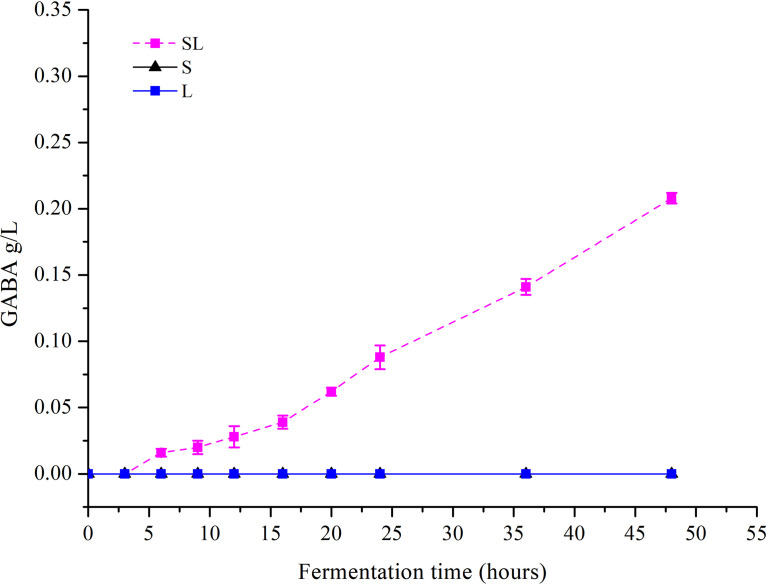
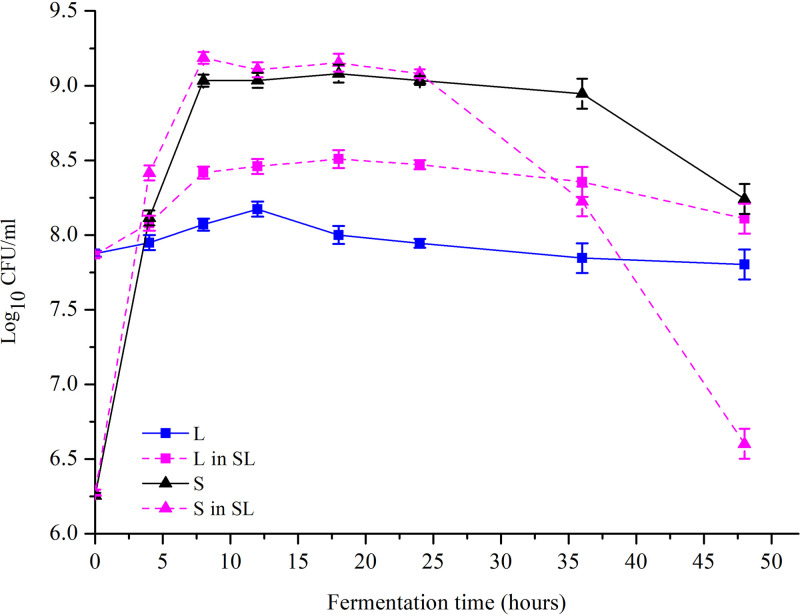
No changes in lactic acid production, lactose utilization, pH, or GABA production were observed in the Lb. brevis 145 monoculture (L) group during milk fermentation (Fig. 1A and B; see also Fig. 3 and 4), and the number of viable Lb. brevis 145 cells in the L group decreased as the fermentation time lengthened (Fig. 2). In the S. thermophilus 1275 monoculture (S) group, during the first 10 h of fermentation, lactose was hydrolyzed into glucose and galactose, a large amount of lactic acid was produced, the pH in fermented milk dropped to 4.5 (Fig. 3), and viable cell counts showed exponential growth (Fig. 2). There was no GABA yield after 48 h of fermentation (Fig. 4). In the coculture (SL) group, the pH dropped to 4.4 at the first 10 h fermentation, the numbers of viable Lb. brevis 145 and S. thermophilus 1275 cells were both increased during 24 h of fermentation (Fig. 2), and GABA concentration was significantly increased during the late stage of fermentation (Fig. 4). The utilization of lactose and galactose and the production of lactic acid in the SL group were not influenced in comparison with those in the S group (Fig. 1). Moreover, glucose released from lactose was undetectable in all the samples (Fig. 1). The fermentation time point of 18 h (log phase of GABA production) was selected for carrying out further research on the regulation of GABA production and lactose and casein utilization by S. thermophilus 1275 and Lb. brevis 145.
FIG 1.
Metabolic changes in monocultures and coculture at 24 h of milk fermentation. (A) Organic acid production; (B) residual sugars. Abbreviations: L, Lb. brevis 145 monoculture; S, S. thermophilus 1275 monoculture; SL, cocultivation of S. thermophilus 1275 and Lb. brevis 145.
FIG 3.
pH changes in different cultures during 48 h of milk fermentation.
FIG 4.
GABA production in different cultures during 48 h of milk fermentation.
FIG 2.
Viable cell counts of S. thermophilus 1275 and Lb. brevis 145 in different cultures during 48 h of milk fermentation. L in SL, viable cell counts of Lb. brevis 145 in the coculture of S. thermophilus 1275 and Lb. brevis 145; S in SL, viable cell counts of S. thermophilus in the coculture of S. thermophilus 1275 and Lb. brevis 145.
Peptide analysis.
The fermented milk samples at 18 h from the S and SL groups were analyzed by LC–MS-MS. A total of 755 and 684 peptides from casein were identified in the S and SL groups, respectively (Fig. 5). The peptides identified originated from αS1-CN, αS2-CN, β-CN, κ-CN, and the whey proteins α-lactalbumin (α-La) and β-lactoglobulin (β-Lg) (see Table S1 in the supplemental material). The sequences of peptides ranged from 5 to 32 amino acids (Table S1).
FIG 5.
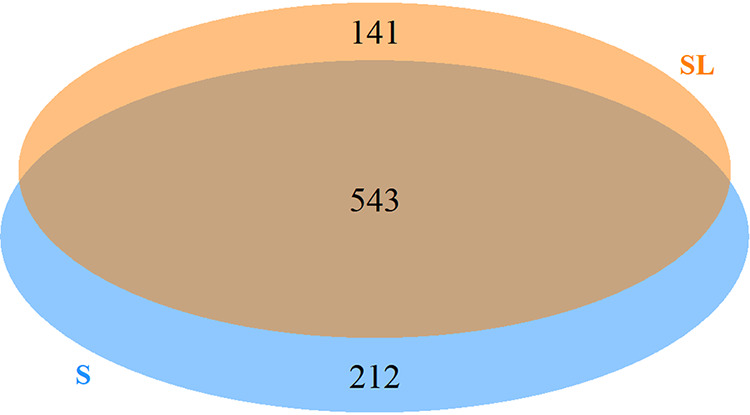
Venn diagram of the numbers of peptides identified in the S and SL groups after 18 h of milk fermentation.
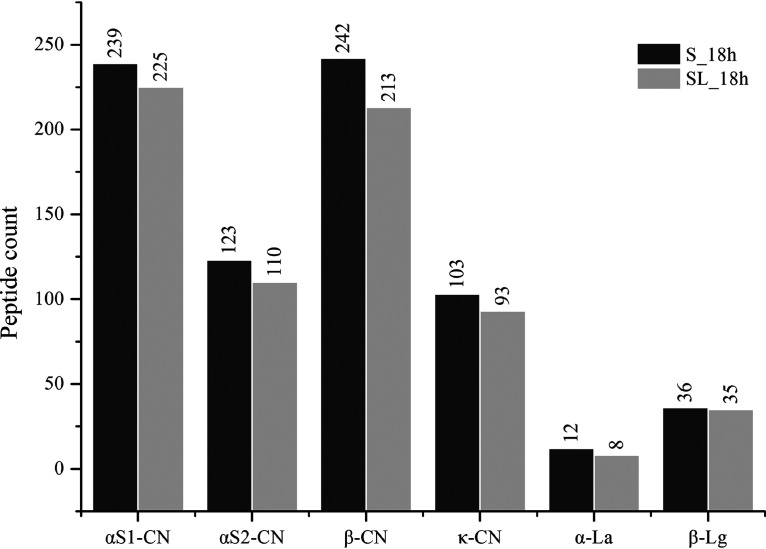
Figure 6 shows the peptide distribution from different parent proteins in the two samples at 18 h. Comparison of released peptides for the two groups showed that the numbers of peptides from αS1-CN, αS2-CN, β-CN, κ-CN, α-La, and β-Lg in the S group were always higher than those in the SL group. For the S and SL groups, a total of 239 and 225 unique peptides from αS1-CN, 123 and 110 from αS2-CN, 242 and 213 from β-CN, 103 and 93 from κ-CN, 12 and 8 from α-La, and 36 and 35 from β-Lg were identified, respectively. In general, S. thermophilus 1275 was more prone to degrading αS1-CN and β-CN during milk fermentation.
FIG 6.
Counts of peptides identified from the parent proteins αS1-CN, αS2-CN, β-CN, κ-CN, α-La, and β-Lg.
Figure 5 shows the Venn diagram of the casein peptides identified in the two samples. A total of 543 peptides were shared in the two groups, whereas 212 unique peptides appeared specifically in the S group and 141 in the SL group. After comparison of the 141 unique peptides in the SL group with all other peptides in the S group, it appeared that 118 of the 141 peptides in the SL group were degradation products from the front or end of the polypeptides in the S group.
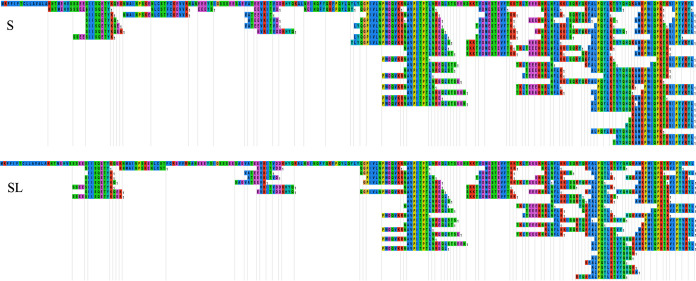
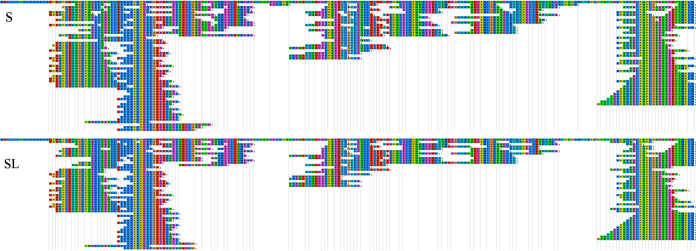
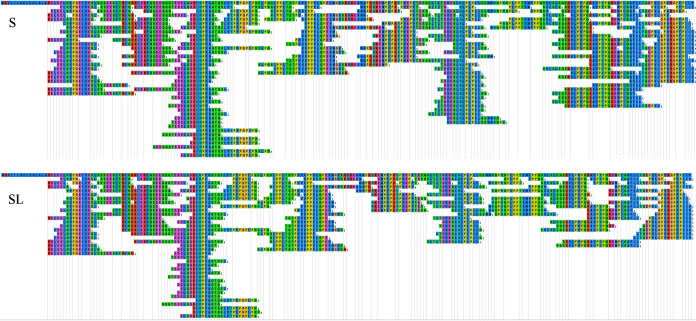
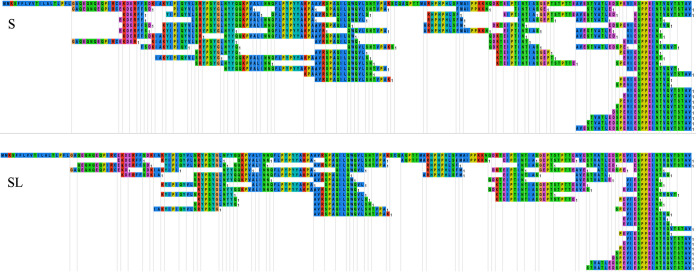
Figures 7 to 10 exhibit comparisons of the distributions of the hydrolyzed peptides from different parent proteins between S and SL groups by use of the EnzymePredictor tool (17). These comparisons above verified that the supplementation with Lb. brevis 145 in the SL group rarely interfered with the casein cleavage pattern of S. thermophilus 1275. Moreover, Lb. brevis 145 in the SL group preferred to degrade peptides hydrolyzed by S. thermophilus 1275 from f(48–64) (i.e., amino acids 48 to 64) and f(144–160) from αS1-CN, the end of αS2-CN, f(120–136) and f(152–179) from β-CN, and f(32–80) from κ-CN. αS1-CN and β-CN donated most of the necessary peptides for Lb. brevis 145.
FIG 7.
Distribution of identified peptides on parent protein αS2-CN in the 18-h fermented (S and SL) groups.
FIG 8.
Distribution of identified peptides on parent protein αS1-CN in the 18-h fermented (S and SL) groups.
FIG 9.
Distribution of identified peptides on parent protein β-CN in the 18-h fermented (S and SL) groups.
FIG 10.
Distribution of identified peptides on parent protein κ-CN in the 18-h fermented (S and SL) groups.
RNA analysis.
The results of sequencing data production and read assembly are shown in Tables 1 and 2, respectively. As shown in Table 1, about 98.5% of raw reads per sample passed the filtering at a quality threshold of 20. De novo assembly of all valid reads generated 1,048, 1,001, 1,027, 1,615, 1,551, and 1,903 contigs (length, >1,000 bp) for sample 1 from culture S (S_1), S_2, S_3, SL_1, SL_2, and SL_3, respectively (Table 2). Contigs (>500 bp) were clustered to obtain unigenes as reference gene sequences; then valid data in every sample were aligned to UniGene to obtain transcripts per million (TPM) for calculating the gene expression abundances in different samples. KEGG pathway and Gene Ontology (GO) functional enrichment analyses were carried out. By combining these analyses with UniGene taxonomy, the unigenes of interest from Lb. brevis and S. thermophilus were selected for further analysis.
TABLE 1.
Sequence data production from metatranscriptomic sequencing
| Sample | No. of raw reads | Base | No. of valid reads | Base | % valid | Q20 | Q30 | GC (%) |
|---|---|---|---|---|---|---|---|---|
| S_1 | 94,490,138 | 14.17G | 93,749,744 | 13.95G | 99.22 | 98.68 | 95.49 | 41.14 |
| S_2 | 79,682,042 | 11.95G | 79,072,206 | 11.78G | 99.23 | 98.66 | 95.39 | 40.88 |
| S_3 | 96,100,058 | 14.42G | 95,226,478 | 14.17G | 99.09 | 98.59 | 95.23 | 40.80 |
| SL_1 | 89,515,638 | 13.43G | 88,602,730 | 13.17G | 98.98 | 98.53 | 95.11 | 41.39 |
| SL_2 | 81,406,964 | 12.21G | 80,653,214 | 12.00G | 99.07 | 98.57 | 95.15 | 41.11 |
| SL_3 | 86,264,110 | 12.94G | 84,893,400 | 12.56G | 98.41 | 98.46 | 95.05 | 41.86 |
TABLE 2.
Sequence read assembly
| Assembly | S_1 | S_2 | S_3 | SL_1 | SL_2 | SL_3 |
|---|---|---|---|---|---|---|
| No. of contigs | ||||||
| ≥0 bp | 2,235 | 2,198 | 2,152 | 2,669 | 2,672 | 4,066 |
| ≥1,000 bp | 1,048 | 1,001 | 1,027 | 1,615 | 1,551 | 1,903 |
| ≥5,000 bp | 160 | 165 | 120 | 266 | 224 | 138 |
| ≥10,000 bp | 43 | 46 | 31 | 59 | 40 | 25 |
| ≥25,000 bp | 0 | 1 | 0 | 0 | 0 | 0 |
| ≥50,000 bp | 0 | 0 | 0 | 0 | 0 | 0 |
| Total | 2,235 | 2,198 | 2,152 | 2,669 | 2,672 | 4,066 |
| GC (%) | 42.43 | 42.35 | 42.16 | 43.47 | 43.44 | 43.69 |
| N50 (bp) | 2,968 | 3,077 | 2,643 | 3,448 | 3,193 | 1,838 |
Coculture-associated changes in GABA production-associated genes.
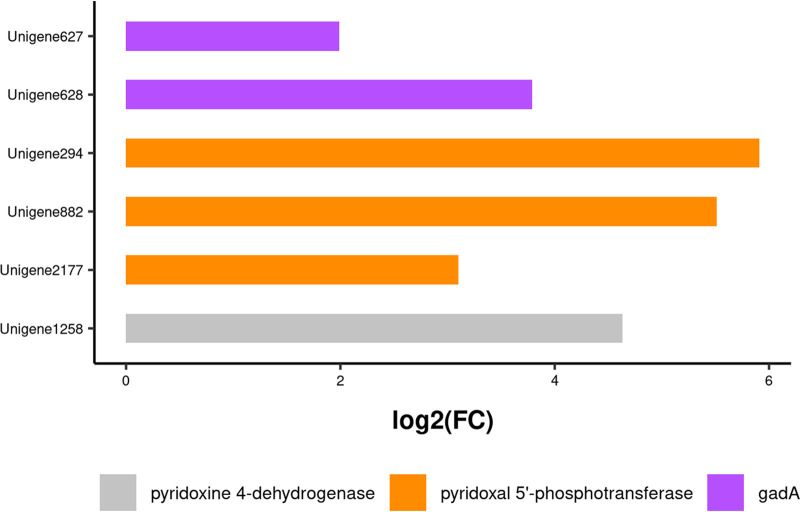
For Lb. brevis, unigenes (627, 628) coding for GadA (glutamic acid decarboxylase) were found after GO functional annotation, while unigenes (294, 882, 2177) coding for pyridoxal 5′-phosphotransferase and a unigene (1258) coding for pyridoxine 4-dehydrogenase in the pyridoxal-5ʹ-phosphate (PLP) synthesis pathway were found after KEGG functional annotation. Moreover, GadA, pyridoxine 4-dehydrogenase (EC 1.1.1.65), and pyridoxal 5′-phosphotransferase (EC 2.7.1.35), all participating in PLP production, were significantly upregulated in the SL experimental group relative to expression in the S control group (Fig. 11).
FIG 11.
Changes in the expression of genes coding for GABA synthesis-associated enzymes in Lb. brevis 145 in the SL group. FC, fold change.
Glucose transport and utilization.
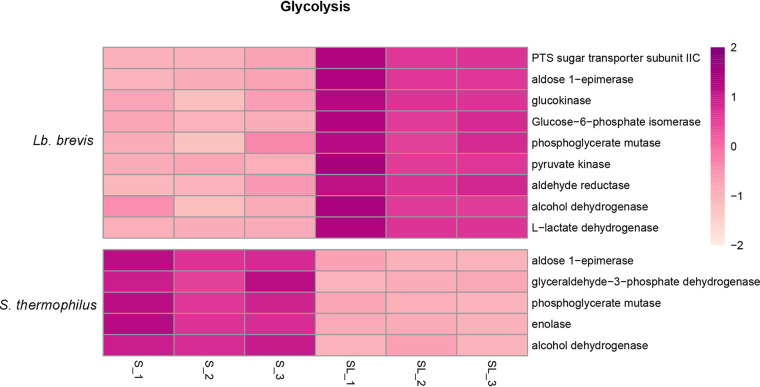
After GO and KEGG functional annotation of all unigenes for Lb. brevis and S. thermophilus, it was found that there were no significant changes in gene expression for lactose and galactose transportation and metabolism in either Lb. brevis or S. thermophilus, but the change in gene expression for glucose transportation and metabolism was pronounced and is presented in Fig. 12.
FIG 12.
Heat map of expression levels (log2 fold change) of genes related to glucose uptake and utilization in Lb. brevis 145 and S. thermophilus 1275.
For Lb. brevis, a unigene related to phosphotransferase system (PTS) sugar transporter subunit IIC was significantly upregulated (Fig. 12) for transporting glucose into the cytoplasm, and a set of unigenes encoding enzymes in the phosphoketolase pathway were correspondingly activated, as follows (with the reactions in parentheses): aldose 1-epimerase (from α-d-glucose into β-d-glucose), glucokinase (from glucose into glucose-6-phosphate [glucose-6-P]), phosphoglucose isomerase (from glucose-6-P into fructose-6-P [bidirectional reaction]), phosphoglycerate mutase (from 3-phosphoglycerate into 2-phosphoglycerate), and phosphoenolpyruvate kinase (from phosphoenolpyruvate into pyruvate). Moreover, a unigene coding for l-lactate dehydrogenase (from pyruvate into lactic acid) was significantly expressed to completely ferment pyruvate.
In contrast, all differentially expressed unigenes involving the phosphoketolase pathway were suppressed (Fig. 12) in S. thermophilus, and the related unigenes (with the reactions or products in parentheses) are as follows: aldose 1-epimerase, glyceraldehyde-3-phosphate dehydrogenase (from glyceraldehyde 3-phosphate into d-glycerate 1,3-bisphosphate), phosphoglycerate mutase (from 3-phosphoglycerate into 2-phosphoglycerate), phosphopyruvate dehydratase (from 2-phospho-d-glycerate into phosphoenolpyruvate), and alcohol dehydrogenase (end product, acetaldehyde).
Protease and peptidase.
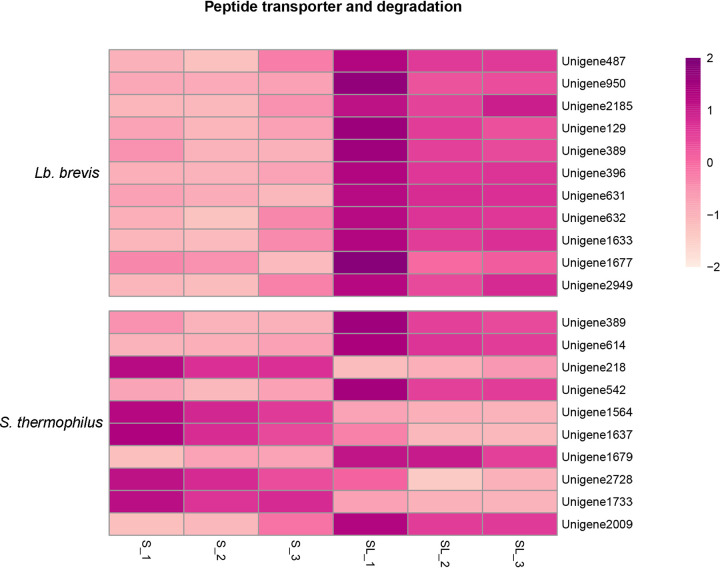
After GO enrichment analysis, significantly differentially expressed unigenes related to proteolysis and peptidases in Lb. brevis and S. thermophilus were independently selected. The effects of coculture on gene expression related to proteolysis activity and peptidases in Lb. brevis 145 and S. thermophilus 1275 are shown in Fig. 13.
FIG 13.
Heat map of expression levels (log2 fold change) of unigenes related to peptide transporters and degradation in Lb. brevis 145 and S. thermophilus 1275.
For Lb. brevis (Fig. 13), there was no unigene involved in proteolysis. The expression of eight unigenes related to a metalloendopeptidase (unigene 396), a carboxypeptidase (unigenes 631, 632, 1633, and 2949), a serine-type endopeptidase (unigene 1677), and an aminopetidase (unigenes 129 and 389) was upregulated in the coculture group.
For S. thermophilus (Fig. 13), unigenes (389 and 614) coding for protease in the SL group were upregulated. Whereas unigenes coding for a cysteine-type endopeptidase (unigene 1733) and a carboxypeptidase (unigenes 1564, 1637, and 2728) were downregulated, only the expression of unigene 2009, coding for a metallopeptidase, was increased in the SL group.
Peptide and amino acid transmembrane transporters.
After GO enrichment analysis, significantly differentially expressed unigenes for amino acid and peptide transmembrane transporters in Lb. brevis and S. thermophilus were independently selected. The effects of coculture on gene expression associated with amino acid and peptide transmembrane transporters in Lb. brevis 145 and S. thermophilus 1275 are shown in Fig. 13 and 14.
FIG 14.
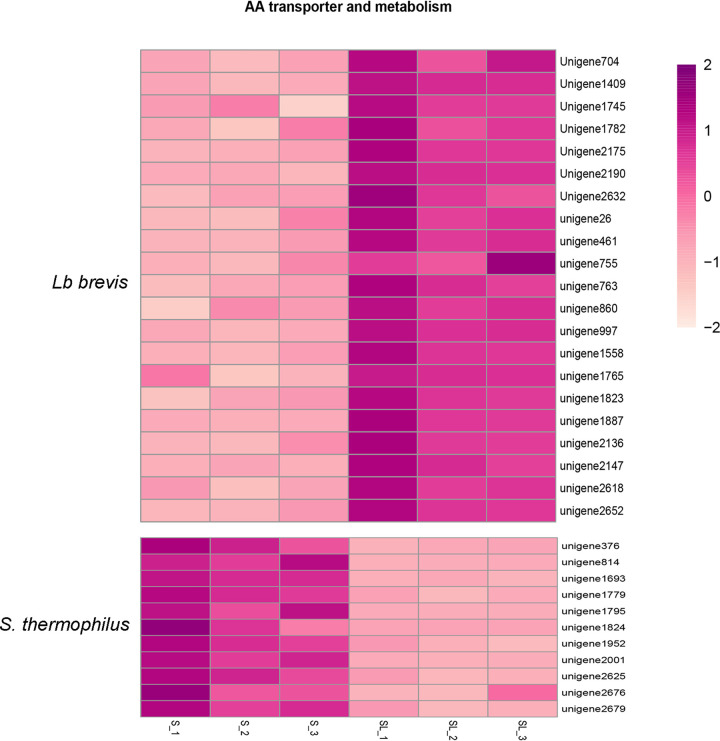
Heat map of expression levels (log2 fold change) of unigenes related to amino acid (AA) transporters, metabolism, and synthesis in Lb. brevis 145 and S. thermophilus 1275.
Overall, comparison of the S and SL groups suggested the upregulation of unigenes coding for peptide transmembrane transporters (unigenes 487, 950, and 2185) (Fig. 13) and amino acid transmembrane transporters (unigenes 704, 1409, 1745, 1782, 2175, 2190, and 2632) (Fig. 14) in Lb. brevis in the SL group, whereas unigenes responsible for transporting peptides (unigenes 218 and 542) (Fig. 13) and amino acids (data not shown) in S. thermophilus in the SL group were up- or downregulated without regular transport patterns.
Amino acid metabolism and synthesis.
The changes in unigene expression associated with amino acid metabolism and biosynthesis in Lb. brevis and S. thermophilus after coculture, as determined by KEGG pathway analysis, are presented in Fig. 14. It was observed that the expression of unigenes related to amino acid metabolism and biosynthesis was increased in Lb. brevis but decreased in S. thermophilus in the coculture group.
For Lb. brevis, unigenes involved in cysteine and methionine metabolism (unigenes 26, 461, and 2136), arginine and proline metabolism (unigene 763), d-alanine metabolism (unigenes 997 and 1823), d-glutamine and d-glutamate metabolism (unigenes 860 and 1558), lysine biosynthesis (unigenes 755, 1887, 2147, and 2652), and phenylalanine, tyrosine, and tryptophan biosynthesis (unigenes 1765 and 2618) were found to be upregulated. For S. thermophilus, downregulation of unigenes related to cysteine and methionine metabolism (unigenes 376, 1824, 2001, and 2679), arginine and proline metabolism (unigenes 1693 and 2676), d-glutamine and d-glutamate metabolism (unigene 1779), histidine metabolism (unigene 814), lysine biosynthesis (unigenes 1795 and 1952), and phenylalanine, tyrosine, and tryptophan biosynthesis (unigene 2625) was observed.
GO classification.
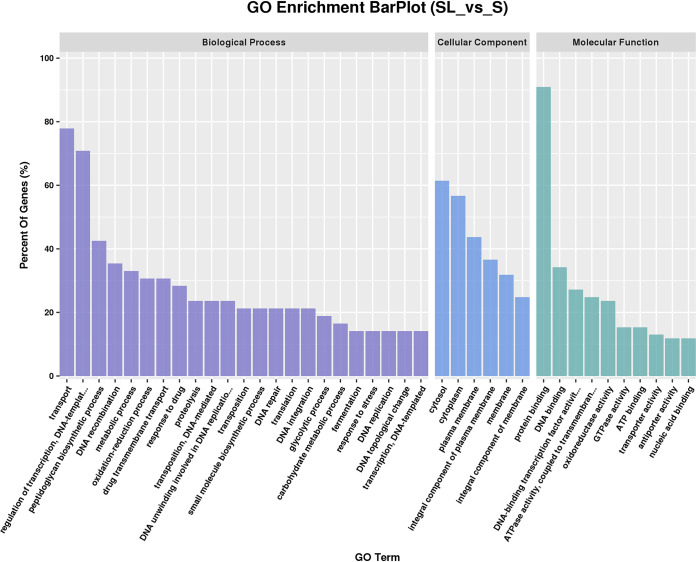
GO classification assigned significantly differentially expressed unigenes to 39 GO terms relating to biological processes, cellular components, and molecular function (Fig. 15). “Biological process,” including DNA- and transcription-related terms, was the largest category.
FIG 15.
GO enrichment.
KEGG pathway analysis.
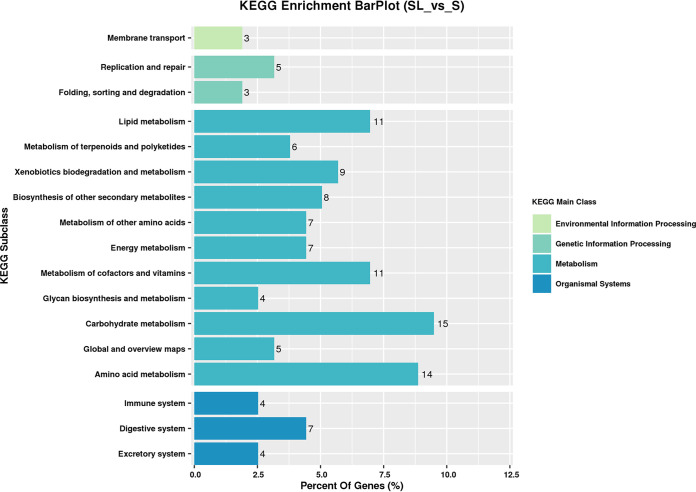
KEGG enrichment analysis was performed on differentially expressed unigenes to identify the changed pathways involved in the coculture (Fig. 16). The metabolism of cofactors and vitamins, amino acid metabolism, carbohydrate metabolism, and lipid metabolism were found to be significantly affected in the mixed cultivation system. In addition, membrane transport, energy metabolism, and the biosynthesis of other secondary metabolites were shown to be influenced in comparison with expression in the S single-culture milk batch.
FIG 16.
KEGG pathway enrichment.
DISCUSSION
Significant molecular knowledge about the general metabolic processes of S. thermophilus 1275 (18) and Lb. brevis 145 (19) occurring in M17 and MRS medium has been reported. Due to the lack of growth of Lb. brevis 145 as a monoculture during milk fermentation and the inability of S. thermophilus 1275 to produce GABA, our research focused on fermenting milk by coculturing Lb. brevis 145 and S. thermophilus 1275 to simultaneously enrich GABA and improve the number of health-promoting Lb. brevis cells. Here, we integrated LC–MS-MS and metatranscriptomic techniques, together with high-performance liquid chromatography (HPLC) analysis, to reveal the association of S. thermophilus 1275 and Lb. brevis 145 in GABA production during milk fermentation based on utilization of the main carbon and nitrogen sources.
Casein hydrolysis and utilization.
Casein consists of 34% αS1-CN, 8% αS2-CN, 25% β-CN, and 9% κ-CN. Lb. brevis 145 is unable to ferment milk because of its poor proteolytic nature (8), whereas S. thermophilus 1275, carrying the PrtS gene, exhibits good extracellular proteolytic properties (20).
The patterns for the breakdown of casein and whey proteins by S. thermophilus 1275 were not affected by supplementation with Lb. brevis 145 (Fig. 7 to 10). The numbers of peptides from αS1-CN, αS2-CN, β-CN, κ-CN, α-La, and β-Lg in the S group were higher than those in the SL group (Fig. 6). Importantly, after comparison of 141 unique peptides in the SL group with all other peptides in the S group, it appeared that 118 of the 141 peptides in the SL group were degradation products from the front or end of the polypeptides in the S group (Table S1 in the supplemental material), indicating that the hydrolyzed peptides in the SL group were provided by S. thermophilus 1275 and that Lb. brevis 145 in the SL group was presumably able to degrade the peptides to meet the need for nitrogen for its growth. In support of this hypothesis, we carried out metatranscriptomic analysis to understand how Lb. brevis utilized those peptides.
The track of hydrolyzed peptides in the coculture system was monitored by applying RNA profiles. It was reported that the uptake of peptides was mediated by the peptide transport proteins belonging to a superfamily of highly conserved ATP-binding cassette transporters (21). Accordingly, based on our results, gene expression associated with peptide transmembrane transporters in Lb. brevis 145 was increased (Fig. 13). Law and Kolstad (22) reported that after the casein-derived peptides were taken up by cells of lactic acid bacteria (LAB), they were degraded by a concerted action of peptidases with differing and partly overlapping specificities, a finding consistent with our results showing that peptidase activity in Lb. brevis 145 was promoted (Fig. 13) to digest the imported peptides from S. thermophilus 1275 so as to obtain nutrients. Naturally, the angiotensin-I converting enzyme (ACE-I) activity of hydrolyzed peptides in the coculture group declined as some bioactive peptides from S. thermophilus 1275 were presumably degraded by Lb. brevis 145 (Fig. 17).
FIG 17.
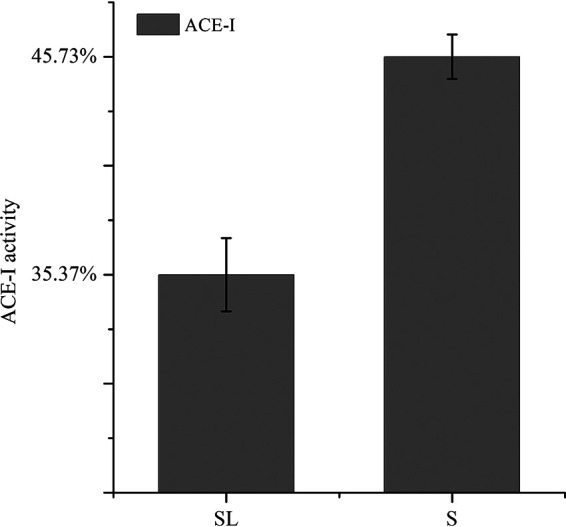
ACE-I activity of casein hydrolysate extracts in the 18-h fermented (S and SL) groups.
In addition, Lb. brevis 145 directly transported and metabolized free amino acids from the extracellular environment. Meanwhile, lysine, phenylalanine, tyrosine, and tryptophan were synthesized by Lb. brevis itself (Fig. 14) to fulfill its growth needs. This was in contrast to the study by Klaenhammer et al. reporting that lactobacilli are largely deficient in amino acid biosynthetic capacity (23). In our study, amino acid metabolism, amino acid biosynthesis, and peptidase activity in S. thermophilus 1275 were correspondingly suppressed (Fig. 13 and 14). The suppression of nitrogen consumption by S. thermophilus 1275 was thought to support the growth of Lb. brevis 145 at 18 h of fermentation.
Our results exhibited casein hydrolysis by S. thermophilus and peptide uptake and degradation by Lb. brevis 145 in the coculture system on a molecular basis. This suggested that the determination of peptide profiles by metatranscriptomics makes it possible to elucidate the ability of S. thermophilus 1275 to hydrolyze caseins and provide peptides to Lb. brevis to compensate for its deficiencies in breaking down proteins so as to allow this strain to grow in milk and produce GABA.
Hydrolysis of lactose and uptake of glucose.
S. thermophilus 1275 prefers lactose over glucose as the primary carbon and energy source (24), since S. thermophilus possesses lactose permease (encoded by lacS) and β-d-galactosidase (encoded by lacZ) (25), which enable the transportation and hydrolysis of lactose into glucose and galactose. The deficiency of Lb. brevis in hydrolyzing lactose, in contrast to dairy industry strains, resulted in its inability to ferment lactose-rich milk (19). Lb. brevis 145 was expected to utilize glucose hydrolyzed from lactose provided by S. thermophilus 1275 for promoting its growth during milk fermentation.
There was no change in the residual concentrations of lactose and galactose in the S and SL groups after 18 h of fermentation, which meant that coculturing Lb. brevis 145 with S. thermophilus 1275 did not influence the utilization of lactose and galactose in comparison with that in the S single-culture group. In addition, no peak for glucose appeared in the HPLC chromatogram. O’Leary and Woychik (26) also reported the extremely low levels (less than 0.01%) of glucose present in milk throughout the incubation period with a mixed culture of S. thermophilus and L. delbrueckii subsp. bulgaricus in milk. Thus, it was assumed that once glucose was hydrolyzed from lactose by S. thermophilus 1275, it was competitively utilized by Lb. brevis 145. Based on RNA results for Lb. brevis 145 in the coculture batch, glucose-specific enzyme IIA in the PTS, which transports glucose into the cytoplasm (27), was expressed (Fig. 12), and most of the enzymes associated with the phosphoketolase pathway were correspondingly activated (Fig. 12). Active DNA replication and glycerolipid, purine, and pyridine synthesis in Lb. brevis 145 in the coculture batch at 18 h (Fig. 15) also suggested that Lb. brevis 145 exhibited rapid growth in the presence of glucose.
In contrast, all differentially expressed unigenes coding for phosphoketolase pathway-associated enzymes were suppressed (Fig. 12) in S. thermophilus 1275. Our results suggested that Lb. brevis 145 outcompeted S. thermophilus 1275 for glucose as an energy source for growth at 18 h.
GABA production.
In addition to supplying glucose, amino acids, and peptides, S. thermophilus also created a hydrogen-rich environment as a result of lactic acid production during the first 6 h of fermentation. An acidic environment is necessary for the decarboxylation of glutamate in GABA-producing bacteria (28). Moreover, Gad activity and pyridoxal-5ʹ-phosphate (PLP) synthesis have been reported as essential elements for GABA production. Gad, the sole enzyme for the decarboxylation of glutamate to GABA, is localized in the cytoplasm of most GABA-producing LAB (29), and PLP is a cofactor for the Gad enzyme (30). Capitani et al. (31) further demonstrated at the molecular level that Gad C-terminal residues 452 to 466 formed a well-structured “plug” to block substrate binding at a neutral pH. The active site of GAD lies in the highly conserved PLP-binding “large” domain, and residue Lys276 is required for the formation of a Schiff-base linkage with the C-4 atom of the PLP moiety. Hence, Gad activity and PLP synthesis are essential for GABA production.
RNA results showed that gadA expression and PLP synthesis in a cocultured fermentation at 18 h were activated for the initiation of GABA production (Fig. 11); this is in agreement with the report of Wu et al. showing the upregulation of gadA expression for GABA production by use of reverse transcription-PCR (RT-PCR) (10) and with other previous findings showing improvement of the GABA yield with PLP supplementation in the medium (30, 32).
Conclusion.
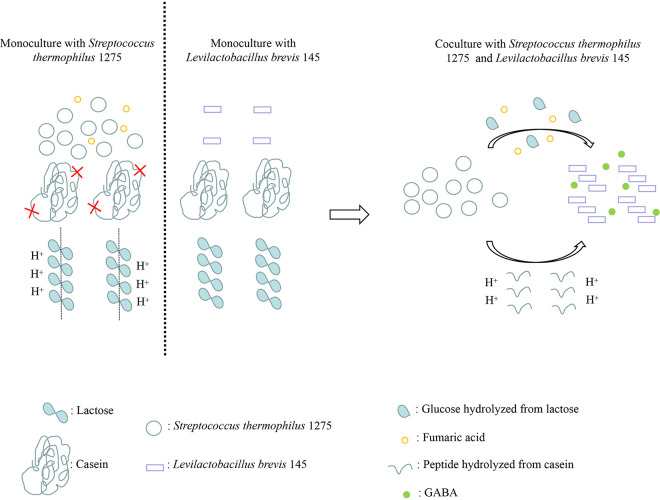
The association of Lb. brevis 145 with S. thermophilus 1275 for GABA production during milk fermentation was comprehensively investigated. S. thermophilus 1275 cleaved casein into peptides and hydrolyzed lactose into glucose and galactose. Lb. brevis 145 was able to survive in milk with glucose and peptides provided by S. thermophilus 1275. On the other hand, S. thermophilus 1275 multiplied rapidly in the early stage of fermentation and decreased the pH due to the production of lactic acid, which provided an appropriate acidic environment for Lb. brevis 145 to induce GABA production. The coculture was observed as an efficient ecosystem for manufacturing GABA-rich milk by making use of nutrients in milk during fermentation (Fig. 18).
FIG 18.
Graphical abstract for coculture ecosystem for GABA production.
MATERIALS AND METHODS
Bacterial strains and fermentation conditions.
Lb. brevis 145 and S. thermophilus 1275 were activated by 1% inoculation into Difco Lactobacilli MRS broth (BD Company, USA) and M17 broth (BD Company), respectively, and incubation at 37°C for 16 h. S. thermophilus 1275 (1%, vol/vol) or Lb. brevis 145 (3%, vol/vol) was inoculated into 10% (wt/vol) reconstituted skim milk supplemented with 2 g/liter monosodium glutamate (MSG) for monoculture fermentation. For coculture fermentation, S. thermophilus 1275 (1%, vol/vol) and Lb. brevis 145 (3%, vol/vol) were inoculated together into 10% (wt/vol) reconstituted skim milk supplemented with 2 g/liter MSG.
Enumeration of viable Lb. brevis 145 and S. thermophilus 1275 cells in the monoculture and coculture fermentation groups.
After milk fermentation at different time points, monoculture and coculture samples were diluted appropriately with sterilized physiological saline, and viable cells of Lb. brevis 145 in the L monoculture group and the coculture group were enumerated by plating 100-μl serial dilutions onto MRS agar plates. Viable cell counts of S. thermophilus 1275 in the S monoculture group and the coculture group were performed by plating 100-μl serial dilutions onto M17 agar plates. Visible colonies were counted after 24 h of cultivation at 37°C.
Estimation of GABA, residual lactose, glucose, galactose, and acid levels.
Residual sugars, organic acid production, and GABA yield were determined by HPLC as described previously (25).
Measurement of the pH of fermented milk.
An Orion portable pH meter (model 250A; Thermo Scientific, Wilmington, DE, USA) was used to monitor the pH of the fermented milk at different time points.
Peptide extract.
A 4-ml aliquot of fermented milk in the S or SL batch at 18 h was diluted with an equal amount of deionized water, followed by centrifugation at 5,000 × g and 4°C for 30 min to remove coagulated caseins and bacteria. A centrifugal ultrafiltration tube with a 10-kDa cutoff (Millipore, Billerica, MA, USA) was used to filter the supernatants at 5,000 × g and 20°C for 30 min, and the ultrafiltrate was loaded onto a C18 solid-phase extraction (SPE) column (Waters, Ireland) in order to perform desalting (three times for each sample). The eluate containing target peptides was freeze-dried to a powder.
LC–MS-MS and data analysis.
Lyophilized peptide fractions were resuspended in double-distilled water (ddH2O) containing 0.1% formic acid, and a 5-μl aliquot of peptide-containing liquid was loaded into a nanoViper C18 (3 μm, 100 Å) trap column for analysis as described previously (15). The RAW files of MS-MS data generated were converted to .MGF by Proteome Discoverer (version 2.1.0.81; Thermo Scientific, San Jose, CA, USA) and were searched against a reviewed Bos taurus database (6,008 sequences) using Mascot Daemon (version 2.3.2). No enzyme or static modification was set for database searching. Precursor and fragment mass tolerances were set to 10 ppm and 0.05 Da, respectively. After the peptide sequence data set was obtained, the numbers of unique sequences and sequences shared by the S and SL groups were obtained using VENNY, version 2.1. Meanwhile, the peptide sequences unique to the SL group were compared with all peptide sequences in the S group to determine whether degradation of peptides by Lb. brevis 145 contributed to the unique peptide sequences in the SL group. Finally, peptide sequences in the S and SL groups were input into the EnzymePredictor website (http://bioware.ucd.ie/~enzpred/Enzpred.php) to visualize the peptide sources and the corresponding cleavage sites of digested peptides, respectively. This helped determine whether the casein cleavage pattern of S. thermophilus 1275 was influenced by Lb. brevis 145 in the coculture system and to further identify the preferred peptide region where peptides were degraded by Lb. brevis 145.
ACE inhibition assay.
The ACE-I activity for the casein hydrolysates was assayed using a previously published method (18) to determine whether there was a difference in the ACE-I activities of degraded peptides between the S and SL groups. The inhibition percentage was calculated as (Acontrol – Asample)/(Acontrol – Ablank) × 100%, where A stands for absorbance at 228 nm.
Sample collection, RNA isolation, and cDNA library construction.
Aliquots (4 ml) of fermented milk in the S and SL fermentation batches at 18 h were diluted three times, followed by centrifugation at 500 × g and 4°C for 20 min to remove coagulated caseins (three times), and supernatants were centrifuged twice at 5,000 × g and 4°C for 30 min to collect bacterial cell pellets. After isolation and purification of total RNA, rRNA from approximately 5 μg of total RNA in each sample was depleted, and the residual RNA was fragmented to create A-tailing, cDNA-ligating adapters with a T-base overhang, followed by size selection of fragments and PCR amplification. The average insert size for the final cDNA library was 300 bp (±50 bp). Finally, 150-bp paired-end sequencing was performed on an Illumina HiSeq 4000 system (LC Bio, Hangzhou, China).
Metatranscriptomic sequencing and analysis.
Quality-filtered reads (Table 1) were obtained after the removal of adapters, trimming of low-quality reads, and removal of host contamination. Metatrascriptome contigs for each sample were constructed by assembling valid reads with Trinity, version 2.2.0 (Table 2). Unigenes were obtained after clustering of all metatrascriptome contigs of all samples using CD-HIT, version 4.6.1. Transcripts per million (TPM) based on the number of aligned reads were applied to estimate unigene abundance for each sample by bowtie2, version 2.2.0. Based on the method applying functional annotation (GO, KEGG) of unigenes with taxonomic profiling (12), the corresponding differentially expressed genes of interest, including those related to sugar utilization, peptide and amino acid transportation, peptide degradation, and amino acid metabolism pathways for Lb. brevis and S. thermophilus strains, were confirmed. Finally, the target differentially expressed genes in individual organisms were independently curated by hand for graphics.
Data availability.
The raw sequencing reads of the metatranscriptome, together with the processed data set supporting the results presented above, were deposited in the GEO repository under accession number GSE157976.
Supplementary Material
ACKNOWLEDGMENTS
We thank LC-Bio Company (Hangzhou, China) for providing metatranscriptomic sequencing and data analysis and the Wininnovate-Bio Company (Shenzhen, China) for LC–MS-MS service.
This work was financially supported by the Research Grants Council (RGC) of Hong Kong, project 17103618 (Investigation into high γ-aminobutyric acid producing lactic acid bacteria: insights into genomics and transcriptomics).
N.P.S. conceived the research idea, and N.P.S. (as PI) and E.M.J., A.Y., J.H. (as co-investigators) received the RGC research grant. T.X. and N.P.S. designed the experiments. T.X. performed the experiments and analyzed the data. A.Y., J.H., and E.M.J. assisted in data interpretation. T.X. drafted the manuscript, and N.P.S. edited the manuscript.
Footnotes
Supplemental material is available online only.
REFERENCES
- 1.Avoli M, Krnjevi K. 2016. The long and winding road to gamma-amino-butyric acid as neurotransmitter. Can J Neurol Sci 43:219–226. doi: 10.1017/cjn.2015.333. [DOI] [PubMed] [Google Scholar]
- 2.Kawakami K, Yamada K, Yamada T, Nabika T, Nomura M. 2018. Antihypertensive effect of γ-aminobutyric acid-enriched brown rice on spontaneously hypertensive rats. J Nutr Sci Vitaminol (Tokyo) 64:56–62. doi: 10.3177/jnsv.64.56. [DOI] [PubMed] [Google Scholar]
- 3.Möhler H. 2012. The GABA system in anxiety and depression and its therapeutic potential. Neuropharmacology 62:42–53. doi: 10.1016/j.neuropharm.2011.08.040. [DOI] [PubMed] [Google Scholar]
- 4.Hsueh Y-H, Liaw W-C, Kuo J-M, Deng C-S, Wu C-H. 2017. Hydrogel film-immobilized Lactobacillus brevis RK03 for γ-aminobutyric acid production. Int J Mol Sci 18:2324. doi: 10.3390/ijms18112324. [DOI] [PMC free article] [PubMed] [Google Scholar]
- 5.Li H, Qiu T, Huang G, Cao Y. 2010. Production of gamma-aminobutyric acid by Lactobacillus brevis NCL912 using fed-batch fermentation. Microb Cell Fact 9:85–88. doi: 10.1186/1475-2859-9-85. [DOI] [PMC free article] [PubMed] [Google Scholar]
- 6.Lim HS, Cha IT, Roh SW, Shin HH, Seo MJ. 2017. Enhanced production of gamma-aminobutyric acid by optimizing culture conditions of Lactobacillus brevis HYE1 isolated from kimchi, a Korean fermented food. J Microbiol Biotechnol 27:450–459. doi: 10.4014/jmb.1610.10008. [DOI] [PubMed] [Google Scholar]
- 7.Wu Q, Shah NP. 2015. Gas release-based prescreening combined with reversed-phase HPLC quantitation for efficient selection of high-γ-aminobutyric acid (GABA)-producing lactic acid bacteria. J Dairy Sci 98:790–797. doi: 10.3168/jds.2014-8808. [DOI] [PubMed] [Google Scholar]
- 8.Wu Q, Tun HM, Law Y-S, Khafipour E, Shah NP. 2017. Common distribution of gad operon in Lactobacillus brevis and its GadA contributes to efficient GABA synthesis toward cytosolic near-neutral pH. Front Microbiol 8:206–209. doi: 10.3389/fmicb.2017.00206. [DOI] [PMC free article] [PubMed] [Google Scholar]
- 9.Wu Q, Shah NP. 2017. High γ-aminobutyric acid production from lactic acid bacteria: emphasis on Lactobacillus brevis as a functional dairy starter. Crit Rev Food Sci Nutr 57:3661–3672. doi: 10.1080/10408398.2016.1147418. [DOI] [PubMed] [Google Scholar]
- 10.Wu Q, Law YS, Shah NP. 2015. Dairy Streptococcus thermophilus improves cell viability of Lactobacillus brevis NPS-QW-145 and its gamma-aminobutyric acid biosynthesis ability in milk. Sci Rep 5:12885. doi: 10.1038/srep12885. [DOI] [PMC free article] [PubMed] [Google Scholar]
- 11.Vinderola CG, Mocchiutti P, Reinheimer JA. 2002. Interactions among lactic acid starter and probiotic bacteria used for fermented dairy products. J Dairy Sci 85:721–729. doi: 10.3168/jds.S0022-0302(02)74129-5. [DOI] [PubMed] [Google Scholar]
- 12.Lessard MH, Viel C, Boyle B, St-Gelais D, Labrie S. 2014. Metatranscriptome analysis of fungal strains Penicillium camemberti and Geotrichum candidum reveal cheese matrix breakdown and potential development of sensory properties of ripened Camembert-type cheese. BMC Genomics 15:235–240. doi: 10.1186/1471-2164-15-235. [DOI] [PMC free article] [PubMed] [Google Scholar]
- 13.Weckx S, Allemeersch J, Van der Meulen R, Vrancken G, Huys G, Vandamme P, Van Hummelen P, De Vuyst L. 2011. Metatranscriptome analysis for insight into whole-ecosystem gene expression during spontaneous wheat and spelt sourdough fermentations. Appl Environ Microbiol 77:618–626. doi: 10.1128/AEM.02028-10. [DOI] [PMC free article] [PubMed] [Google Scholar]
- 14.Sieuwerts S, Molenaar D, van Hijum SAFT, Beerthuyzen M, Stevens MJA, Janssen PWM, Ingham CJ, de Bok FAM, de Vos WM, van Hylckama Vlieg JET. 2010. Mixed-culture transcriptome analysis reveals the molecular basis of mixed-culture growth in Streptococcus thermophilus and Lactobacillus bulgaricus. Appl Environ Microbiol 76:7775–7784. doi: 10.1128/AEM.01122-10. [DOI] [PMC free article] [PubMed] [Google Scholar]
- 15.Ebner J, Aşçı Arslan A, Fedorova M, Hoffmann R, Küçükçetin A, Pischetsrieder M. 2015. Peptide profiling of bovine kefir reveals 236 unique peptides released from caseins during its production by starter culture or kefir grains. J Proteomics 117:41–57. doi: 10.1016/j.jprot.2015.01.005. [DOI] [PubMed] [Google Scholar]
- 16.Bounouala FZ, Roudj S, Karam N-E, Recio I, Miralles B. 2017. Casein hydrolysates by Lactobacillus brevis and Lactococcus lactis proteases. Peptide profile discriminates strain-dependent enzyme specificity. J Agric Food Chem 65:9324–9332. doi: 10.1021/acs.jafc.7b03203. [DOI] [PubMed] [Google Scholar]
- 17.Vijayakumar V, Guerrero AN, Davey N, Lebrilla CB, Shields DC, Khaldi N. 2012. EnzymePredictor: a tool for predicting and visualizing enzymatic cleavages of digested proteins. J Proteome Res 11:6056–6065. doi: 10.1021/pr300721f. [DOI] [PubMed] [Google Scholar]
- 18.Wu Q, Shah NP. 2018. Comparative mRNA-seq analysis reveals the improved EPS production machinery in Streptococcus thermophilus ASCC 1275 during optimized milk fermentation. Front Microbiol 9:445. doi: 10.3389/fmicb.2018.00445. [DOI] [PMC free article] [PubMed] [Google Scholar]
- 19.Wu Q, Shah NP. 2018. Restoration of GABA production machinery in Lactobacillus brevis by accessible carbohydrates, anaerobiosis and early acidification. Food Microbiol 69:151–158. doi: 10.1016/j.fm.2017.08.006. [DOI] [PubMed] [Google Scholar]
- 20.Fernandez-Espla MD, Garault P, Monnet V, Rul F. 2000. Streptococcus thermophilus cell wall-anchored proteinase: release, purification, and biochemical and genetic characterization. Appl Environ Microbiol 66:4772–4778. doi: 10.1128/aem.66.11.4772-4778.2000. [DOI] [PMC free article] [PubMed] [Google Scholar]
- 21.Higgins CF. 1992. ABC transporters: from microorganisms to man. Annu Rev Cell Biol 8:67–113. doi: 10.1146/annurev.cb.08.110192.000435. [DOI] [PubMed] [Google Scholar]
- 22.Law BA, Kolstad J. 1983. Proteolytic systems in lactic acid bacteria. Antonie Van Leeuwenhoek 49:225–245. doi: 10.1007/BF00399500. [DOI] [PubMed] [Google Scholar]
- 23.Klaenhammer TR, Barrangou R, Buck BL, Azcarate-Peril MA, Altermann E. 2005. Genomic features of lactic acid bacteria effecting bioprocessing and health. FEMS Microbiol Rev 29:393–409. doi: 10.1016/j.fmrre.2005.04.007. [DOI] [PubMed] [Google Scholar]
- 24.van den Bogaard PTC, Hols P, Kuipers OP, Kleerebezem M, de Vos WM. 2004. Sugar utilisation and conservation of the gal-lac gene cluster in Streptococcus thermophilus. Syst Appl Microbiol 27:10–17. doi: 10.1078/0723-2020-00258. [DOI] [PubMed] [Google Scholar]
- 25.Padmanabhan A, Tong Y, Wu Q, Zhang J, Shah NP. 2018. Transcriptomic insights into the growth phase- and sugar-associated changes in the exopolysaccharide production of a high EPS-producing Streptococcus thermophilus ASCC 1275. Front Microbiol 9:1919. doi: 10.3389/fmicb.2018.01919. [DOI] [PMC free article] [PubMed] [Google Scholar]
- 26.O’Leary VS, Woychik JH. 1976. Utilization of lactose, glucose, and galactose by a mixed culture of Streptococcus thermophilus and Lactobacillus bulgaricus in milk treated with lactase enzyme. Appl Environ Microbiol 32:89–94. doi: 10.1128/AEM.32.1.89-94.1976. [DOI] [PMC free article] [PubMed] [Google Scholar]
- 27.Xia T, Sriram N, Lee SA, Altman R, Urbauer JL, Altman E, Eiteman MA. 2017. Glucose consumption in carbohydrate mixtures by phosphotransferase-system mutants of Escherichia coli. Microbiology (Reading) 163:866–877. doi: 10.1099/mic.0.000480. [DOI] [PubMed] [Google Scholar]
- 28.Ma D, Lu P, Shi Y. 2013. Substrate selectivity of the acid-activated glutamate/γ-aminobutyric acid (GABA) antiporter GadC from Escherichia coli. J Biol Chem 288:15148–15153. doi: 10.1074/jbc.M113.474502. [DOI] [PMC free article] [PubMed] [Google Scholar]
- 29.Nomura M, Nakajima I, Fujita Y, Kobayashi M, Kimoto H, Suzuki I, Aso H. 1999. Lactococcus lactis contains only one glutamate decarboxylase gene. Microbiology 145:1375–1380. doi: 10.1099/13500872-145-6-1375. [DOI] [PubMed] [Google Scholar]
- 30.Huang Y, Su L, Wu J. 2016. Pyridoxine supplementation improves the activity of recombinant glutamate decarboxylase and the enzymatic production of gamma-aminobutyric acid. PLoS One 11:e0157466. doi: 10.1371/journal.pone.0157466. [DOI] [PMC free article] [PubMed] [Google Scholar]
- 31.Capitani G, De Biase D, Aurizi C, Gut H, Bossa F, Grütter MG. 2003. Crystal structure and functional analysis of Escherichia coli glutamate decarboxylase. EMBO J 22:4027–4037. doi: 10.1093/emboj/cdg403. [DOI] [PMC free article] [PubMed] [Google Scholar]
- 32.Shan Y, Man CX, Han X, Li L, Guo Y, Deng Y, Li T, Zhang LW, Jiang YJ. 2015. Evaluation of improved γ-aminobutyric acid production in yogurt using Lactobacillus plantarum NDC75017. J Dairy Sci 98:2138–2149. doi: 10.3168/jds.2014-8698. [DOI] [PubMed] [Google Scholar]
Associated Data
This section collects any data citations, data availability statements, or supplementary materials included in this article.
Supplementary Materials
Data Availability Statement
The raw sequencing reads of the metatranscriptome, together with the processed data set supporting the results presented above, were deposited in the GEO repository under accession number GSE157976.


