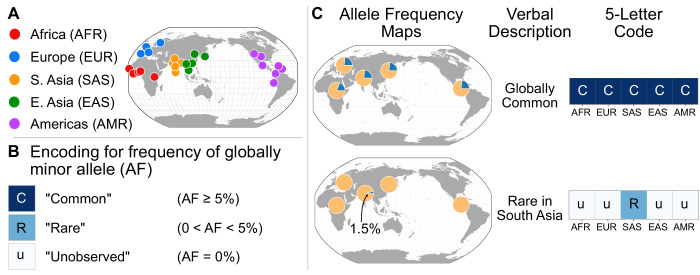
Figure 2. A simple coding system to represent geographic distributions of variants.
(A) Regional groupings of the 26 populations in the 1KGP Project. (B) Legend for minor allele frequency bins. (C) Two examples of how a verbal description of an allele frequency map can be communicated equivalently with a five-letter code (yellow signifies the major allele frequency, blue signifies the minor allele frequency in the pie charts).
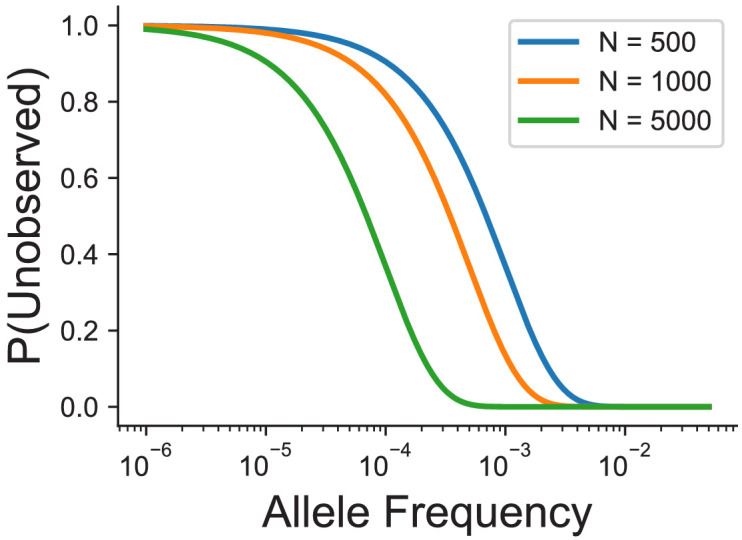
Figure 2—figure supplement 1. Probability of not observing a variant at a given allele frequency and sample size in number of individuals.


