Abstract
Background:
Models that predict postoperative complications often ignore important intraoperative events and physiological changes. This study tested the hypothesis that accuracy, discrimination, and precision in predicting postoperative complications would improve when using both preoperative and intraoperative data input data compared with preoperative data alone.
Methods:
This retrospective cohort analysis included 43,943 adults undergoing 52,529 inpatient surgeries at a single institution during a five-year period. Random forest machine learning models in the validated MySurgeryRisk platform made patient-level predictions for seven postoperative complications and mortality occurring during hospital admission using electronic health record data and patient neighborhood characteristics. For each outcome, one model trained with preoperative data alone; one model trained with both preoperative and intraoperative data. Models were compared by accuracy, discrimination (expressed as AUROC: area under the receiver operating characteristic curve), precision (expressed as AUPRC: area under the precision-recall curve), and reclassification indices.
Results:
Machine learning models incorporating both preoperative and intraoperative data had greater accuracy, discrimination, and precision than models using preoperative data alone for predicting all seven postoperative complications (intensive care unit length of stay >48 hours, mechanical ventilation >48 hours, neurological complications including delirium, cardiovascular complications, acute kidney injury, venous thromboembolism, and wound complications) and in-hospital mortality (accuracy: 88% vs. 77%, AUROC: 0.93 vs. 0.87, AUPRC: 0.21 vs. 0.15). Overall reclassification improvement was 2.4–10.0% for complications and 11.2% for in-hospital mortality.
Conclusions:
Incorporating both preoperative and intraoperative data significantly increased the accuracy, discrimination, and precision of machine learning models predicting postoperative complications and mortality.
Keywords: Surgery, machine learning, complications, intraoperative, risk prediction
Introduction
Predicting postoperative complications in the preoperative setting better informs the surgeon’s decision to offer an operation as well as the patient’s decision to undergo surgery. These predictions can also guide targeted risk-reduction strategies (i.e., prehabilitation) for modifiable risk factors, plans for postoperative triage and resource use, and expectations regarding short- and long-term functional recovery. Online risk calculators, mobile device applications, and automated predictive analytic platforms can be easily accessed to accomplish these goals.(1–4) However, these models often ignore intraoperative data, and thereby miss potentially important opportunities to generate updated predictions that can further inform future decisions regarding postoperative triage, surveillance for complications, and targeted preventative measures (e.g., renal protection bundles for patients at high risk for acute kidney injury (AKI) and continuous cardiorespiratory monitoring for patients at high risk for cardiovascular complications).
Although it seems logical and advantageous to use intraoperative data in predicting postoperative complications, this advantage remains theoretical until establishing that predictive performance improves with the incorporation of intraoperative data. Furthermore, we would hope that these enhanced predictions could translate into better decisions and outcomes for patients undergoing surgery. This study addresses the former objective by first quantifying the added value of intraoperative data for predicting seven postoperative complications and mortality with a MySurgeryRisk extension that incorporates vital sign and mechanical ventilator data collected during surgery. The original MySurgeryRisk platform uses electronic health record (EHR) data and patient neighborhood characteristics to predict postoperative complications and mortality, but ignores intraoperative data.(4) We hypothesized that accuracy, discrimination, and precision in predicting postoperative complications and mortality would improve when using both preoperative and intraoperative data input features compared with preoperative data alone.
Materials and Methods
We created a single-center longitudinal cohort of surgical patients with data from preoperative, intraoperative, and postoperative phases of care. We used random forest machine learning models to predict seven major postoperative complications and death during admission, comparing models using preoperative data (i.e. EHR and patient neighborhood characteristics) alone versus models using the same preoperative data plus intraoperative physiological time-series vital sign and mechanical ventilator data. The University of Florida Institutional Review Board and Privacy Office approved this study with waiver of informed consent (IRB #201600223).
Data Source
The University of Florida Integrated Data Repository was used as an honest broker to assemble a single center longitudinal perioperative cohort for all patients admitted to the University of Florida Health for longer than 24 hours following any type of operative procedure between June 1st, 2014 through March 1st, 2019 by integrating electronic health records with other clinical, administrative, and public databases as previously described.(4) The resulting dataset included detailed information on patient demographics, diagnoses, procedures, outcomes, comprehensive hospital charges, hospital characteristics, insurance status, laboratory, pharmacy, and blood bank data as well as detailed intraoperative physiologic and monitoring data for the cohort.
Participants
We identified all patients with age 18 years or greater and excluded patients who died during surgery and had incomplete records. If patients underwent multiple surgeries during one admission, only the first surgery was used in our analysis. The final cohort consisted of 43,943 patients undergoing 52,529 surgeries. Supplemental Digital Content 1 illustrates derivation of the study population. Supplemental Digital Content 2 illustrates cohort use and purpose.
Outcomes
We modeled risk for developing seven postoperative complications and mortality occurring during the index hospital admission. Complications included intensive care unit (ICU) length of stay >48 hours, mechanical ventilation >48 hours, neurological complications including delirium, cardiovascular complications, acute kidney injury, venous thromboembolism, and wound complications.
Predictor Features
The risk assessment used 367 demographic, socioeconomic, comorbidity, medication, laboratory value, operative, and physiological variables from preoperative and intraoperative phases of care. The preoperative model used 134 variables; an additional 233 intraoperative features were added to develop postoperative models. We derived preoperative comorbidities from International Classification of Diseases (ICD) codes to calculate Charlson comorbidity indices.(5) We modeled primary procedure type on ICD-9-CM codes with a forest structure in which nodes represented groups of procedures, roots presented the most general groups of procedures, and leaf nodes represented specific procedures. Medications were derived from RxNorm codes grouped into drug classes as previously described.(4) We converted intraoperative time series data into statistical features such as minimum, maximum, mean, and short- and long-term variability.(6) Intraoperative data input features that were added to preoperative features to generate the postoperative model included heart rate, systolic blood pressure, diastolic blood pressure, body temperature, respiratory rate, minimum alveolar concentration (MAC), positive end-expiratory pressure (PEEP), peak inspiratory pressure (PIP), fraction of inspired oxygen (FiO2), blood oxygen saturation (SpO2), and end-tidal carbon dioxide (EtCO2). The time series features are then used to produce statistical features such as minimum, maximum, average, long term variability, short term variability, duration of measurement, counts of readings in certain value ranges decided based on average and standard deviation of the measurements of overall datasets. We also included surgical variables (e.g., nighttime surgery, surgery duration, operative blood loss, and urine output) during surgery. Supplemental Digital Content 3 lists all input features and their statistical characteristics. Supplemental Digital Content 4 lists the percentages of missing values for each variable in the training and testing cohorts.
Sample Size
Models were trained on a development cohort of 40,560 surgeries. All results were reported from a validation cohort of 11,969 surgeries. We performed five-fold cross-validation using random partitions to generate five disjoint folds, allocating one fold for validation and the other four for training. Using a validation cohort of 11,969 surgeries, the overall sample size allows for a maximum width of the 95% confidence interval for area under the receiver operating characteristic curve (AUROC) to be between 0.02 to 0.04 for postoperative complications with prevalence ranging between 5% and 30% for AUROC of 0.80 or higher. The sample size allows for a maximum width of 0.07 for hospital mortality given 2% prevalence.
Predictive Analytic Workflow
The proposed MySurgeryRisk PostOp algorithm is conceptualized as a dynamic model that readjusts preoperative risk predictions using physiological time series and other data collected during surgery. The resulting adjusted postoperative risk is assessed immediately at the end of surgery. This workflow simulates clinical tasks faced by physicians involved in perioperative care where patients’ preoperative information is subsequently enriched by the influx of new data from the operating room. The final output produces MySurgeryRisk PostOp, a personalized risk panel for complications after surgery with both preoperative and immediate postoperative risk assessments. The algorithm consists of two main layers, preoperative and intraoperative, each containing a data transformer core and a data analytics core.(4) Details regarding MySurgeryRisk predictive analytic workflow are provided in Supplemental Digital Content 5. Briefly, the MySurgeryRisk platform uses a data transformer to integrate data from multiple sources, including the EHR with zip code links to US Census data for patient neighborhood characteristics and distance from the hospital, and optimizes the data for analysis through preprocessing, feature transformation, and feature selection techniques. In the data analytics core, the MySurgeryRisk PostOp algorithm was trained to calculate patient-level immediate postoperative risk probabilities for selected complications using all available preoperative and intraoperative data with random forest classifiers.(7) We chose random forest methods to maintain consistency with previous work with the original MySurgeryRisk model.(4) This work also describes our methods for reducing data dimensionality. Random forest models are composed of an assembly of decision trees (i.e., a forest of trees). Each decision tree performs a classification or prediction task; the most common class (i.e., majority vote) or average prediction is then identified. Supplemental Digital Content 6 lists allowable ranges for continuous variables, determined by clinical expertise. Figure 1 illustrates our method for building the random forest machine learning models and model analytic flow.
Figure 1: Conceptual diagram of the MySurgeryRisk PostOp platform.
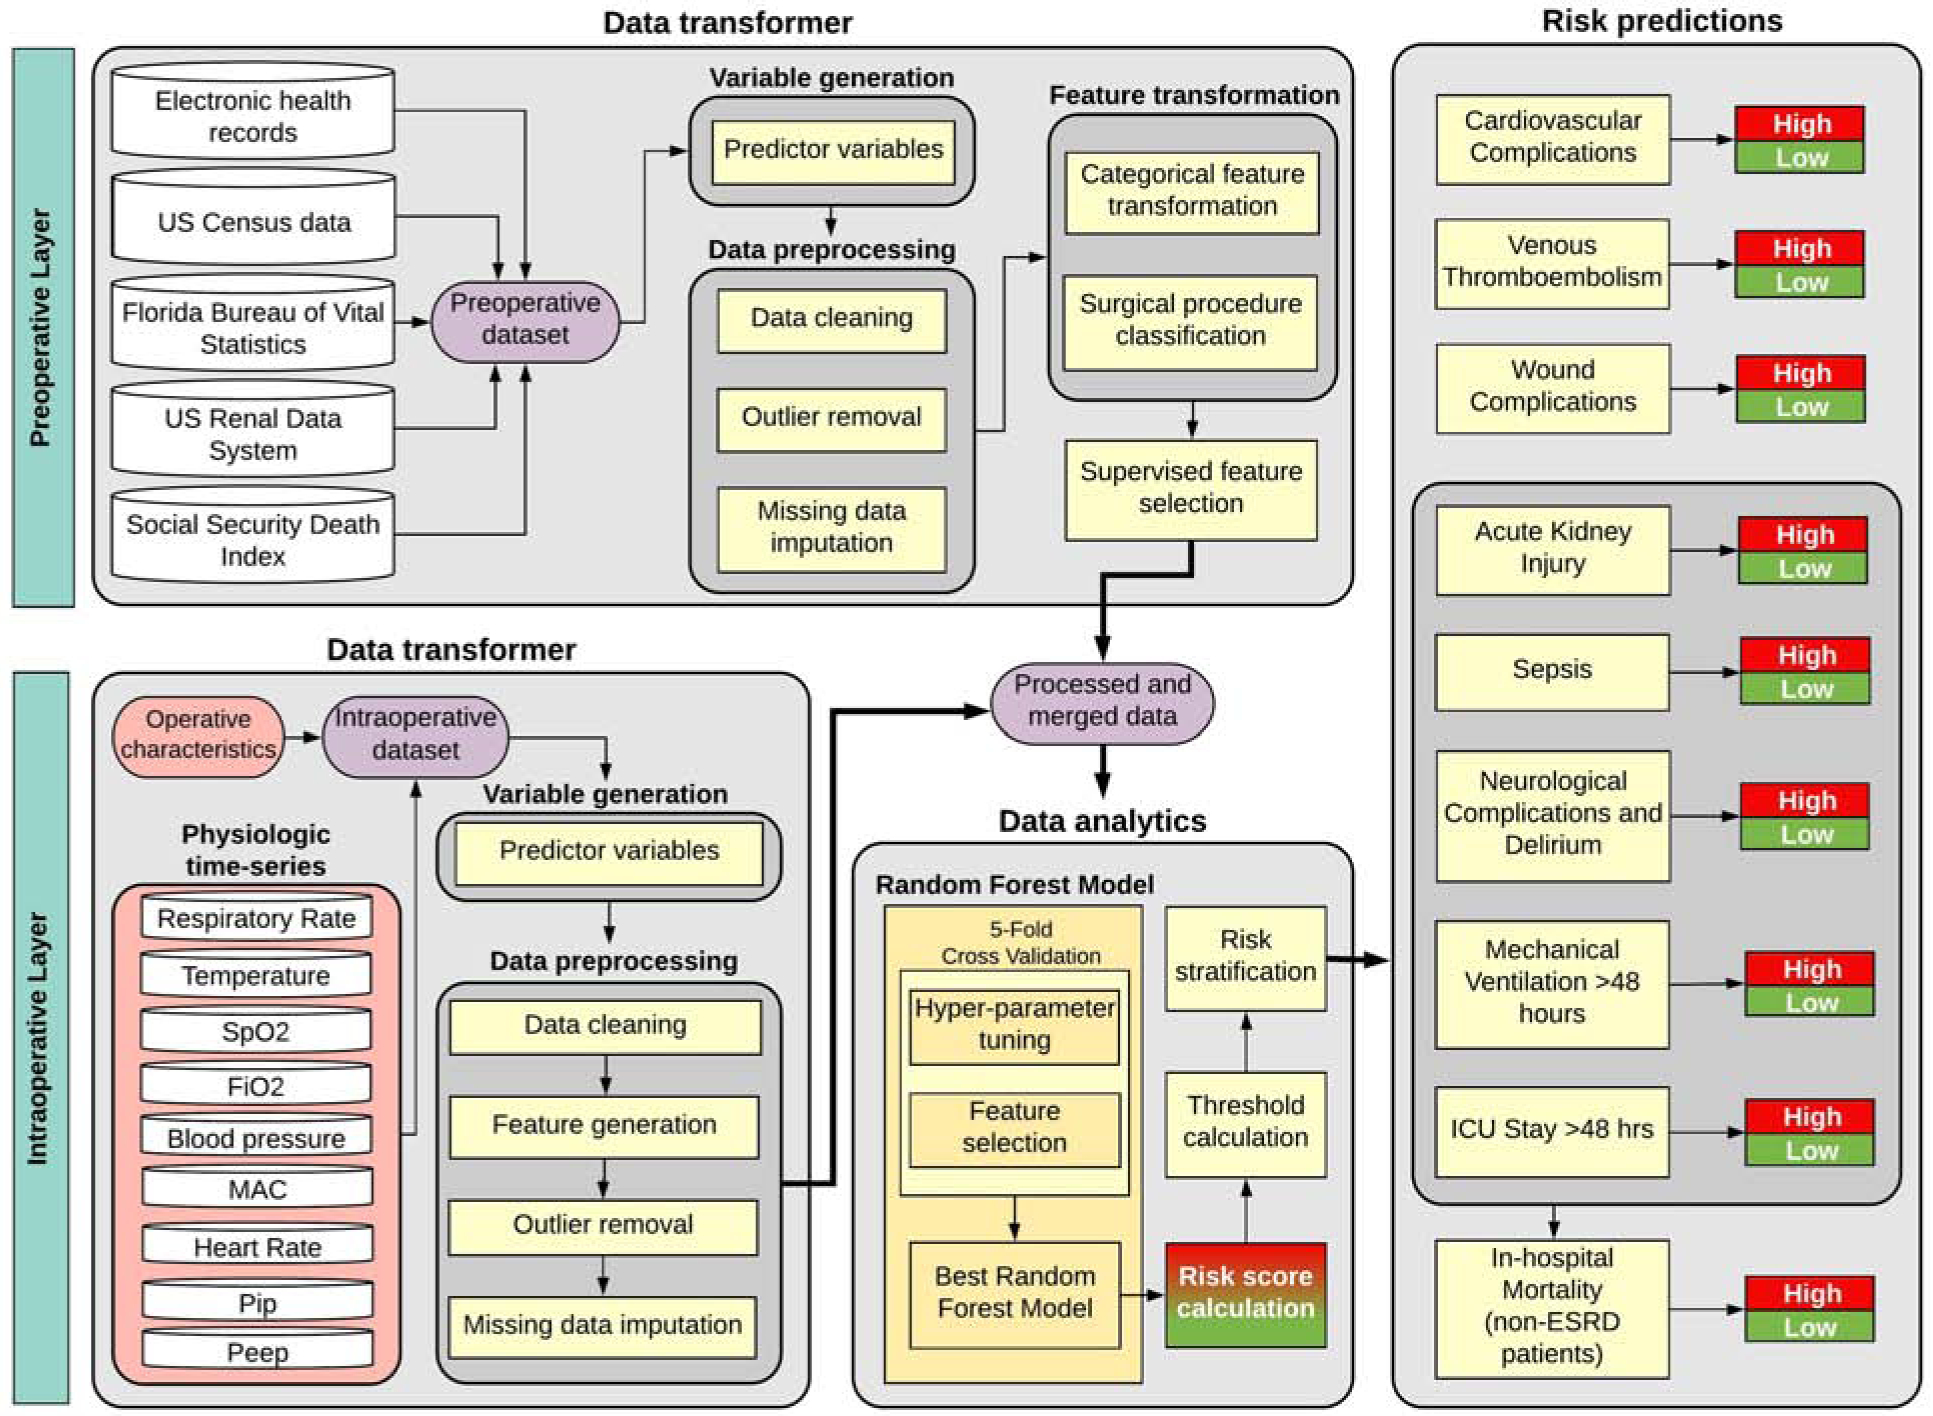
This diagram illustrates the aggregation of data transformers for both preoperative and intraoperative layers, merging clean features from both layers to feed a data analytics module that produces risk predictions. The preoperative models use the same framework, but without the intraoperative layer.
Model Validation
Results are reported from application of the trained model to the test cohort, with 10,637 unique patients undergoing 11,969 surgeries from March 1st, 2018 through March 1st, 2019 time period. Using the prediction results obtained from the 1000 bootstrap cohorts, nonparametric confidence intervals for each of the performance metrics were calculated.
Model Performance
We assessed each model’s discrimination using AUROC. For each complication, we calculated Youden’s index threshold to identify the point on the receiver operating characteristic curve with the highest combination of sensitivity and specificity, using this point as the cut-off value for low versus high risk.(8) We used these cut-off values to determine the fraction of correct classifications as well as sensitivity, specificity, positive predictive value, and negative predictive value for each model. When rare events are being predicted, a model can have high accuracy by favoring negative predictions in a predominantly negative dataset.(9) False negative predictions of complications are particularly harmful because patients and their caregivers may consent to an operation under the pretense of an overly optimistic postoperative prognosis, as well as missing opportunities for any preoperative mitigation of risk factors through prehabilitation and other optimization strategies. Additionally, the appropriate escalation in levels of monitoring and patient care may be missed with false negative findings. Therefore, model performance was also evaluated by calculating area under the precision-recall curve (AUPRC), which is well-suited for evaluating rare event predictive performance.(10) To assess the statistical significance of AUROC, AUPRC, and accuracy differences between models, we performed Wilcoxon’s Sign-Ranked test.(11) We used bootstrap sampling and non-parametric methods to obtain 95% confidence intervals for all performance metrics. We used the Net Reclassification Improvement (NRI) index to quantify how well the postoperative model reclassified patients compared with the preoperative model.(12)
Results
Participant Baseline Characteristics and Outcomes
Table 1 lists subject characteristics of primary interest. Supplemental Digital Content 7 lists all additional subject characteristics used to build the models. Approximately 49% of the population was female. Average age was 57 years. The incidence of complications in the testing cohort was as follows: 28% for prolonged ICU stay, 6% for mechanical ventilation for >48 hours, 20% for neurological complications and delirium, 18% for acute kidney injury, 19% for cardiovascular complications, 8% for venous thromboembolism, 25% for wound complications, and 2% for in-hospital mortality. The distribution of outcomes did not significantly differ between training and testing cohorts, as listed in Table 1.
Table 1:
Characteristics of training and testing cohorts.
| Training | Testing | ||
|---|---|---|---|
| Date ranges | June 2014-Feb 2018 (n=40560) |
March 2018-Feb 2019 (n=11969) |
|
| Average age (years) | 56.5 | 57.5 | |
| Ethnicity, n (%) | Not Hispanic | 38116 (93.9) | 11210 (93.6) |
| Hispanic | 1772 (4.4) | 599 (5) | |
| Missing | 717 (1.8) | 171 (1.4) | |
| Race, n (%) | White | 31399 (77.3) | 9376 (78.3) |
| African American | 6136 (15.1) | 1739 (14.5) | |
| Other | 2483 (6.1) | 702 (5.9) | |
| Missing | 587 (1.5) | 163 (1.4) | |
| Gender, n (%) | Male | 20614 (50.8) | 6072 (50.7) |
| Female | 19991 (49.2) | 5908 (49.3) | |
| Primary Insurance, n (%) | Medicare | 18581 (45.8) | 5774 (48.2) |
| Private | 12463 (30.7) | 3308 (27.6) | |
| Medicaid | 6577 (16.2) | 1928 (16.1) | |
| Uninsured | 2984 (7.4) | 970 (8.1) | |
| Outcomes, n (%) | ICU Stay > 48 hours | 10355 (25.5) | 3408 (28.5) |
| MV Duration > 48 hours | 2372 (5.9) | 767 (6.4) | |
| Neurological Complications and Delirium | 5860 (14.5) | 2364 (19.8) | |
| Acute Kidney Injury | 6098 (15) | 2111 (17.6) | |
| Cardiovascular Complication | 5866 (14.5) | 2240 (18.7) | |
| Venous Thromboembolism | 2283 (5.6) | 943 (7.9) | |
| Wound | 7548 (18.6) | 3044 (25.4) | |
| Hospital Mortalitya | 192 (2.3) | 93 (2.6) |
Models for hospital mortality were developed using 8,378 surgeries and validated using 3,591surgeries among 11,969 surgeries in the test cohort.
Model Performance
Compared with the model using preoperative data alone, the postoperative model using both preoperative and intraoperative data had higher accuracy, AUROC, and AUPRC for all complications and mortality predictions, as described below and in Table 2. The net reclassification index as well as event, non-event, and overall classification improvements for each outcome are listed in Table 3. Figures 2–9 illustrate predictive performance for individual complications and mortality. Figures include gray regions for which predictive discrimination or precision are ≤0.2, precluding reasonable clinical application. In addition, feature weights from the best performing model for each complication are provided in Supplemental Digital Content 6, along with feature names and descriptions.
Table 2:
Performance metrics for predicting postoperative complications and mortality using preoperative input data alone versus preoperative and intraoperative input data in a postoperative model.
| Complication | Model | Sensitivity | Specificity | NPV | PPV | Accuracy | AUROC | AUPRC |
|---|---|---|---|---|---|---|---|---|
| ICU Stay > 48 hours | Preoperative | 0.82 (0.81–0.83) | 0.74 (0.74–0.75) | 0.91 (0.91–0.92) | 0.56 (0.55–0.57) | 0.77 (0.76–0.77) | 0.87 (0.86–0.87) | 0.72 (0.71–0.74) |
| Postoperative | 0.75 (0.73–0.76) | 0.87 (0.86–0.87) | 0.90 (0.89–0.90) | 0.69 (0.68–0.70) | 0.83 (0.83–0.84) | 0.88 (0.88–0.89) | 0.80 (0.78–0.81) | |
| MV Duration > 48 hours | Preoperative | 0.80 (0.78–0.82) | 0.82 (0.82–0.83) | 0.98 (0.98–0.99) | 0.24 (0.22–0.25) | 0.82 (0.81–0.83) | 0.89 (0.87–0.89) | 0.45 (0.42–0.48) |
| Postoperative | 0.91 (0.89–0.93) | 0.92 (0.92–0.92) | 0.99 (0.99–1.00) | 0.45 (0.41–0.45) | 0.92 (0.91–0.92) | 0.96 (0.95–0.97) | 0.71 (0.68–0.74) | |
| Neurological Complications and Delirium | Preoperative | 0.79 (0.77–0.80) | 0.78 (0.77–0.78) | 0.94 (0.93–0.94) | 0.47 (0.45–0.48) | 0.78 (0.77–0.79) | 0.86 (0.85–0.87) | 0.64 (0.63–0.66) |
| Postoperative | 0.81 (0.80–0.82) | 0.81 (0.80–0.82) | 0.95 (0.94–0.95) | 0.51 (0.49–0.53) | 0.81 (0.79–0.82) | 0.89 (0.88–0.89) | 0.69 (0.67–0.71) | |
| Acute Kidney Injury | Preoperative | 0.80 (0.79–0.82) | 0.67 (0.66–0.67) | 0.94 (0.93–0.94) | 0.34 (0.33–0.35) | 0.69 (0.68–0.70) | 0.81 (0.80–0.82) | 0.47 (0.45–0.49) |
| Postoperative | 0.71 (0.70–0.72) | 0.8 (0.79–0.82) | 0.93 (0.93–0.93) | 0.44 (0.42–0.46) | 0.79 (0.78–0.80) | 0.84 (0.83–0.85) | 0.57 (0.55–0.59) | |
| Cardiovascular Complication | Preoperative | 0.78 (0.76–0.80) | 0.69 (0.67–0.69) | 0.93 (0.92–0.94) | 0.36 (0.35–0.37) | 0.70 (0.69–0.71) | 0.80 (0.79–0.81) | 0.51 (0.49–0.53) |
| Postoperative | 0.8 (0.76–0.81) | 0.77 (0.74–0.83) | 0.94 (0.93–0.94) | 0.45 (0.41–0.51) | 0.78 (0.76–0.82) | 0.87 (0.86–0.88) | 0.66 (0.64–0.68) | |
| Venous Thromboembolism | Preoperative | 0.79 (0.76–0.79) | 0.69 (0.69–0.72) | 0.97 (0.97–0.98) | 0.18 (0.17–0.20) | 0.70 (0.69–0.73) | 0.80 (0.79–0.82) | 0.25 (0.23–0.28) |
| Postoperative | 0.76 (0.74–0.79) | 0.75 (0.73–0.75) | 0.97 (0.97–0.98) | 0.21 (0.19–0.22) | 0.75 (0.74–0.75) | 0.83 (0.81–0.84) | 0.28 (0.26–0.31) | |
| Wound | Preoperative | 0.69 (0.69–0.72) | 0.66 (0.60–0.68) | 0.86 (0.86–0.87) | 0.41 (0.38–0.43) | 0.67 (0.63–0.68) | 0.74 (0.73–0.75) | 0.50 (0.48–0.52) |
| Postoperative | 0.66 (0.64–0.67) | 0.70 (0.70–0.71) | 0.86 (0.85–0.87) | 0.43 (0.42–0.45) | 0.69 (0.69–0.70) | 0.75 (0.74–0.76) | 0.52 (0.50–0.54) | |
| In-hospital Mortality | Preoperative | 0.83 (0.73–0.87) | 0.76 (0.78–0.80) | 0.99 (0.99–1.00) | 0.09 (0.08–0.11) | 0.77 (0.77–0.80) | 0.87 (0.84–0.90) | 0.15 (0.12–0.20) |
| Postoperative | 0.85 (0.80–0.91) | 0.88 (0.86–0.88) | 1.00 (0.99–1.00) | 0.16 (0.13–0.18) | 0.88 (0.86–0.88) | 0.93 (0.91–0.95) | 0.21 (0.17–0.27) |
ICU: intensive care unit, MV: mechanical ventilation NPV: negative predictive value, PPV: positive predictive value, AUROC: area under the receiver operating characteristic curve, AUPRC: area under the precision-recall curve.
Table 3:
Net Reclassification Index (NRI) and classification improvement indices for predicting postoperative complications and mortality with preoperative and intraoperative input data relative to preoperative input data alone.
| Classification Improvement (%) | |||||
|---|---|---|---|---|---|
| Complication | NRI (95% CI) | p | Event | Non-Event | Overall |
| ICU stay > 48 hours | 0.05 (0.03–0.06) | <0.001 | −7.9 | 12.6 | 6.8 |
| MV duration > 48 hours | 0.21 (0.16–0.22) | <0.001 | 10.9 | 9.9 | 10.0 |
| Neurological Complications and Delirium | 0.05 (0.03–0.07) | <0.001 | 2.1 | 3.1 | 2.9 |
| Acute Kidney Injury | 0.05 (0.04–0.07) | <0.001 | −8.7 | 13.9 | 9.9 |
| Cardiovascular Complication | 0.12 (0.1–0.12) | <0.001 | 2.3 | 9.2 | 7.9 |
| Venous Thromboembolism | 0.03 (0.04–0.06) | 0.09 | −2.7 | 5.6 | 4.9 |
| Wound Complication | 0.02 (0.01–0.04) | 0.14 | −2.5 | 4.1 | 2.4 |
| Hospital Mortality | 0.14 (0.06–0.21) | 0.024 | 2.2 | 11.5 | 11.2 |
CI: confidence interval, ICU: intensive care unit, MV: mechanical ventilation.
Figure 2: A model using both preoperative and intraoperative data outperformed a model using preoperative data alone in predicting postoperative ICU stay >48 hours.
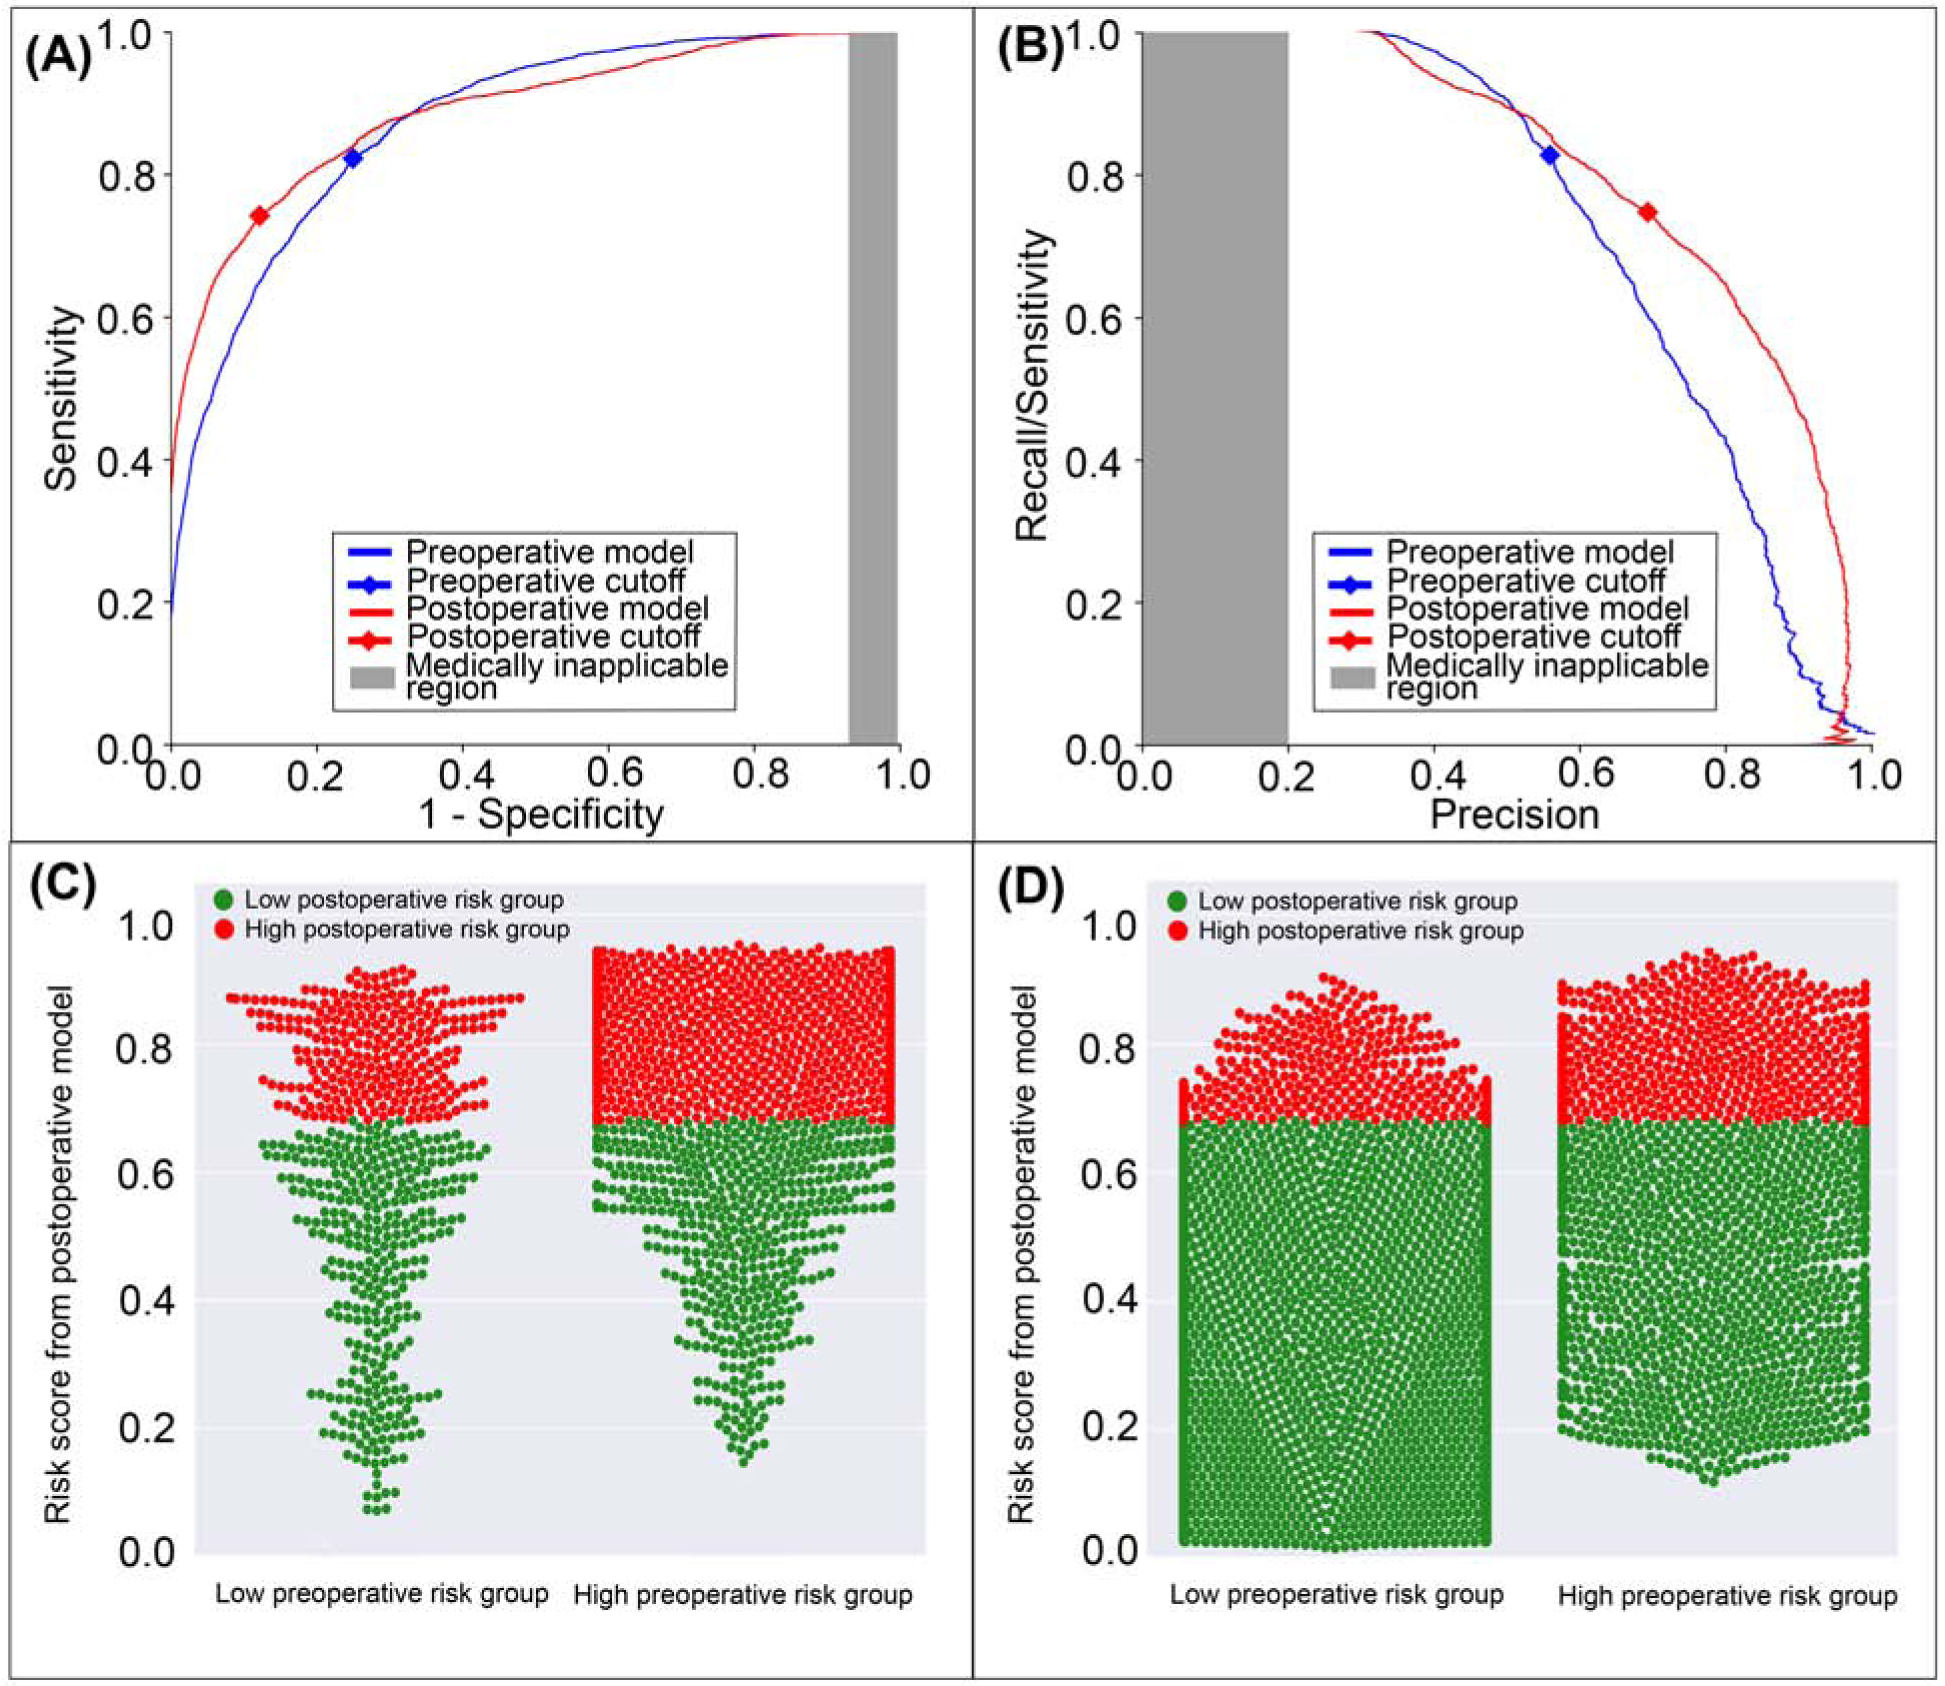
A: The postoperative model had greater area under the receiver operating characteristic curve (0.88 vs. 0.87). B: The postoperative model had greater area under the precision-recall curve (0.80 vs. 0.72). The postoperative model reclassified cases that did (C) and did not (D) feature prolonged ICU stays. Red dots are patients at high-risk for prolonged ICU stay according to the postoperative model; green dots are patients at low-risk. C, D: The postoperative model correctly reclassified 6.8% of all cases. Gray areas represent regions for which predictive discrimination or precision are ≤0.2, precluding reasonable clinical application.
Figure 9: A model using both preoperative and intraoperative data outperformed a model using preoperative data alone in predicting postoperative hospital mortality.
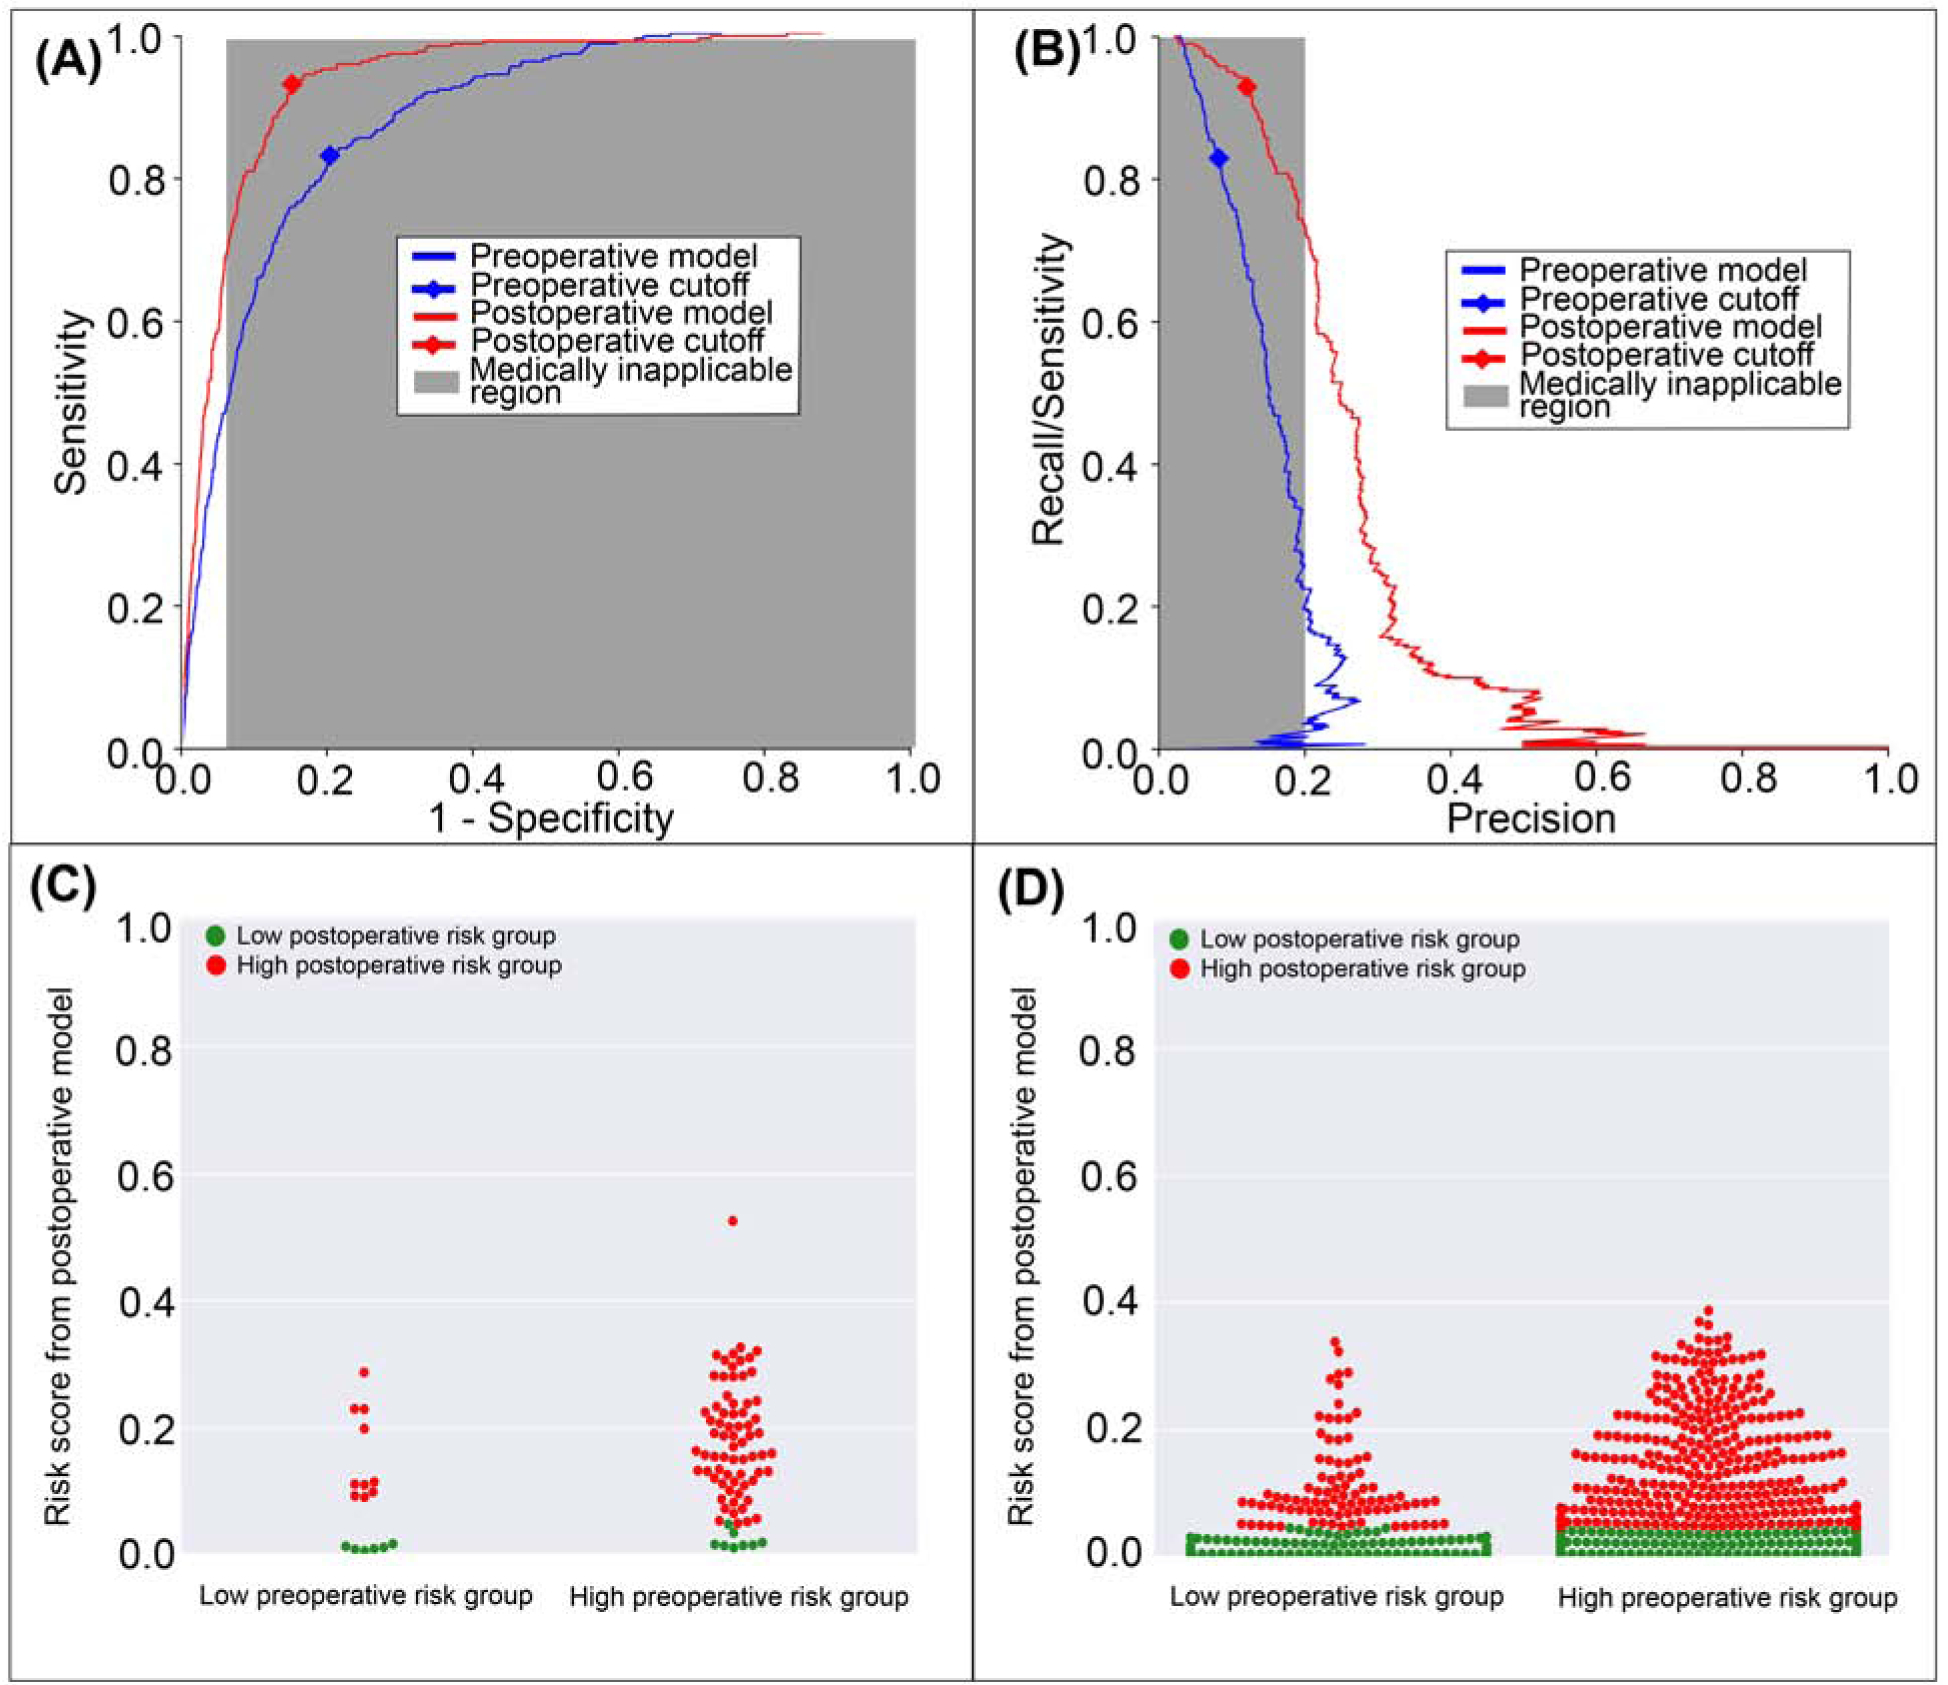
A: The postoperative model had greater area under the receiver operating characteristic curve (0.93 vs. 0.87). B: The postoperative model had greater area under the precision-recall curve (0.21 vs. 0.15). The postoperative model reclassified cases that did (C) and did not (D) feature in-hospital mortality. Red dots are patients at high-risk for mortality according to the postoperative model; green dots are patients at low-risk. C, D: The postoperative model correctly reclassified 11.2% of all cases. Gray areas represent regions for which predictive discrimination or precision are ≤0.2, precluding reasonable clinical application.
Prolonged ICU Stay
The postoperative model achieved greater accuracy (0.83 vs. 0.77, p<0.001), discrimination (AUROC 0.88 vs. 0.87, p<0.001), and precision (AUPRC 0.80 vs. 0.72, p<0.001) in predicting ICU stay > 48 hours with greater specificity and positive predictive value at the cost of lower sensitivity (75% vs. 82%, p<0.001) than the model using preoperative data alone (Table 2). The postoperative model misclassified 7.9% of all cases that featured prolonged ICU stays, and correctly reclassified 12.6% of all cases that did not (Figure 2). Overall, there was a 6.8% reclassification improvement by the postoperative model.
Prolonged Mechanical Ventilation
The postoperative model achieved greater accuracy (0.92 vs. 0.82, p<0.001), discrimination (AUROC 0.96 vs. 0.89, p<0.001), and precision (AUPRC 0.71 vs. 0.45, p<0.001) in predicting mechanical ventilation >48 hours with greater sensitivity, specificity, and positive predictive value, and similar negative predictive value compared with the model using preoperative data alone (Table 2). The postoperative model correctly reclassified 11.0% of all cases that featured prolonged mechanical ventilation and 9.9% of all cases that did not (Figure 3). Overall reclassification improvement was 10.0%.
Figure 3: A model using both preoperative and intraoperative data outperformed a model using preoperative data alone in predicting postoperative mechanical ventilation >48 hours.
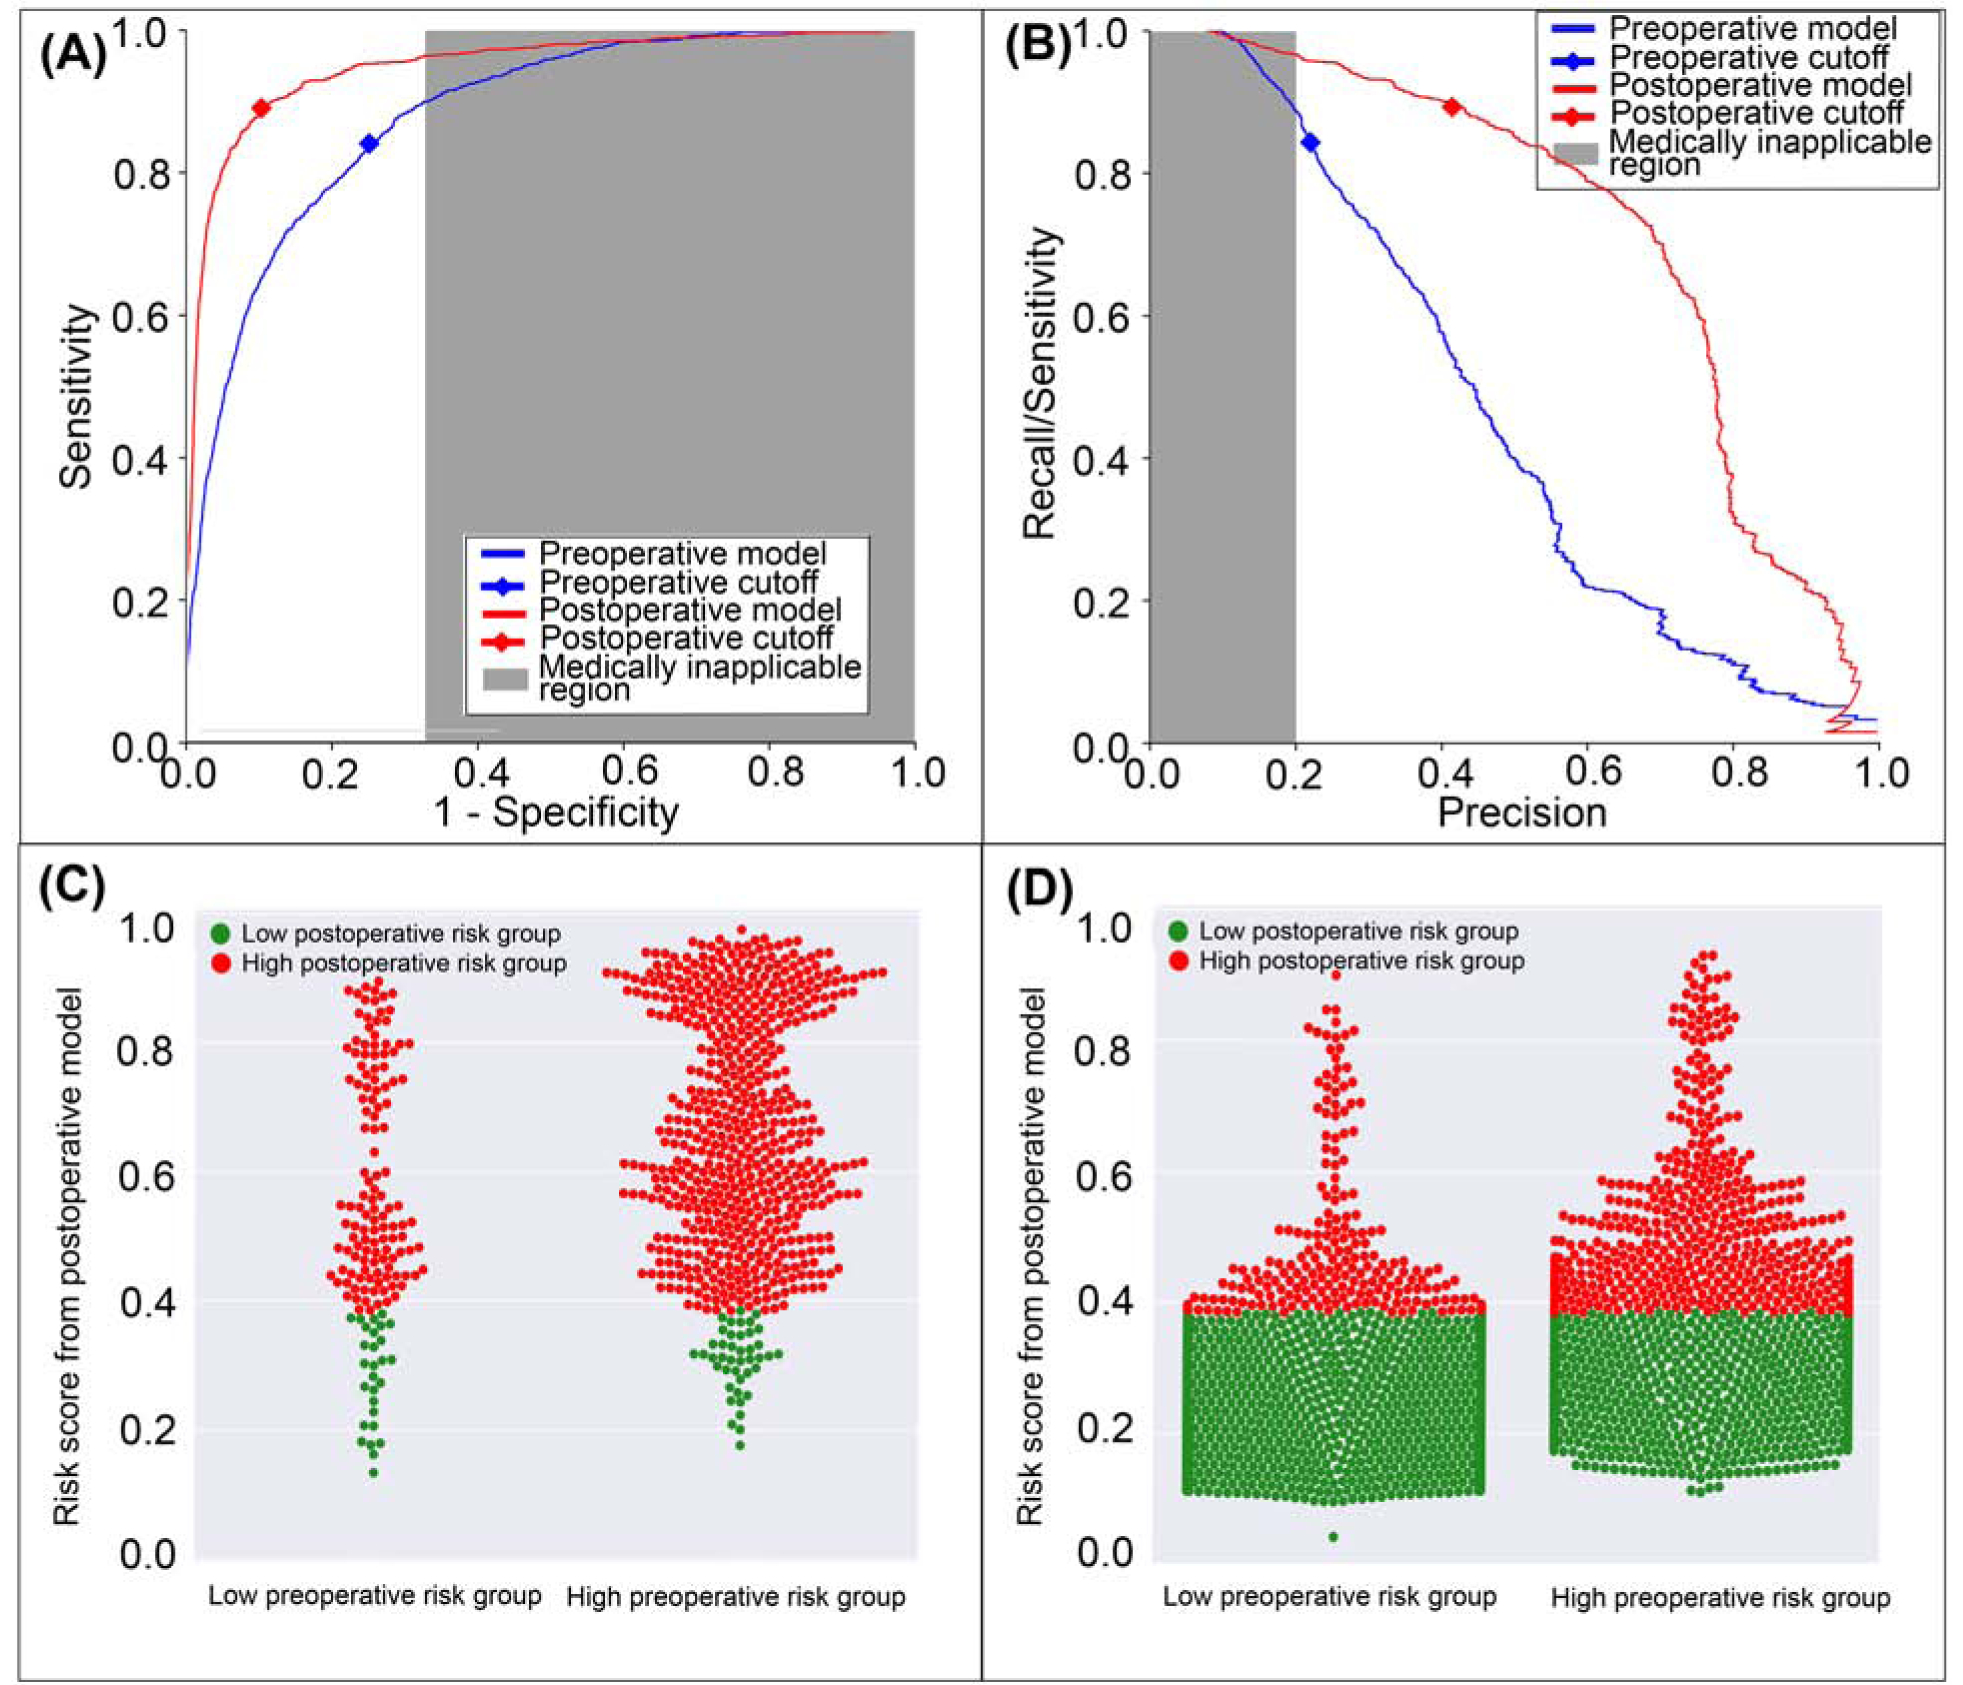
A: The postoperative model had greater area under the receiver operating characteristic curve (0.96 vs. 0.89). B: The postoperative model had greater area under the precision-recall curve (0.71 vs. 0.45). The postoperative model reclassified cases that did (C) and did not (D) feature prolonged mechanical ventilation. Red dots are patients at high-risk prolonged mechanical ventilation according to the postoperative model; green dots are patients at low-risk. C, D: The postoperative model correctly reclassified 10.0% of all cases. Gray areas represent regions for which predictive discrimination or precision are ≤0.2, precluding reasonable clinical application.
Neurological Complications and Delirium
The postoperative model achieved greater accuracy (0.81 vs. 0.78, p<0.001), discrimination (AUROC 0.89 vs. 0.86, p<0.001), and precision (AUPRC 0.69 vs. 0.64, p<0.001) in predicting postoperative neurological complications and delirium with greater specificity, positive predictive value, and negative predictive value than the model limited to preoperative data alone (Table 2). The postoperative model correctly reclassified 2.1% of all cases that featured postoperative neurological complications and delirium and 3.1% of all cases that did not (Figure 4). Overall reclassification improvement was 2.9%.
Figure 4: A model using both preoperative and intraoperative data outperformed a model using preoperative data alone in predicting postoperative neurological complications and delirium.
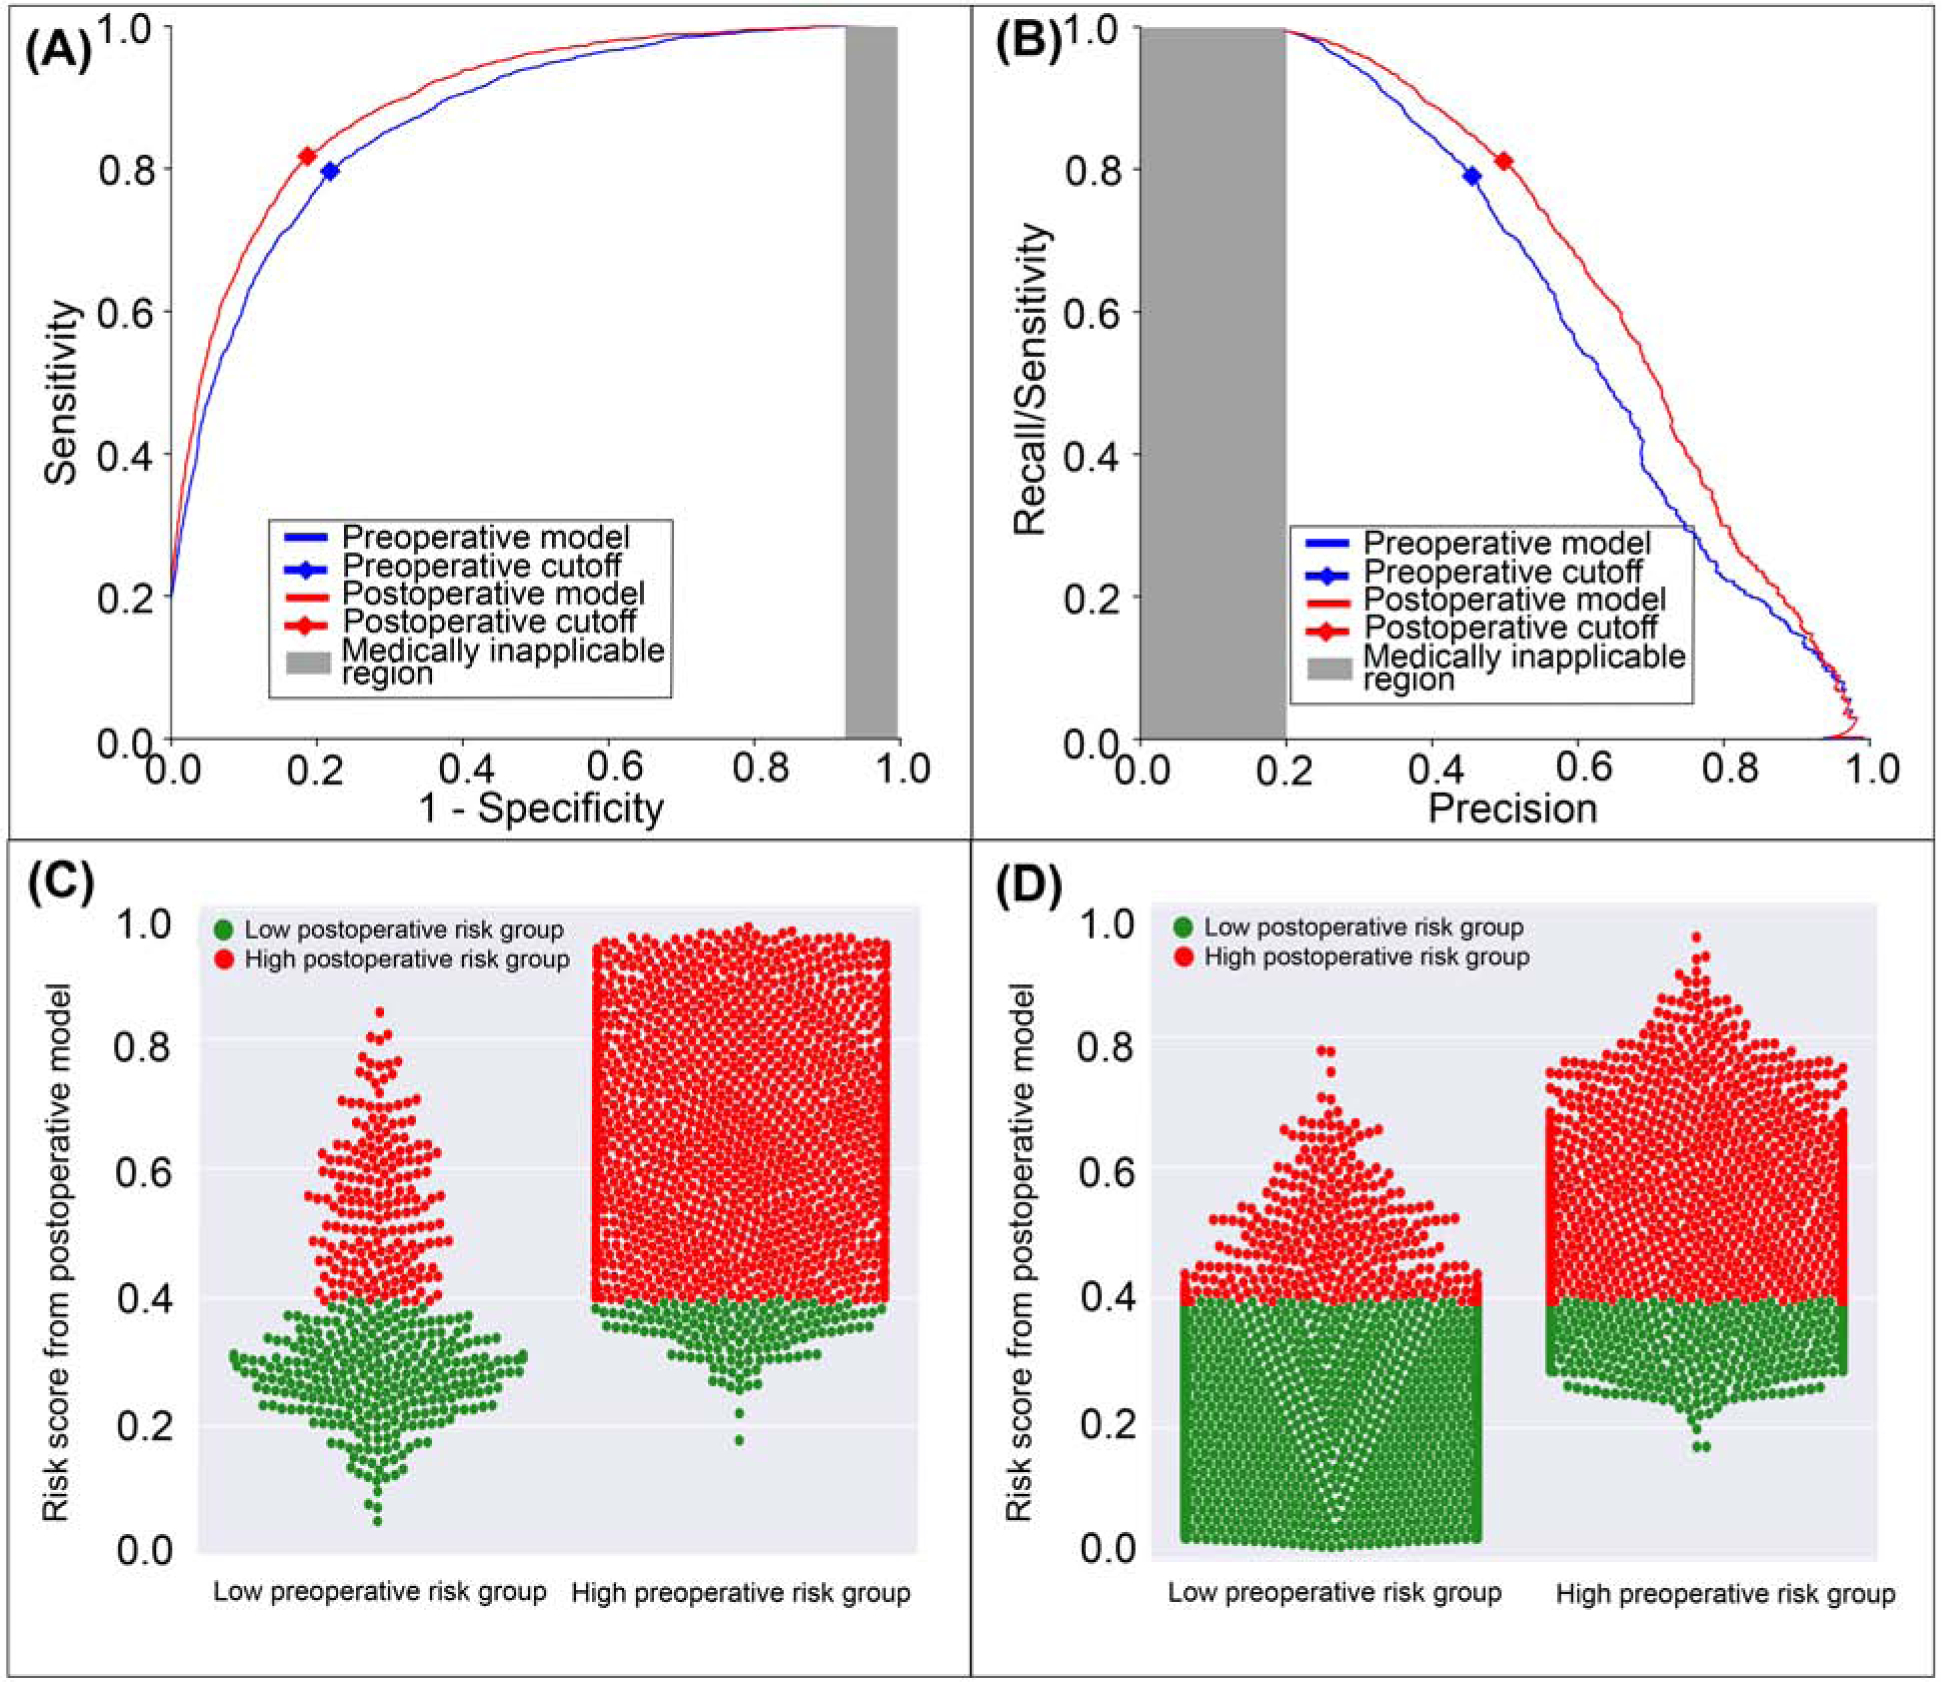
A: The postoperative model had greater area under the receiver operating characteristic curve (0.89 vs. 0.86). B: The postoperative model had greater area under the precision-recall curve (0.69 vs. 0.64). The postoperative model reclassified cases and did (C) and did not (D) feature neurological complications and delirium. Red dots are patients at high-risk for neurological complications and delirium according to the postoperative model; green dots are patient at low-risk. C, D: The postoperative model correctly reclassified 2.9% of all cases. Gray areas represent regions for which predictive discrimination or precision are ≤0.2, precluding reasonable clinical application.
Cardiovascular Complications
The postoperative model achieved greater accuracy (0.78 vs. 0.70, p<0.001), discrimination (AUROC 0.87 vs. 0.80, p<0.001), and precision (AUPRC 0.66 vs. 0.51, p<0.001) in predicting postoperative cardiovascular complications with greater sensitivity, specificity, negative predictive value, and positive predictive value than the model using preoperative data alone (Table 2). The postoperative model correctly reclassified 2.3% of all cases that featured postoperative cardiovascular complications and 9.2% of all cases that did not (Figure 5). Overall, there was 7.9% reclassification improvement by the postoperative model.
Figure 5: A model using both preoperative and intraoperative data outperformed a model using preoperative data alone in predicting postoperative cardiovascular complication.
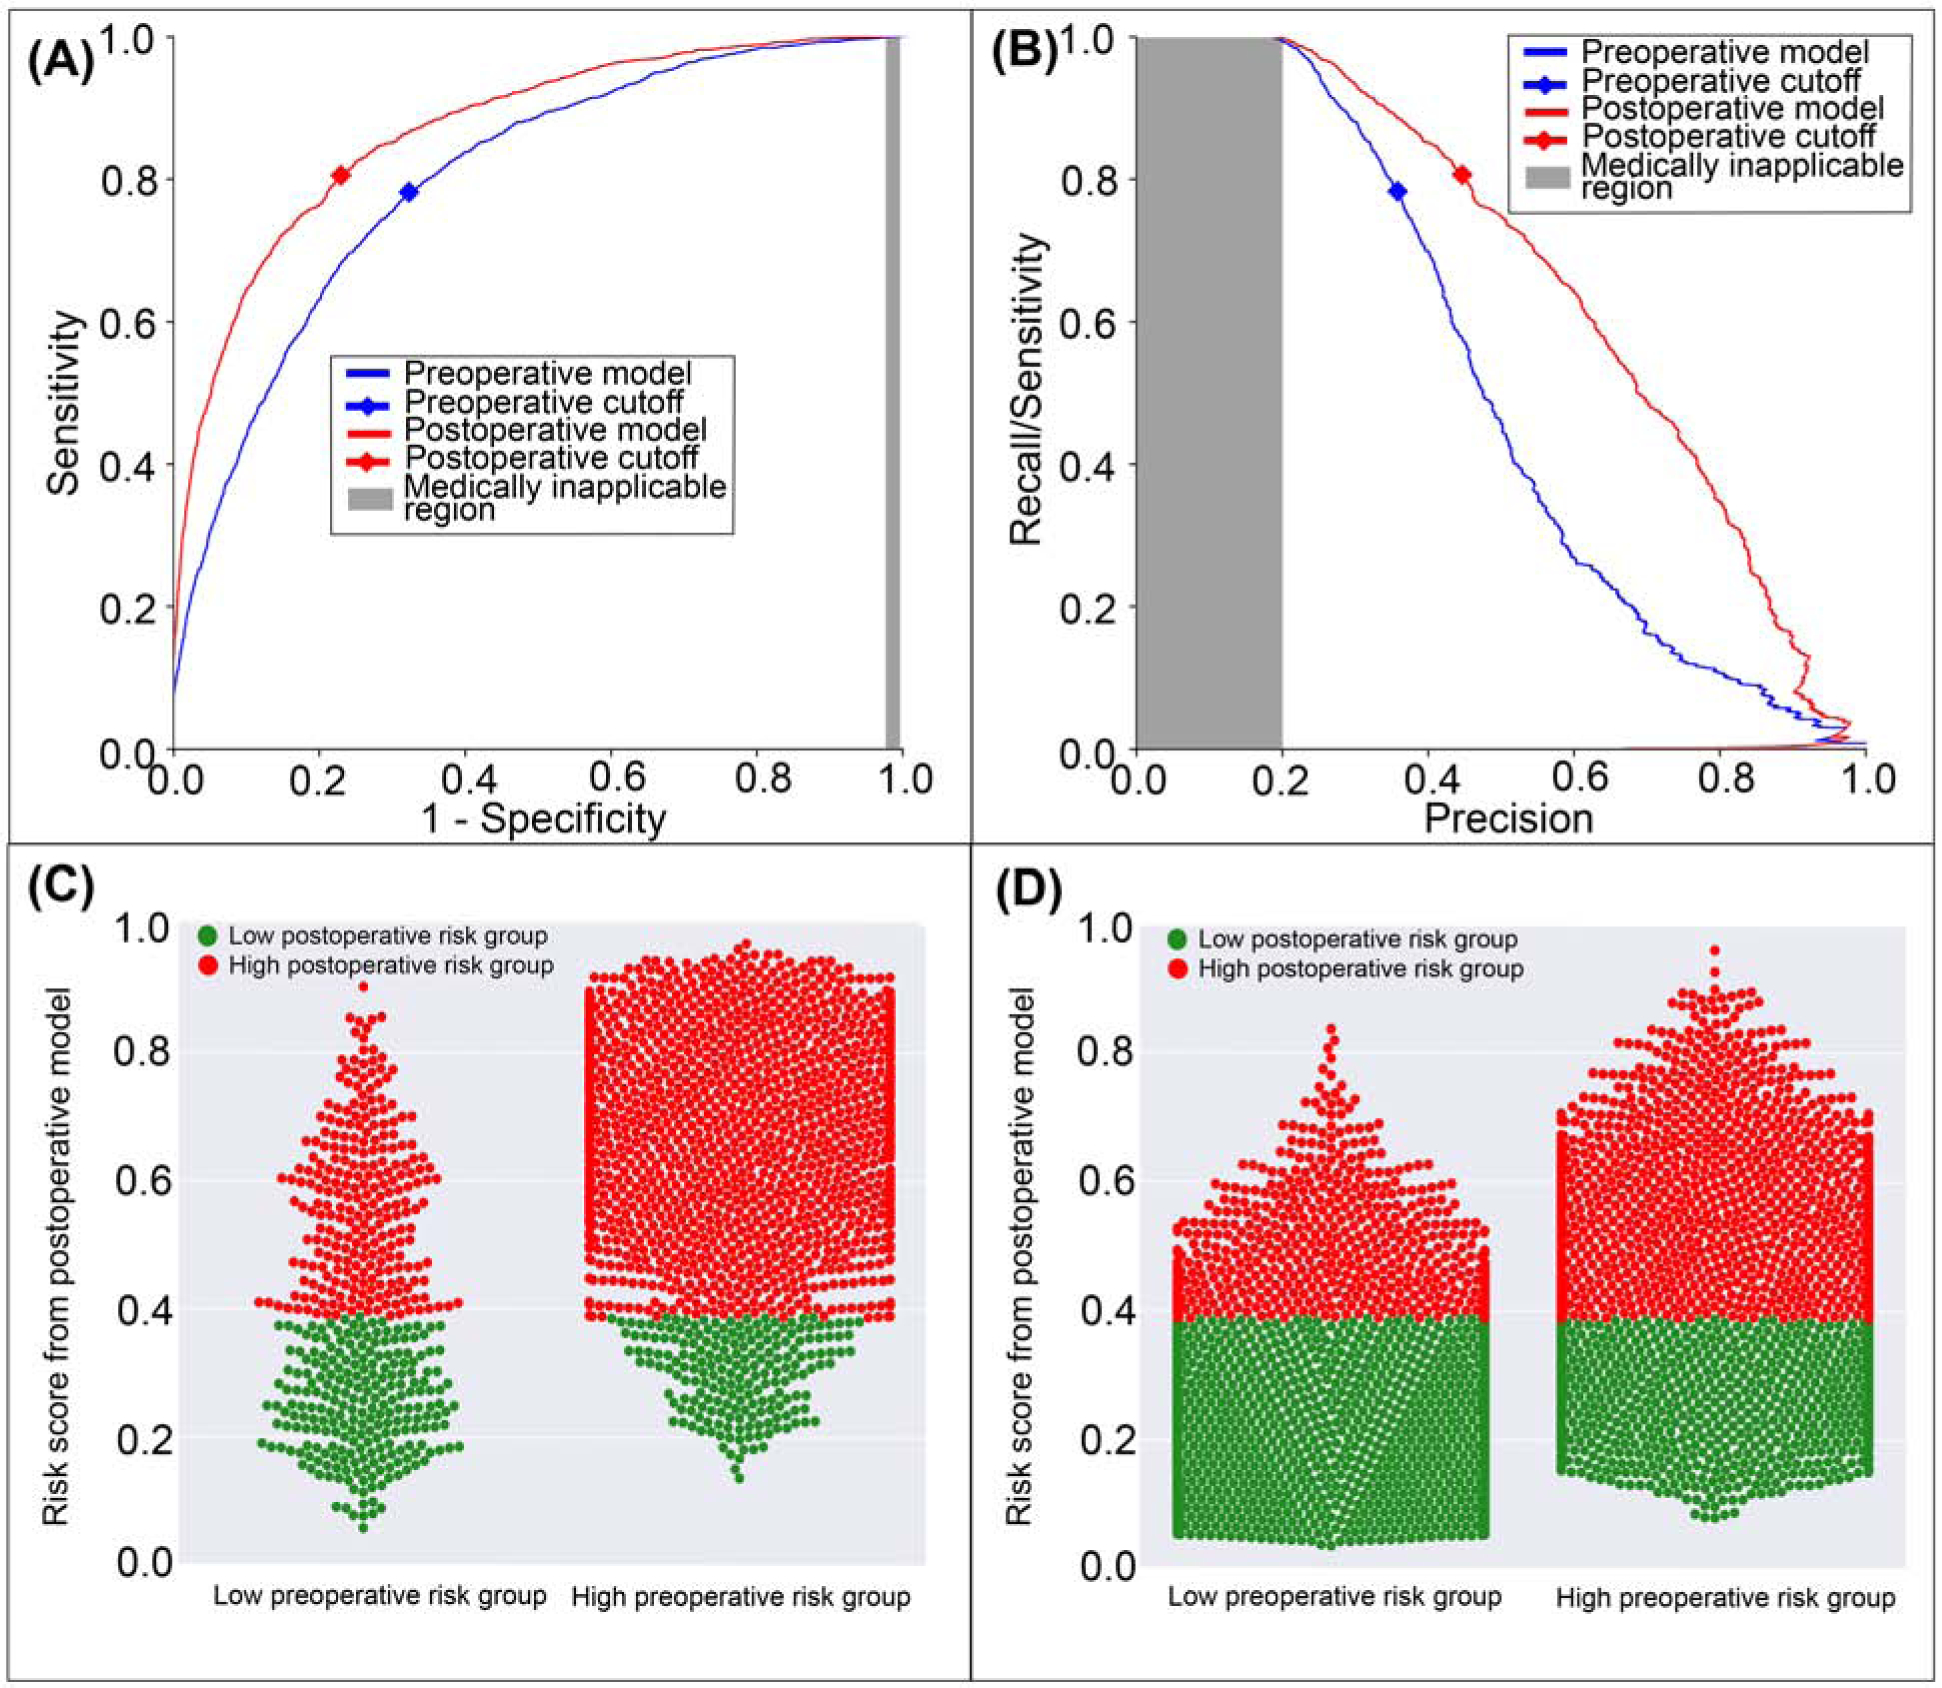
A: The postoperative model had greater area under the receiver operating characteristic curve (0.87 vs. 0.80). B: The postoperative model had greater area under the precision-recall curve (0.66 vs. 0.51). The postoperative model reclassified cases that did (C) and did not (D) feature cardiovascular complications. Red dots are patients at high-risk for cardiovascular complications according to the postoperative model; green dots are patients at low-risk. C, D: The postoperative model correctly reclassified 7.9% of all cases. Gray areas represent regions for which predictive discrimination or precision are ≤0.2, precluding reasonable clinical application.
Acute Kidney Injury
The postoperative model achieved greater accuracy (0.79 vs. 0.69, p<0.001), discrimination (AUROC 0.84 vs. 0.81, p<0.001), and precision (AUPRC 0.57 vs. 0.47, p<0.001) in predicting postoperative AKI with greater specificity and positive predictive value but similar negative predictive value and lower sensitivity (71% vs. 80%, p<0.001) than the model using preoperative data alone (Table 2). The postoperative model misclassified 8.7% of all cases that featured postoperative AKI, but correctly reclassified 13.9% of all cases that did not (Figure 6). Overall, there was 9.9% reclassification improvement by the postoperative model.
Figure 6: A model using both preoperative and intraoperative data outperformed a model using preoperative data alone in predicting postoperative acute kidney injury.
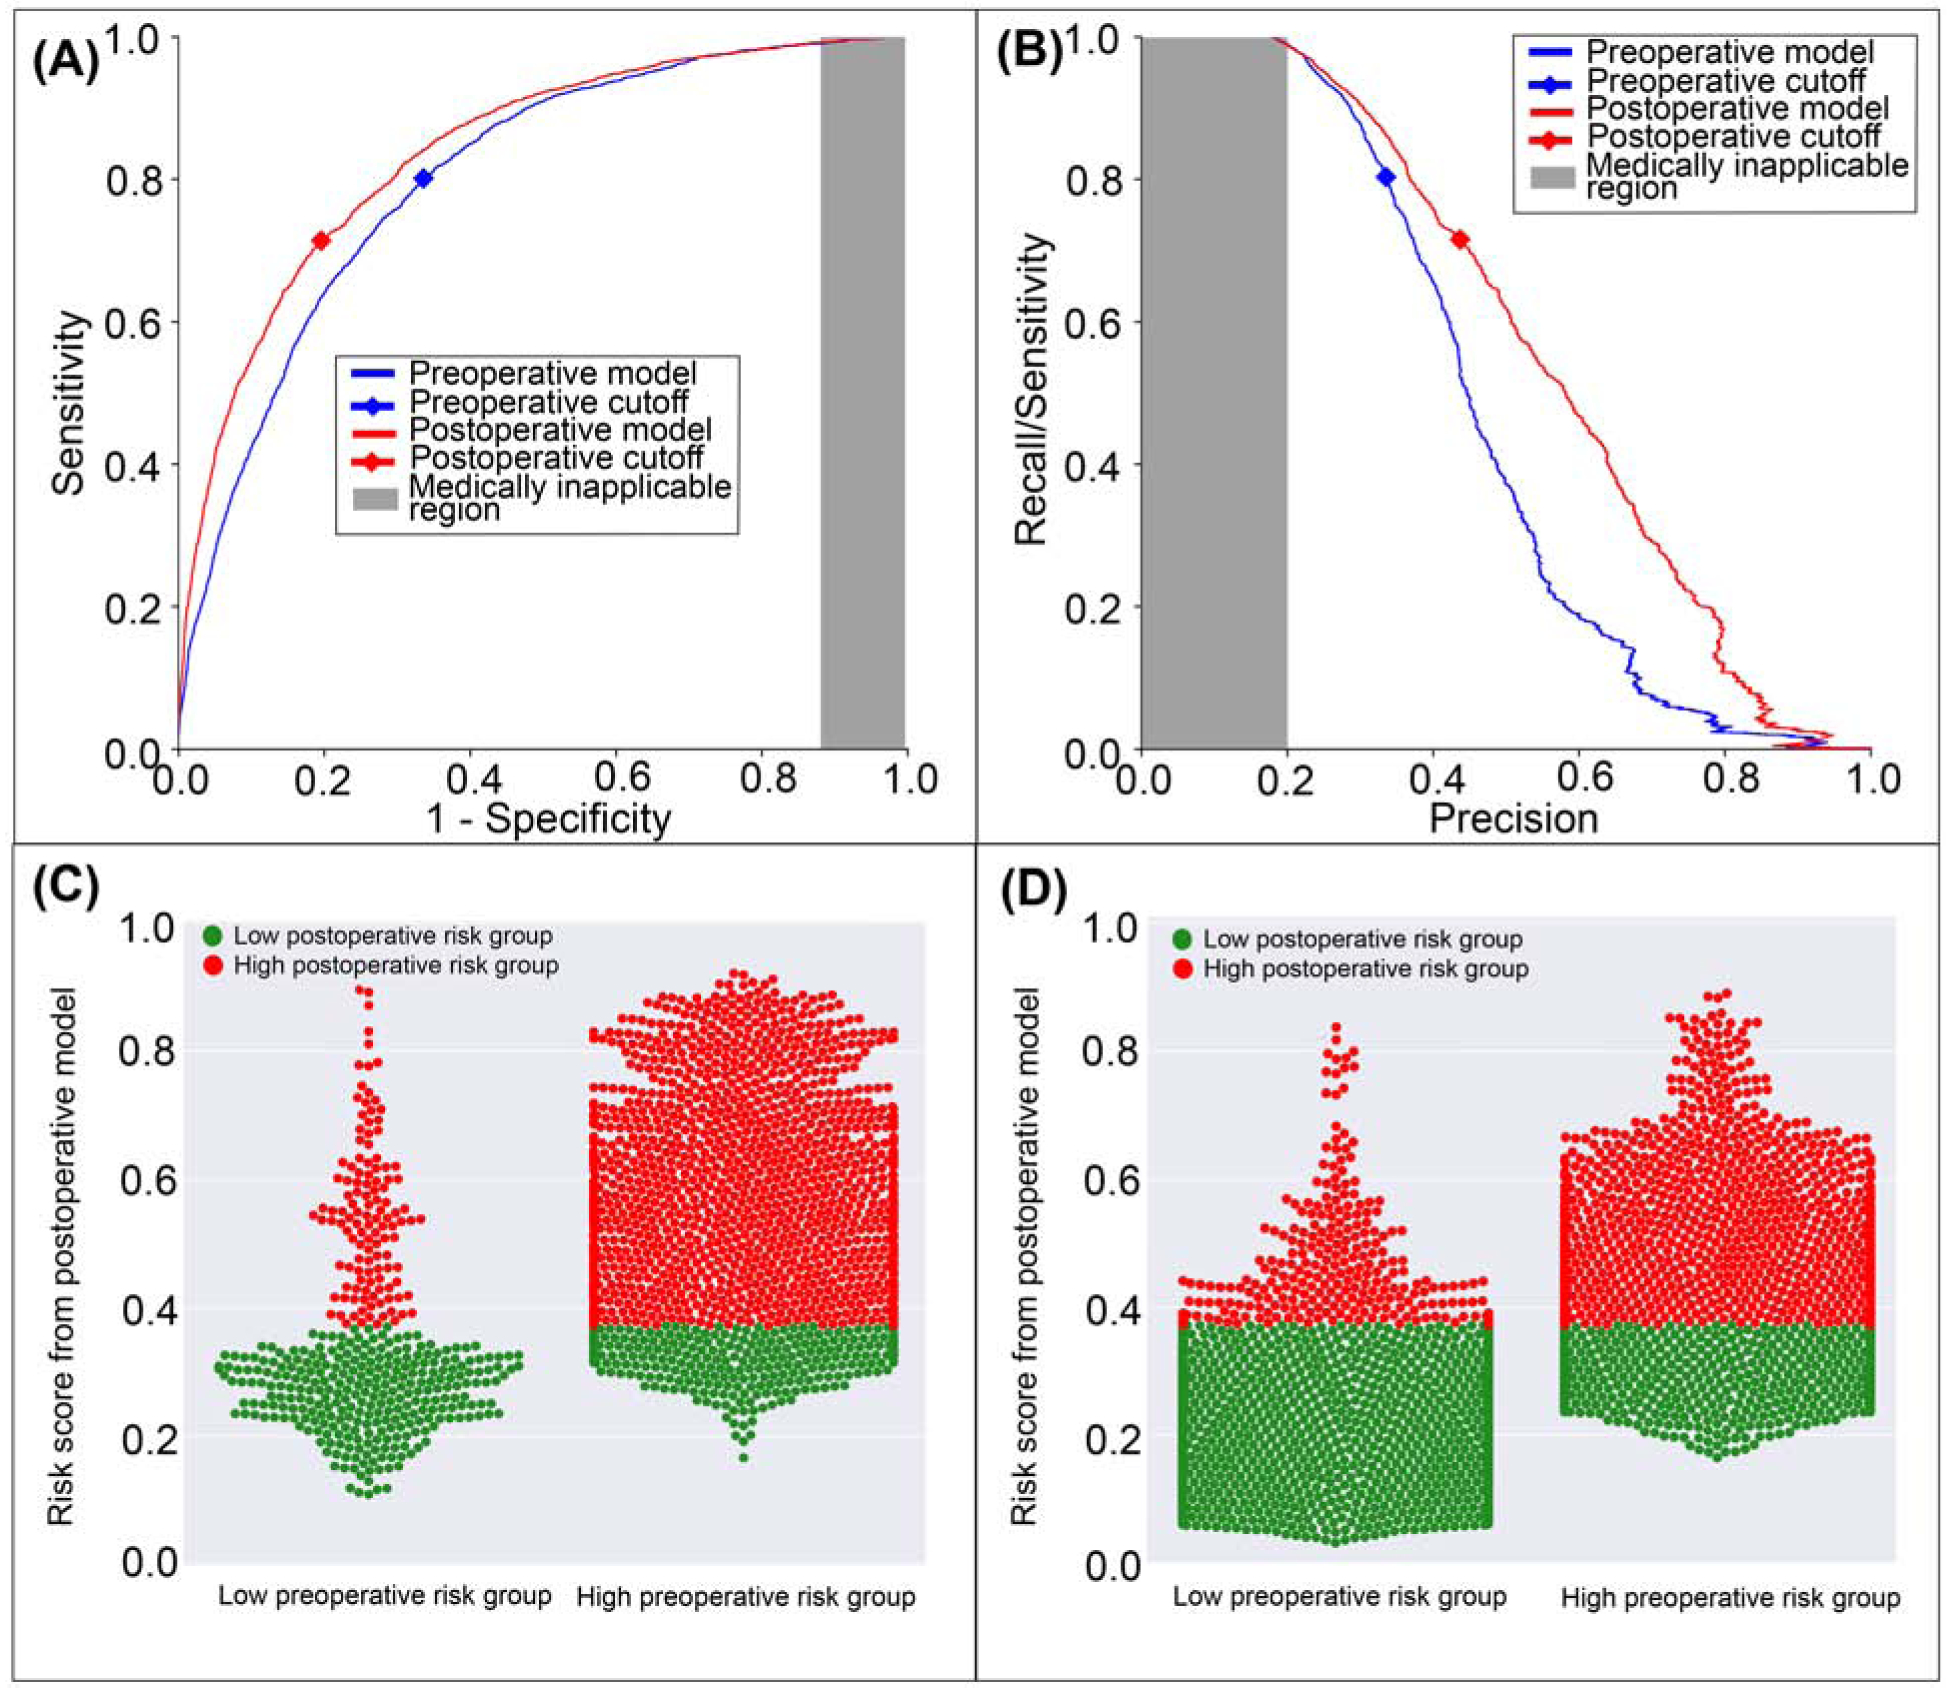
A: The postoperative model had greater area under the receiver operating characteristic curve (0.84 vs. 0.81). B: The postoperative model had greater area under the precision-recall curve (0.57 vs. 0.47). The postoperative model reclassified cases that did (C) and did not (D) feature acute kidney injury. Red dots are patients at high-risk for mortality according to the postoperative model; green dots are patients at low-risk. C, D: The postoperative model correctly reclassified 9.9% of all cases. Gray areas represent regions for which predictive discrimination or precision are ≤0.2, precluding reasonable clinical application.
Venous Thromboembolism
The postoperative model achieved greater accuracy (0.75 vs. 0.7, p<0.001), discrimination (AUROC 0.83 vs. 0.80, p<0.001), and precision (AUPRC 0.28 vs. 0.25, p<0.001) in predicting postoperative venous thromboembolism with greater specificity and positive predictive value, but similar negative predictive value and lower sensitivity (0.76 vs 0.79, p<0.001) than the model using preoperative data alone (Table 2). The postoperative model misclassified 2.7% of all cases that featured postoperative venous thromboembolism and correctly reclassified 5.6% of all cases that did not (Figure 7). Overall, there was 4.9% reclassification improvement by the postoperative model.
Figure 7: A model using both preoperative and intraoperative data outperformed a model using preoperative data alone in predicting postoperative venous thromboembolism.
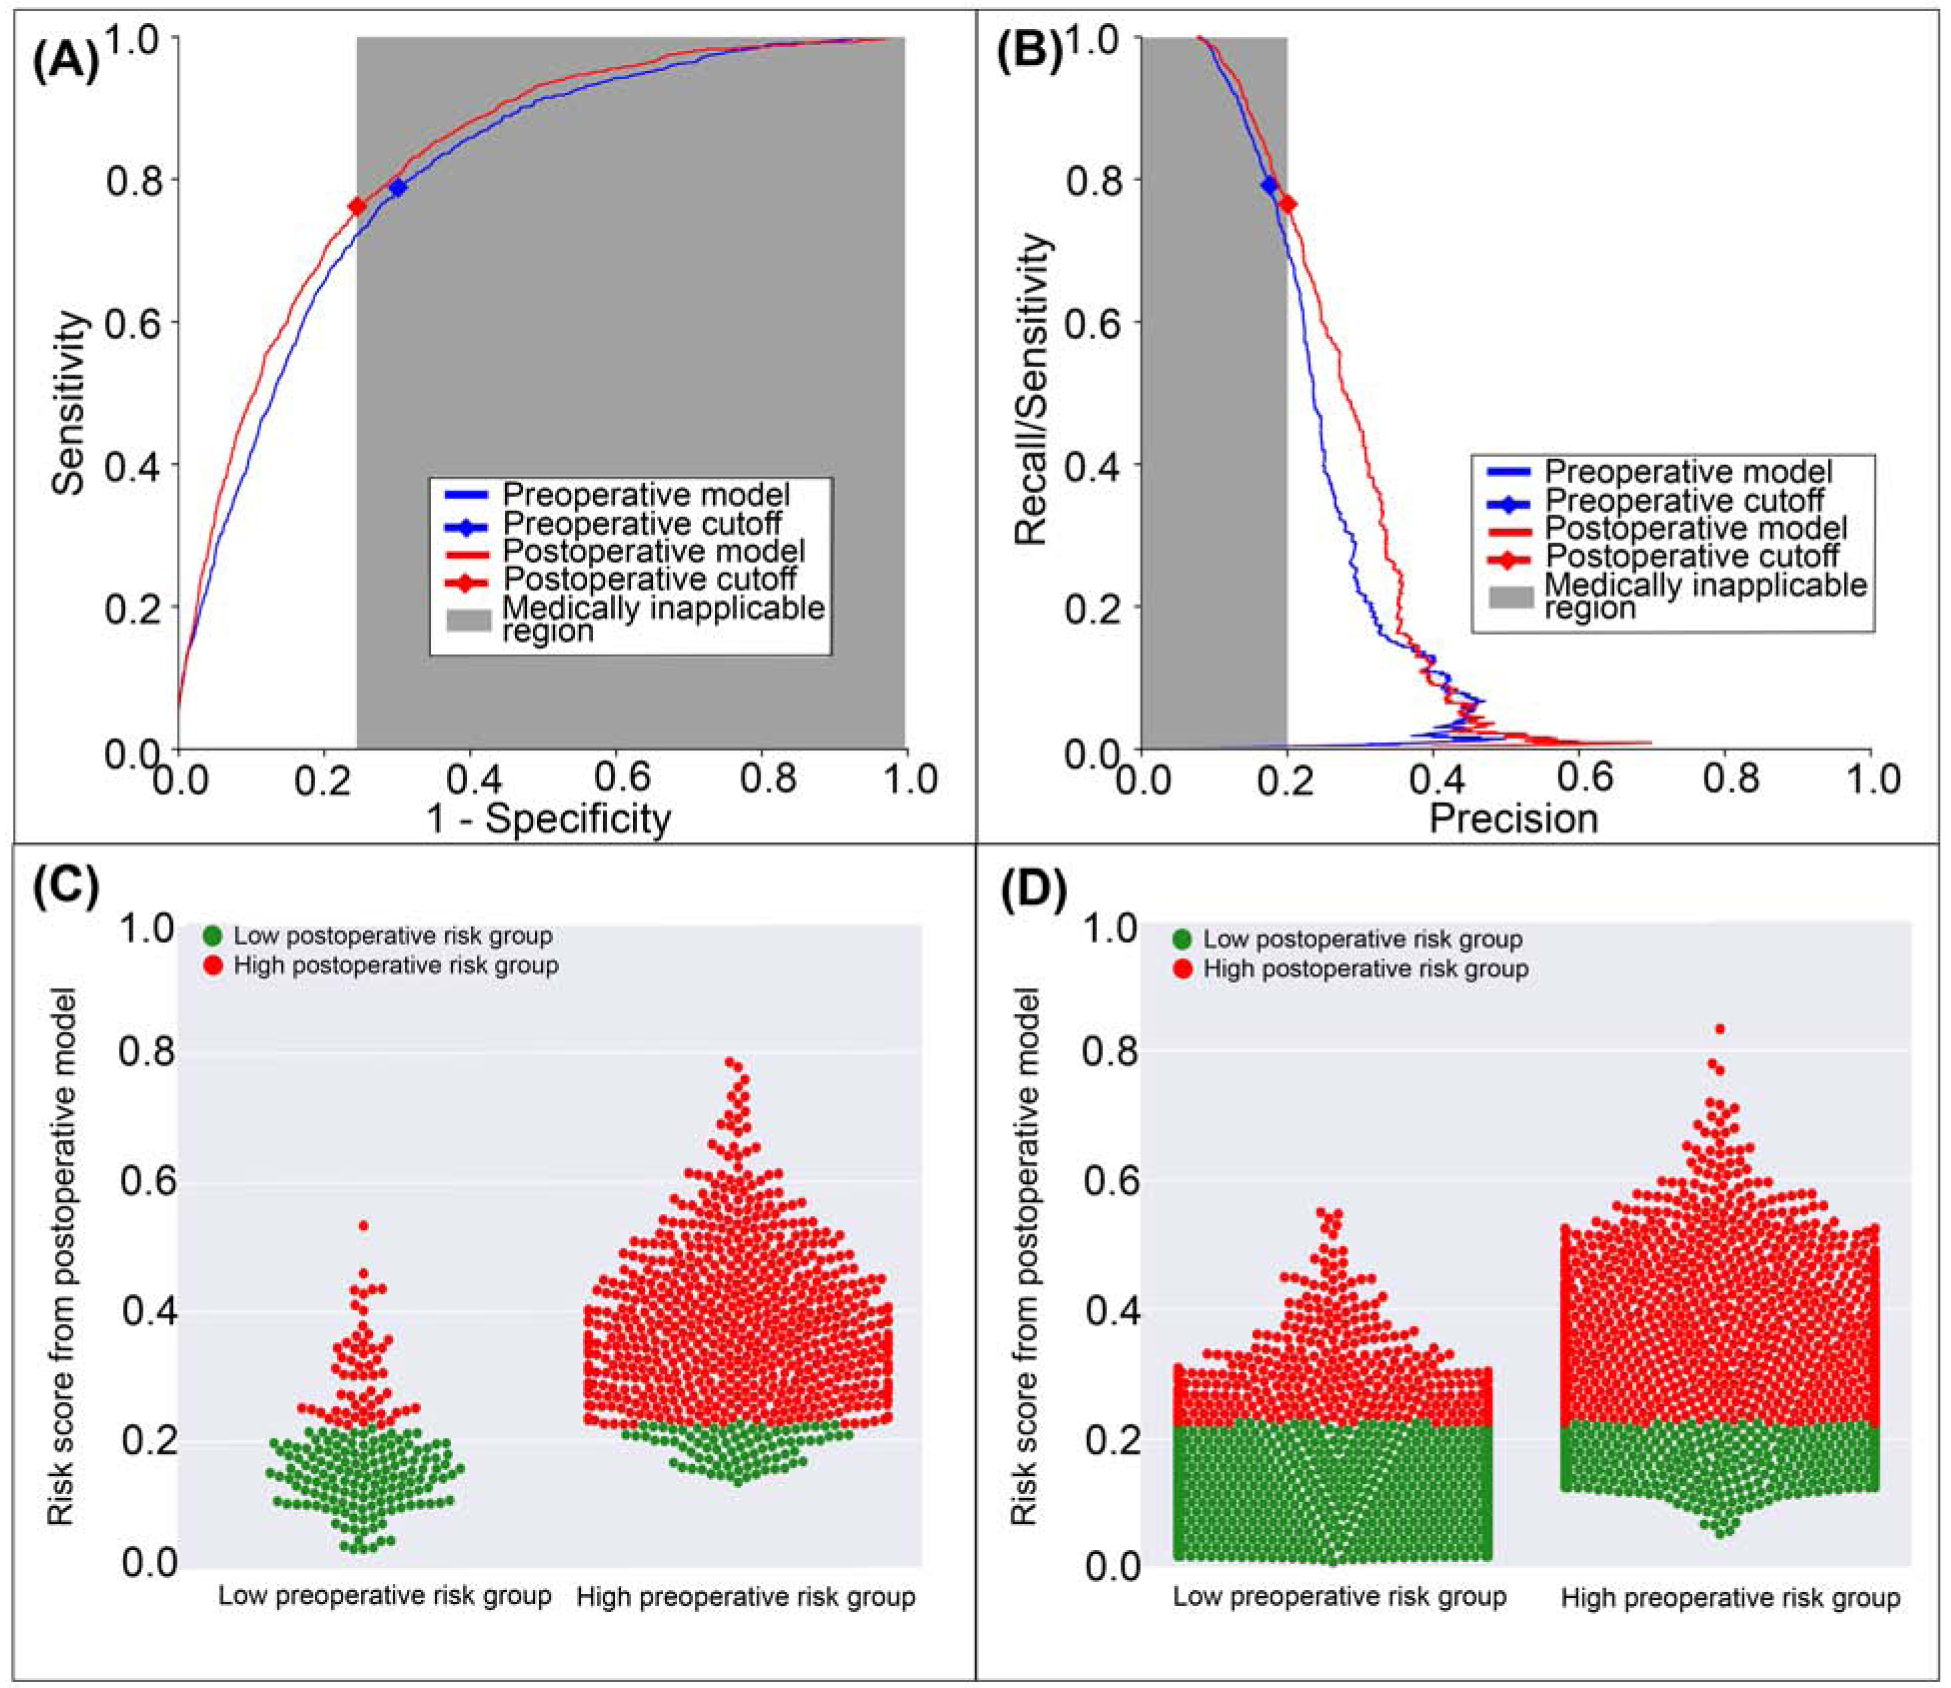
A: The postoperative model had greater area under the receiver operating characteristic curve (0.83 vs. 0.80). B: The postoperative model had greater area under the precision-recall curve (0.28 vs. 0.25). The postoperative model reclassified positive cases that did (C) and did not (D) feature venous thromboembolism. Red dots are patients at high-risk for venous thromboembolism according to the postoperative model; green dots are patients at low-risk. C, D: The postoperative model correctly reclassified 4.9% of all cases. Gray areas represent regions for which predictive discrimination or precision are ≤0.2, precluding reasonable clinical application.
Wound Complications
The postoperative model achieved greater accuracy (0.69 vs. 0.67, p<0.001), discrimination (AUROC 0.75 vs. 0.74, p=0.002), and precision (AUPRC 0.52 vs. 0.5, p<0.001) in predicting wound complications with greater specificity and positive predictive value, but similar negative predictive value and lower sensitivity (0.66 vs 0.69, p<0.001) than the model using preoperative data alone (Table 2). The postoperative model misclassified 2.5% of all cases that featured wound complications but correctly reclassified 4.1% of all cases that did not (Figure 8). Overall, there was 2.4% reclassification improvement by the postoperative model.
Figure 8: A model using both preoperative and intraoperative data outperformed a model using preoperative data alone in predicting postoperative wound complication.
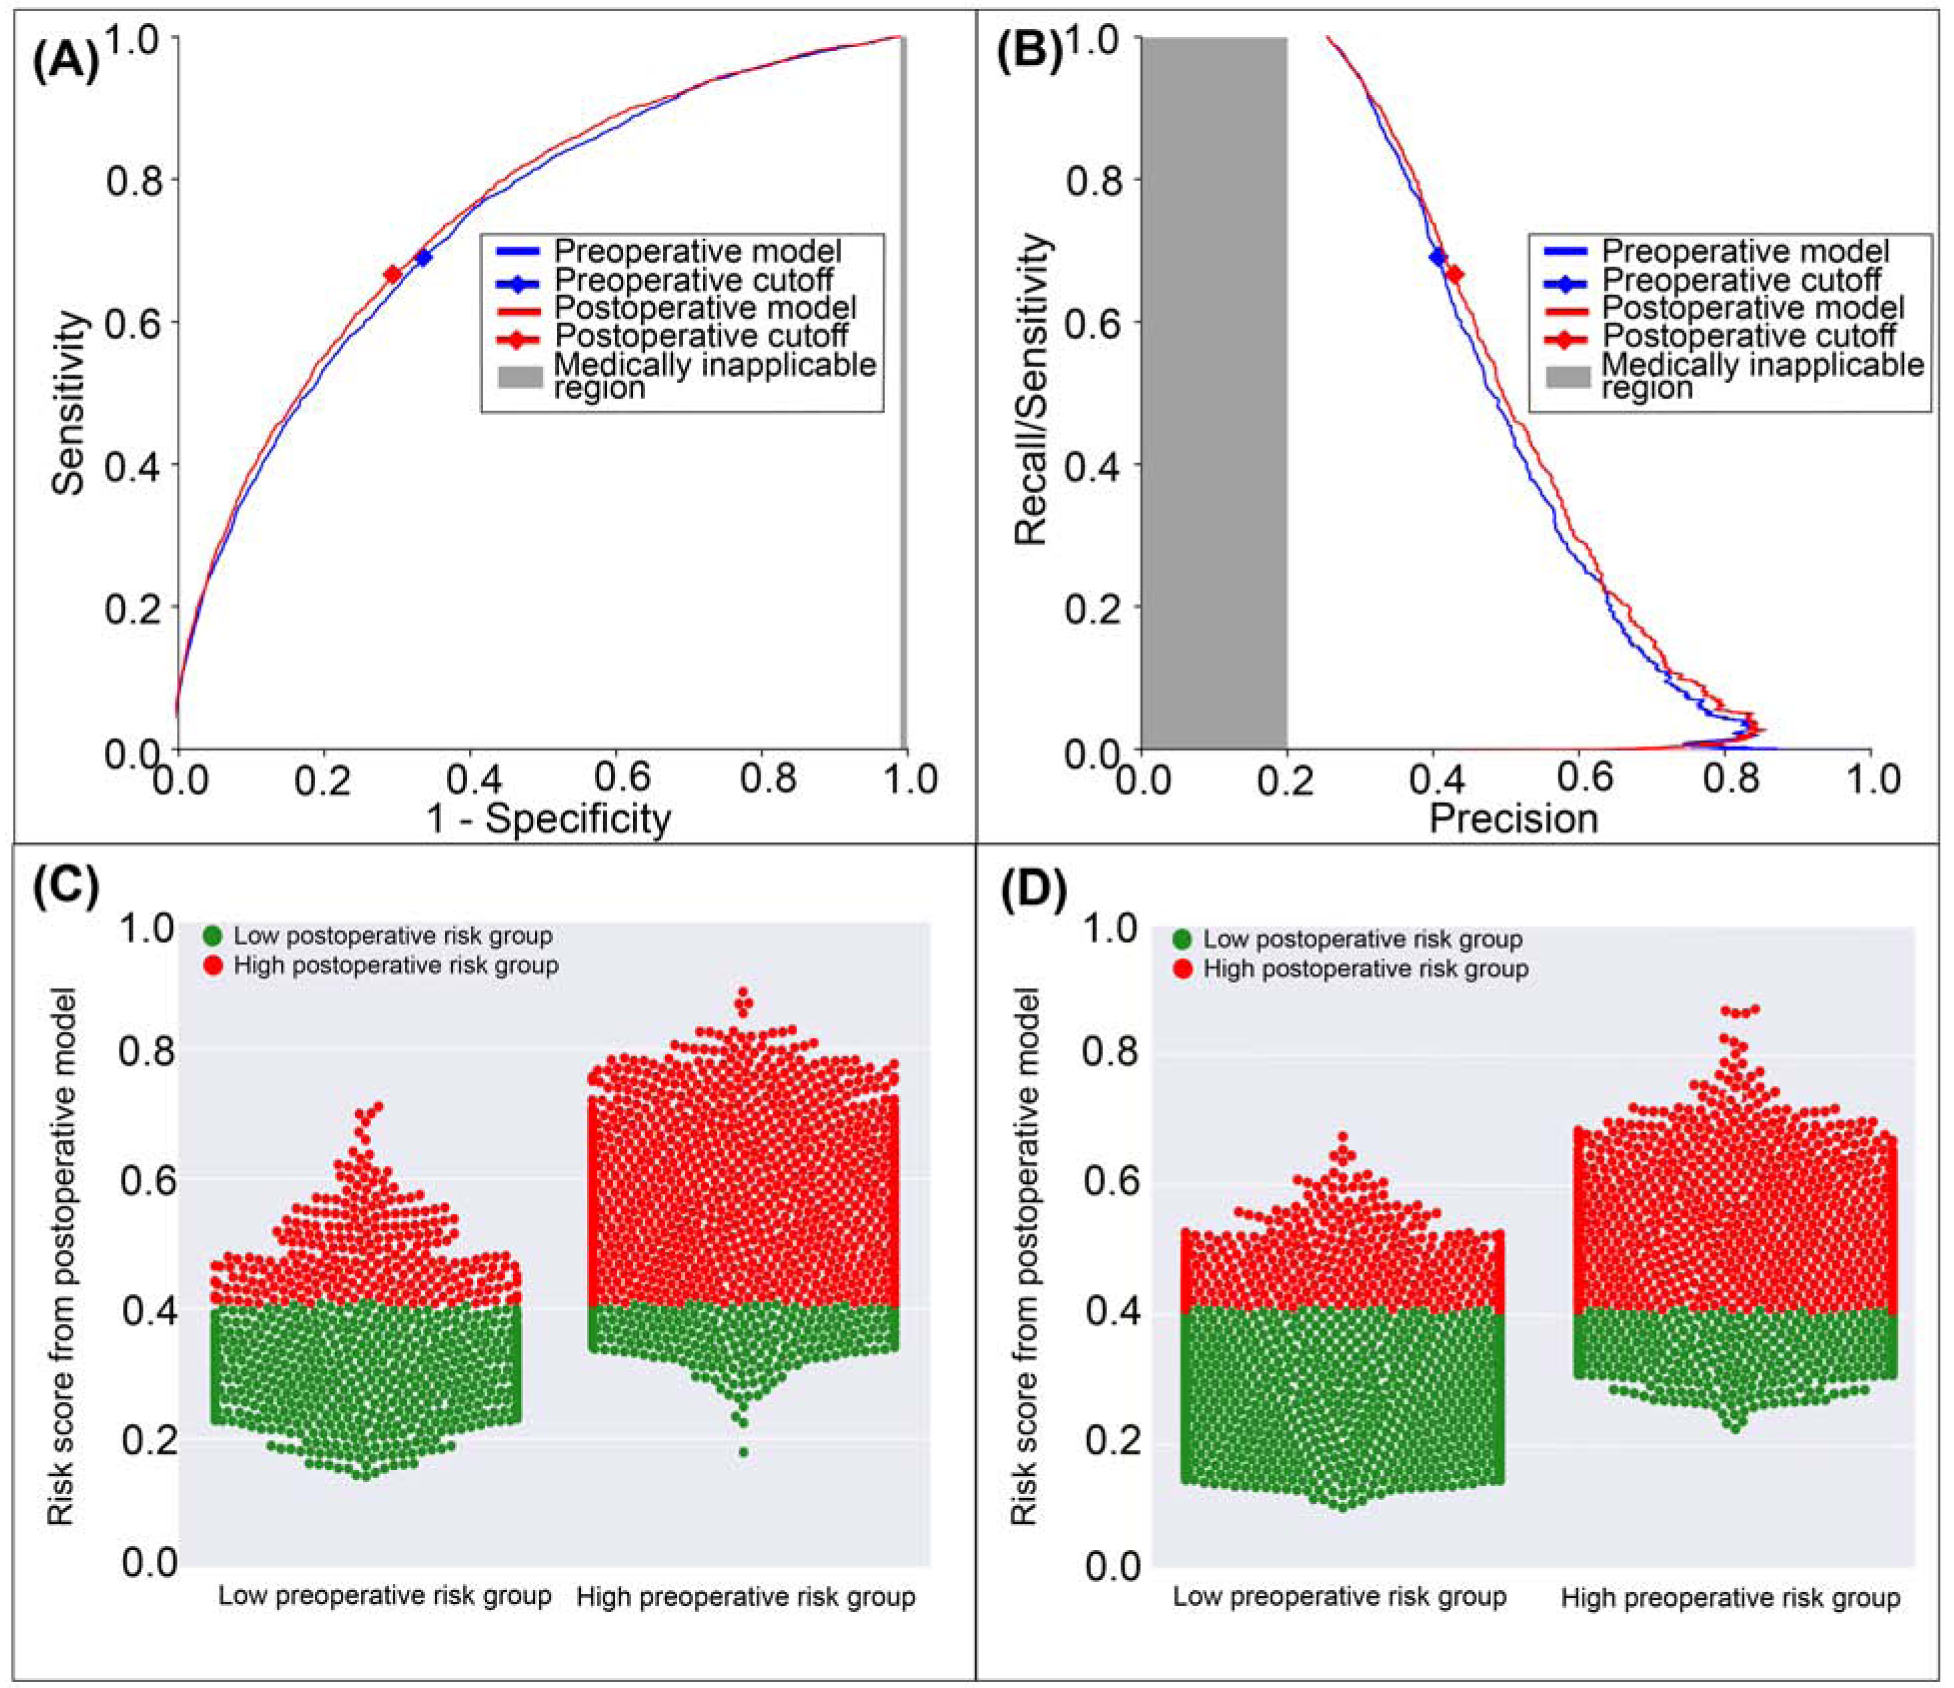
A: The postoperative model had greater area under the receiver operating characteristic curve (0.75 vs. 0.74). B: The postoperative model had greater area under the precision-recall curve (0.52 vs. 0.50). The postoperative model reclassified cases that did (C) and did not (D) feature wound complications. Red dots are patients at high-risk for wound complications according to the postoperative model; green dots are patients at low-risk. C, D: The postoperative model correctly reclassified 2.4% of all cases. Gray areas represent regions for which predictive discrimination or precision are ≤0.2, precluding reasonable clinical application.
Hospital Mortality
The postoperative model achieved greater accuracy (0.88 vs. 0.77, p<0.001), discrimination (AUROC 0.93 vs. 0.87, p<0.001), and precision (AUPRC 0.21 vs. 0.15, p<0.001) in predicting postoperative in-hospital mortality with greater specificity and positive predictive value, and similar sensitivity and negative predictive value compared with preoperative data alone (Table 3). The postoperative model correctly reclassified 2.2% of all cases of postoperative in-hospital mortality and 11.5% of all cases in which the patient survived to hospital discharge (Figure 9). Overall reclassification improvement was 11.2%.
Time-consumption in Model Training
For one point of grid search (e.g., one value of estimator number, minimum sample leaf number, best k value, and maximum allowable feature number) with 5-fold cross validation, the typical time for model training with both preoperative and intraoperative data was 550 – 690 seconds. Using preoperative data alone, training time was 395 – 460 seconds using a 64 bit system containing Intel® Xeon® W-2133 CPY at 3.60 GHz processor with 64 GB RAM.
Discussion
By incorporating intraoperative physiological data to preoperative data, we added value to a machine learning model that can predict postoperative complications by improving the accuracy, discrimination, and precision relative to a previous model that accessed preoperative data alone. This improvement held true for all postoperative complications tested as well as in-hospital mortality; there were no cases in which accuracy, discrimination, or precision did not improve by incorporating intraoperative data. The only negative results occurred with the prediction of prolonged ICU stay, venous thromboembolism, and wound complications; specifically, the postoperative models had lower sensitivity than models using preoperative data alone. In predicting prolonged ICU stay, it appears that the model using preoperative data alone had unusually low thresholds for classifying patients as high risk. The postoperative models raised this threshold, correctly classifying a greater proportion of patients and achieving greater accuracy, discrimination, and precision, at the cost of lower sensitivity. For predicting venous thromboembolism and wound complications, although postoperative model accuracy, discrimination, and precision were greater than that of the preoperative model, overall reclassification improvements were not statistically significant. Additionally, the optimum thresholds for predicting in-hospital mortality for both models fall outside of clinically applicable discrimination or precision (i.e., ≤0.2). This likely occurred because mortality rates were low (approximately 2%) and mortality predictions were tested using 30% of the test cohort, representing only 3,591 surgeries of the 52,529 surgeries in the entire cohort, whereas predictions for the other seven postoperative complications were tested using the entire test cohort (11,969 surgeries). Based on dataset behavior, mortality risks are more descriptive when using risk scores for complications than the raw variables used to estimate risk for those complications. Because complication risks must be developed and validated prior to use as mortality prediction factors, only the test cohort could be used to train, validate, and test in-hospital mortality predictions. Therefore, 30% of the test cohort was used to report mortality model performance.
Online risk calculators like the National Surgical Quality Improvement Program (NSQIP) Surgical Risk Calculator can reduce variability and increase the likelihood that patients will engage in prehabilitation, but they have time-consuming manual data acquisition and entry requirements, which hinders their clinical adoption.(13–18) Emerging technologies can circumvent this problem. The MySurgeryRisk platform autonomously draws data from multiple input sources and uses machine learning techniques to predict postoperative complications and mortality. However, easily and readily available predictions are only useful if they are accurate and precise enough to augment clinical decision-making. In a prospective study of the original MySurgeryRisk platform, the algorithm predicted postoperative complications with greater accuracy than physicians, but there was room for continued improvement.(19) The present study demonstrates that incorporation of intraoperative physiological time-series data improves predictive accuracy, discrimination, and precision, presumably by representing important intraoperative events and physiological changes that influence postoperative clinical trajectories and complications. Dziadzko et al.(20) used a random forest model to predict mortality or the need for greater than 48 hours of mechanical ventilation using EHR data from patients admitted to academic hospitals, achieving excellent discrimination (AUROC 0.90), similar to MySurgeryRisk discrimination for mechanical ventilation for greater than 48 hours (AUROC 0.96) using both preoperative and intraoperative data. Therefore, the MySurgeryRisk PostOp extension takes another step toward clinical utility, maintaining autonomous function while improving accuracy, discrimination, and precision.
Despite advances in the facility of use and performance, predictive analytic platforms face a major barrier to clinical adoption: predictions do not directly translate into decisions. When predicted risk for postoperative AKI is very low or very high, it is relatively clear whether the patient would benefit from renal-protection bundles. Similarly, when predicted risk for cardiovascular complications is very low or very high, it is relatively clear whether the patient would benefit from continuous cardiac monitoring. However, a substantial number of patients are at intermediate risk for these complications, and thus the need for additional intervention or investigation remains uncertain. In the present study, we dichotomized outcome predictions into low- and high-risk categories to facilitate analysis of model performance, however any risk for a complication exists on a continuum. MySurgeryRisk platforms addresses this and makes predictions along a continuum (i.e., range from 0%−100% chance of a complication), but this method is also unable to augment clinical decisions for intermediate-risk scenarios. The average risk across a population usually defines intermediate risks. Therefore, this challenge will affect most patients and their corresponding risks, which leaves additional room for modeling improvements.
We predict that advances in machine learning technologies will rise to meet this challenge. Predictive analytics indirectly inform discrete choices facing clinicians; reinforcement learning models can provide instructive feedback by identifying specific actions that yield the highest probability of achieving a defined goal. For example, a reinforcement learning model could be trained to achieve hospital discharge with baseline renal and cardiovascular function, without major adverse kidney or cardiac events, making recommendations for or against renal protection bundles and continuous cardiac monitoring according to these goals. Similar models have been used to recommend vasopressor doses and intravenous fluid resuscitation volumes for septic patients, demonstrating efficacy relative to clinician decision-making in large retrospective datasets(21). However, to our knowledge, these models have not been tested clinically or applied to surgical decision-making scenarios. Therefore, the potential benefits of reinforcement learning to augment surgical decision-making learning remain theoretical.
This study used data from a single institution, limiting the generalizability of these findings. As previously discussed, true risk for complications is not dichotomous, but we dichotomized risk in this study to facilitate model performance evaluation and comparison. We used administrative codes to identify complications, so coding errors could have influenced results. The MySurgeryRisk algorithm learned predictive features from raw data, and so it may have used features that are not classic risk factors. This approach has the potential advantage of discovering and incorporating unknown or underused risk factors, and the disadvantage that the existence and identity of these risk factors remain unknown. Finally, in some cases, intraoperative model input features may have been evidence of a complication rather than true predictors of a complication, i.e., oliguria intraoperatively may be evidence of AKI rather than predictive of developing AKI.
Conclusions
Incorporation of both preoperative and intraoperative data significantly increased the accuracy, discrimination, and precision of machine learning models that predict seven postoperative complications and in-hospital mortality. These predictions have the theoretical benefit of supporting decisions regarding postoperative triage, surveillance for complications, and targeted preventative measures. However, it remains unknown whether better predictions translate to better decisions and outcomes. Future research should apply these models to clinical settings and seek to enhance decision-making for intermediate-risk patients, who compose the majority of the population and pose unique predictive analytic challenges.
Supplementary Material
Disclosure
A.B., T.O.B., and M.R. were supported by R01 GM110240 from the National Institute of General Medical Sciences. A.B. and T.O.B. were supported by Sepsis and Critical Illness Research Center Award P50 GM-111152 from the National Institute of General Medical Sciences. T.O.B. received a grant that was supported by the National Center for Advancing Translational Sciences of the National Institutes of Health under Award Number UL1TR001427 and received grant support from Gatorade Trust (127900), University of Florida. M.R. received support from the University of Florida Davis Foundation. This work was supported in part by the NIH/NCATS Clinical and Translational Sciences Award to the University of Florida UL1 TR000064.
Footnotes
Publisher's Disclaimer: This is a PDF file of an unedited manuscript that has been accepted for publication. As a service to our customers we are providing this early version of the manuscript. The manuscript will undergo copyediting, typesetting, and review of the resulting proof before it is published in its final form. Please note that during the production process errors may be discovered which could affect the content, and all legal disclaimers that apply to the journal pertain.
References
- 1.Raymond BL, Wanderer JP, Hawkins AT, Geiger TM, Ehrenfeld JM, et al. Use of the American College of Surgeons National Surgical Quality Improvement Program Surgical Risk Calculator During Preoperative Risk Discussion: The Patient Perspective. Anesth Analg 2019:128:643–650. [DOI] [PubMed] [Google Scholar]
- 2.Bilimoria KY, Liu Y, Paruch JL, Zhou L, Kmiecik TE, et al. Development and evaluation of the universal ACS NSQIP surgical risk calculator: a decision aid and informed consent tool for patients and surgeons. J Am Coll Surg 2013:217:833–842 e831–833. [DOI] [PMC free article] [PubMed] [Google Scholar]
- 3.Bertsimas D, Dunn J, Velmahos GC, Kaafarani HMA Surgical Risk Is Not Linear: Derivation and Validation of a Novel, User-friendly, and Machine-learning-based Predictive OpTimal Trees in Emergency Surgery Risk (POTTER) Calculator. Ann Surg 2018:268:574–583. [DOI] [PubMed] [Google Scholar]
- 4.Bihorac A, Ozrazgat-Baslanti T, Ebadi A, Motaei A, Madkour M, et al. MySurgeryRisk: Development and Validation of a Machine-learning Risk Algorithm for Major Complications and Death After Surgery. Ann Surg 2018:269:652–662. [DOI] [PMC free article] [PubMed] [Google Scholar]
- 5.Charlson ME, Pompei P, Ales KL, MacKenzie CR A new method of classifying prognostic comorbidity in longitudinal studies: development and validation. J Chronic Dis 1987:40:373–383. [DOI] [PubMed] [Google Scholar]
- 6.Saria S, Rajani AK, Gould J, Koller D, Penn AA Integration of early physiological responses predicts later illness severity in preterm infants. Science translational medicine 2010:2:48ra65. [DOI] [PMC free article] [PubMed] [Google Scholar]
- 7.Breiman L Random Forests. Machine Learning 2001:45:5–32. [Google Scholar]
- 8.Youden WJ Index for rating diagnostic tests. Cancer 1950:3:32–35. [DOI] [PubMed] [Google Scholar]
- 9.Saito T, Rehmsmeier M The precision-recall plot is more informative than the ROC plot when evaluating binary classifiers on imbalanced datasets. PLoS One 2015:10:e0118432. [DOI] [PMC free article] [PubMed] [Google Scholar]
- 10.Chiew CJ, Liu N, Wong TH, Sim YE, Abdullah HR Utilizing Machine Learning Methods for Preoperative Prediction of Postsurgical Mortality and Intensive Care Unit Admission. Ann Surg 2019. [DOI] [PMC free article] [PubMed] [Google Scholar]
- 11.Wilcoxon F Individual Comparisons by Ranking Methods. Biometrics Bull 1945:1:80–83. [Google Scholar]
- 12.Pencina MJ, D’Agostino RB, Steyerberg EW Extensions of net reclassification improvement calculations to measure usefulness of new biomarkers. Stat Med 2011:30:11–21. [DOI] [PMC free article] [PubMed] [Google Scholar]
- 13.Chiu AS, Jean RA, Resio B, Pei KY Early postoperative death in extreme-risk patients: A perspective on surgical futility. Surgery 2019. [DOI] [PubMed] [Google Scholar]
- 14.Clark DE, Fitzgerald TL, Dibbins AW Procedure-based postoperative risk prediction using NSQIP data. J Surg Res 2018:221:322–327. [DOI] [PubMed] [Google Scholar]
- 15.Lubitz AL, Chan E, Zarif D, Ross H, Philp M, et al. American College of Surgeons NSQIP Risk Calculator Accuracy for Emergent and Elective Colorectal Operations. J Am Coll Surg 2017:225:601–611. [DOI] [PubMed] [Google Scholar]
- 16.Cohen ME, Liu Y, Ko CY, Hall BL An Examination of American College of Surgeons NSQIP Surgical Risk Calculator Accuracy. J Am Coll Surg 2017:224:787–795 e781. [DOI] [PubMed] [Google Scholar]
- 17.Hyde LZ, Valizadeh N, Al-Mazrou AM, Kiran RP ACS-NSQIP risk calculator predicts cohort but not individual risk of complication following colorectal resection. Am J Surg 2019:218:131–135. [DOI] [PubMed] [Google Scholar]
- 18.Leeds IL, Rosenblum AJ, Wise PE, Watkins AC, Goldblatt MI, et al. Eye of the beholder: Risk calculators and barriers to adoption in surgical trainees. Surgery 2018:164:1117–1123. [DOI] [PMC free article] [PubMed] [Google Scholar]
- 19.Brennan M, Puri S, Ozrazgat-Baslanti T, Feng Z, Ruppert M, et al. Comparing clinical judgment with the MySurgeryRisk algorithm for preoperative risk assessment: A pilot usability study. Surgery 2019:165:1035–1045. [DOI] [PMC free article] [PubMed] [Google Scholar]
- 20.Dziadzko MA, Novotny PJ, Sloan J, Gajic O, Herasevich V, et al. Multicenter derivation and validation of an early warning score for acute respiratory failure or death in the hospital. Crit Care 2018:22:286. [DOI] [PMC free article] [PubMed] [Google Scholar]
- 21.Komorowski M, Celi LA, Badawi O, Gordon AC, Faisal AA The Artificial Intelligence Clinician learns optimal treatment strategies for sepsis in intensive care. Nat Med 2018:24:1716–1720. [DOI] [PubMed] [Google Scholar]
Associated Data
This section collects any data citations, data availability statements, or supplementary materials included in this article.


