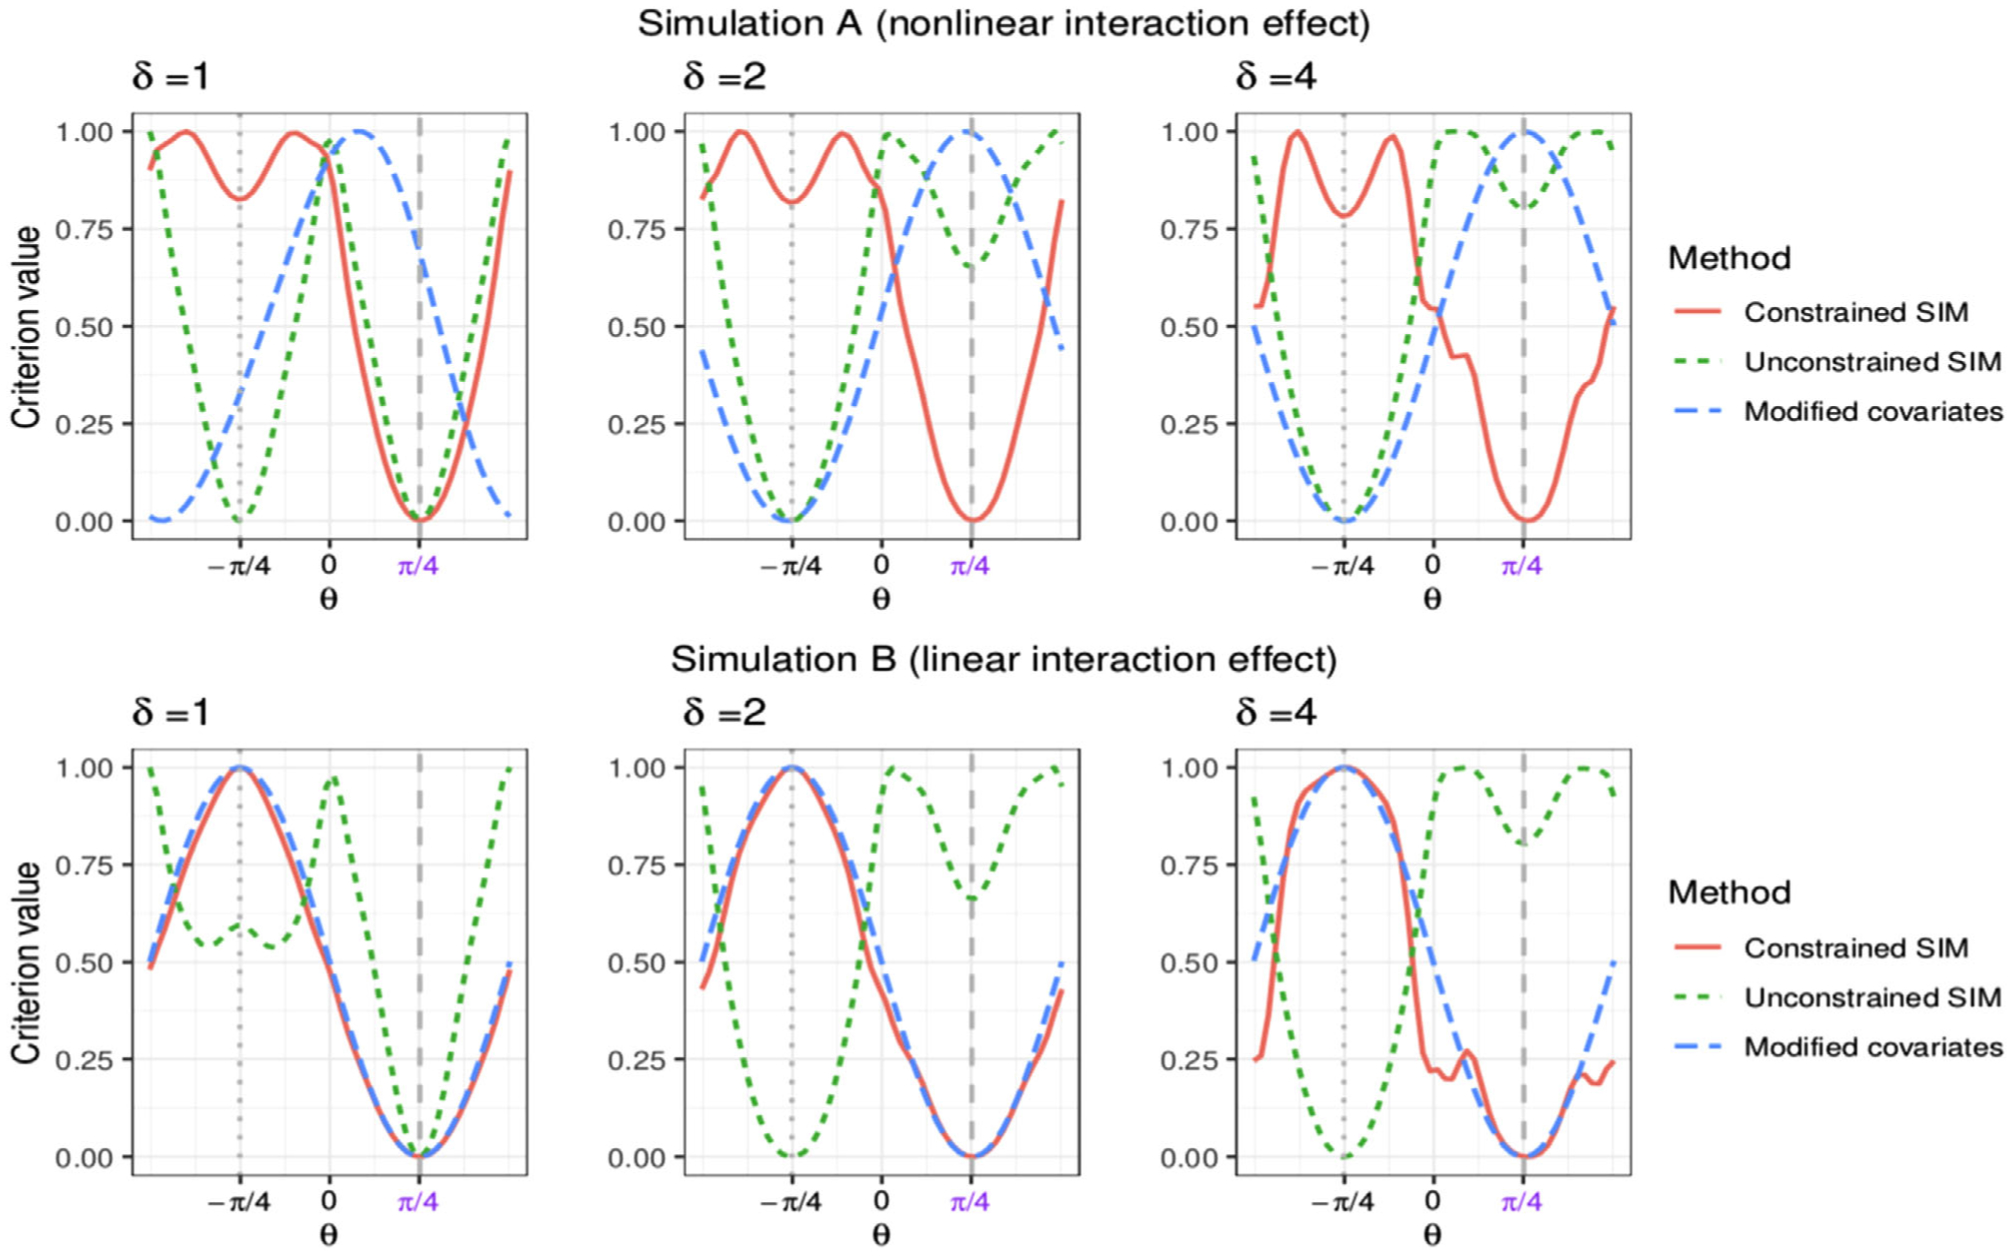
FIGURE 1.

The averaged criterion functions of θ ∈ [−π/2, π/2) averaged over 200 simulated data sets. The vector α0 corresponds to the angle θ1 = π/4 that is indicated by the gray dashed vertical line, and the “nuisance” vector η corresponds to the angle θ2 = −π/4 indicated by the gray dotted vertical line. The criteria and their corresponding line styles: (1) the constrained single-index criterion (the red solid curves); (2) the unconstrained single-index criterion (the green dotted curves); (3) the modified covariates criterion (the blue dashed curves).
