

Abstract
Background:
Prevalence and characteristics of fetal alcohol spectrum disorders (FASD) have been described previously in this community.
Methods:
Active case ascertainment methods were employed in a new cross-sectional study with Revised Institute of Medicine criteria among first grade students (n=735) via dysmorphology examinations and neurobehavioral assessments. Their mothers were interviewed regarding risk factors. Final diagnoses were assigned via structured case conferences.
Results:
Children with fetal alcohol syndrome (FAS), partial FAS (PFAS), and alcohol related-neurodevelopmental disorder (ARND) were significantly different from controls on all cardinal variables, multiple dysmorphology traits and neurobehavioral performance. Mothers of children with FASD reported significantly more drinking before and during pregnancy (mothers of children with FAS reported 7.8 (±6.1) drinks per drinking day (DDD) prior to pregnancy and 5.1 (±5.9) after pregnancy recognition). Distal risk variables for a diagnosis on the continuum of FASD were: lower maternal height, weight, and body mass index; higher gravidity; lower education and household income; and later pregnancy recognition. Alcohol and tobacco remain the only commonly used drugs. Women reporting first trimester drinking of two DDD were 13 times more likely (95% CI:8.1–32.7) to have a child with FASD than non-drinkers; and those who reported drinking throughout pregnancy were 19.4 times more likely (95% CI:8.2–46.0) to have a child with FASD.
Conclusion:
Seventeen years after the first study in this community, FASD prevalence remains high at 16% to 31%. The FAS rate may have declined somewhat, but rates of PFAS and ARND seemed to plateau, at a high rate.
Keywords: traits of fetal alcohol spectrum disorders (FASD), dysmorphology, prenatal alcohol use, binge drinking, maternal risk for FASD, prevalence, South Africa
1. Introduction
1.1. Diagnosing a Continuum
Fetal alcohol syndrome (FAS), the phenotype of the most severely, physically-affected children within the continuum of fetal alcohol spectrum disorders (FASD), was first described by Jones and Smith (1973). Children with FAS display significant dysmorphia, growth restriction and neurobehavioral impairments resulting from exposure to substantial amounts of alcohol during gestation. Children showing fewer physical features of FAS and less growth restriction are diagnosed with one of three other specific diagnoses established by a committee of the Institute of Medicine (IOM): partial FAS (PFAS), alcohol-related birth defects (ARBD), and alcohol-related neurodevelopmental disorder (ARND) (Hoyme et al., 2005, 2016; Stratton et al., 1996). These four diagnoses form the gamut of FASD (Streissguth and O’Malley, 2000; Warren et al., 2004). Establishing the population-based prevalence of the full range of FASD in general populations has been a worldwide challenge (Lange et al., 2018).
1.2. Active Case Ascertainment Studies of FASD in South Africa and Elsewhere
Active case ascertainment (ACA) of children with FASD produces the highest prevalence of FASD of any method (Stratton et al., 1996). Because no single biological marker exists for FASD, the diagnosis is complex and multidisciplinary. Therefore, under-diagnosis is common; one study estimated that up to 87% of children with FASD are either not diagnosed or are misdiagnosed in their lifetimes (Chasnoff et al., 2015). Therefore, surveillance systems and most clinic-based studies produce gross underestimates of prevalence (May et al., 2009).
ACA has been employed successfully to study FASD in primary schools, not only in South Africa (ZA), but also in Italy (May et al., 2011, 2006), Croatia (Petkovic and Barisic, 2013, 2010), the United States (May et al., 2018a), Poland (Okulicz-Kozaryn et al., 2017) and Canada (Popova et al., 2019). The above studies in countries other than South Africa reported what were alarmingly high rates (2–6%), and ACA studies in South Africa reported even higher rates. The first of these cross-sectional, period prevalence studies in South Africa (May et al., 2000) and four additional studies were carried out previously in the community that is the subject of this study (May et al., 2016d, 2013, 2007; Viljoen et al., 2005).
1.3. The Current Study
This manuscript describes a sixth cross-sectional, ACA study conducted in this one community in the Western Cape Province (WCP) of South Africa (May et al., 2016d, 2013, 2007, 2000; Viljoen et al., 2005). The racial composition of this agricultural and light industrial community of 55,500 people in 2011 was: 68% Cape Coloured (mixed race), 16% Black African, 15% White, and 1% Other (“Census 2011,” n.d.). Data were collected from 2014–2016 in all primary schools of the community to describe the traits of children with FASD and maternal risk factors associated with an FASD diagnosis in the current time period. Additionally, we present the prevalence of FASD reported in the five preceding studies to assess community, diagnostic and study trends in the prevalence of FASD.
The aims that we hope to accomplish with this manuscript are as follows. First, we present detailed analysis of the common physical and neurobehavioral traits among children diagnosed within the full continuum of FASD in this community and compare them to randomly-selected controls from this same population. Second, case control comparisons of the proximal and distal maternal risk factors are presented as they differ among mothers of children with each FASD diagnosis and as they differ from mothers of comparison children verified as typically developing. Third, we present the prevalence of the full continuum of FASD diagnoses among first grade students in this community in 2014 and compare it to the prevalence in previous cross-sectional, population-based studies in this same community population. And fourth, we present the association between alcohol and selected neurobehavioral performance measures, physical features, and the likelihood of a diagnosis within the FASD continuum by quantity of alcohol consumed per day and by trimester of drinking.
2. Methods
2.1. Recruitment and Sampling – A Three-Tier Process
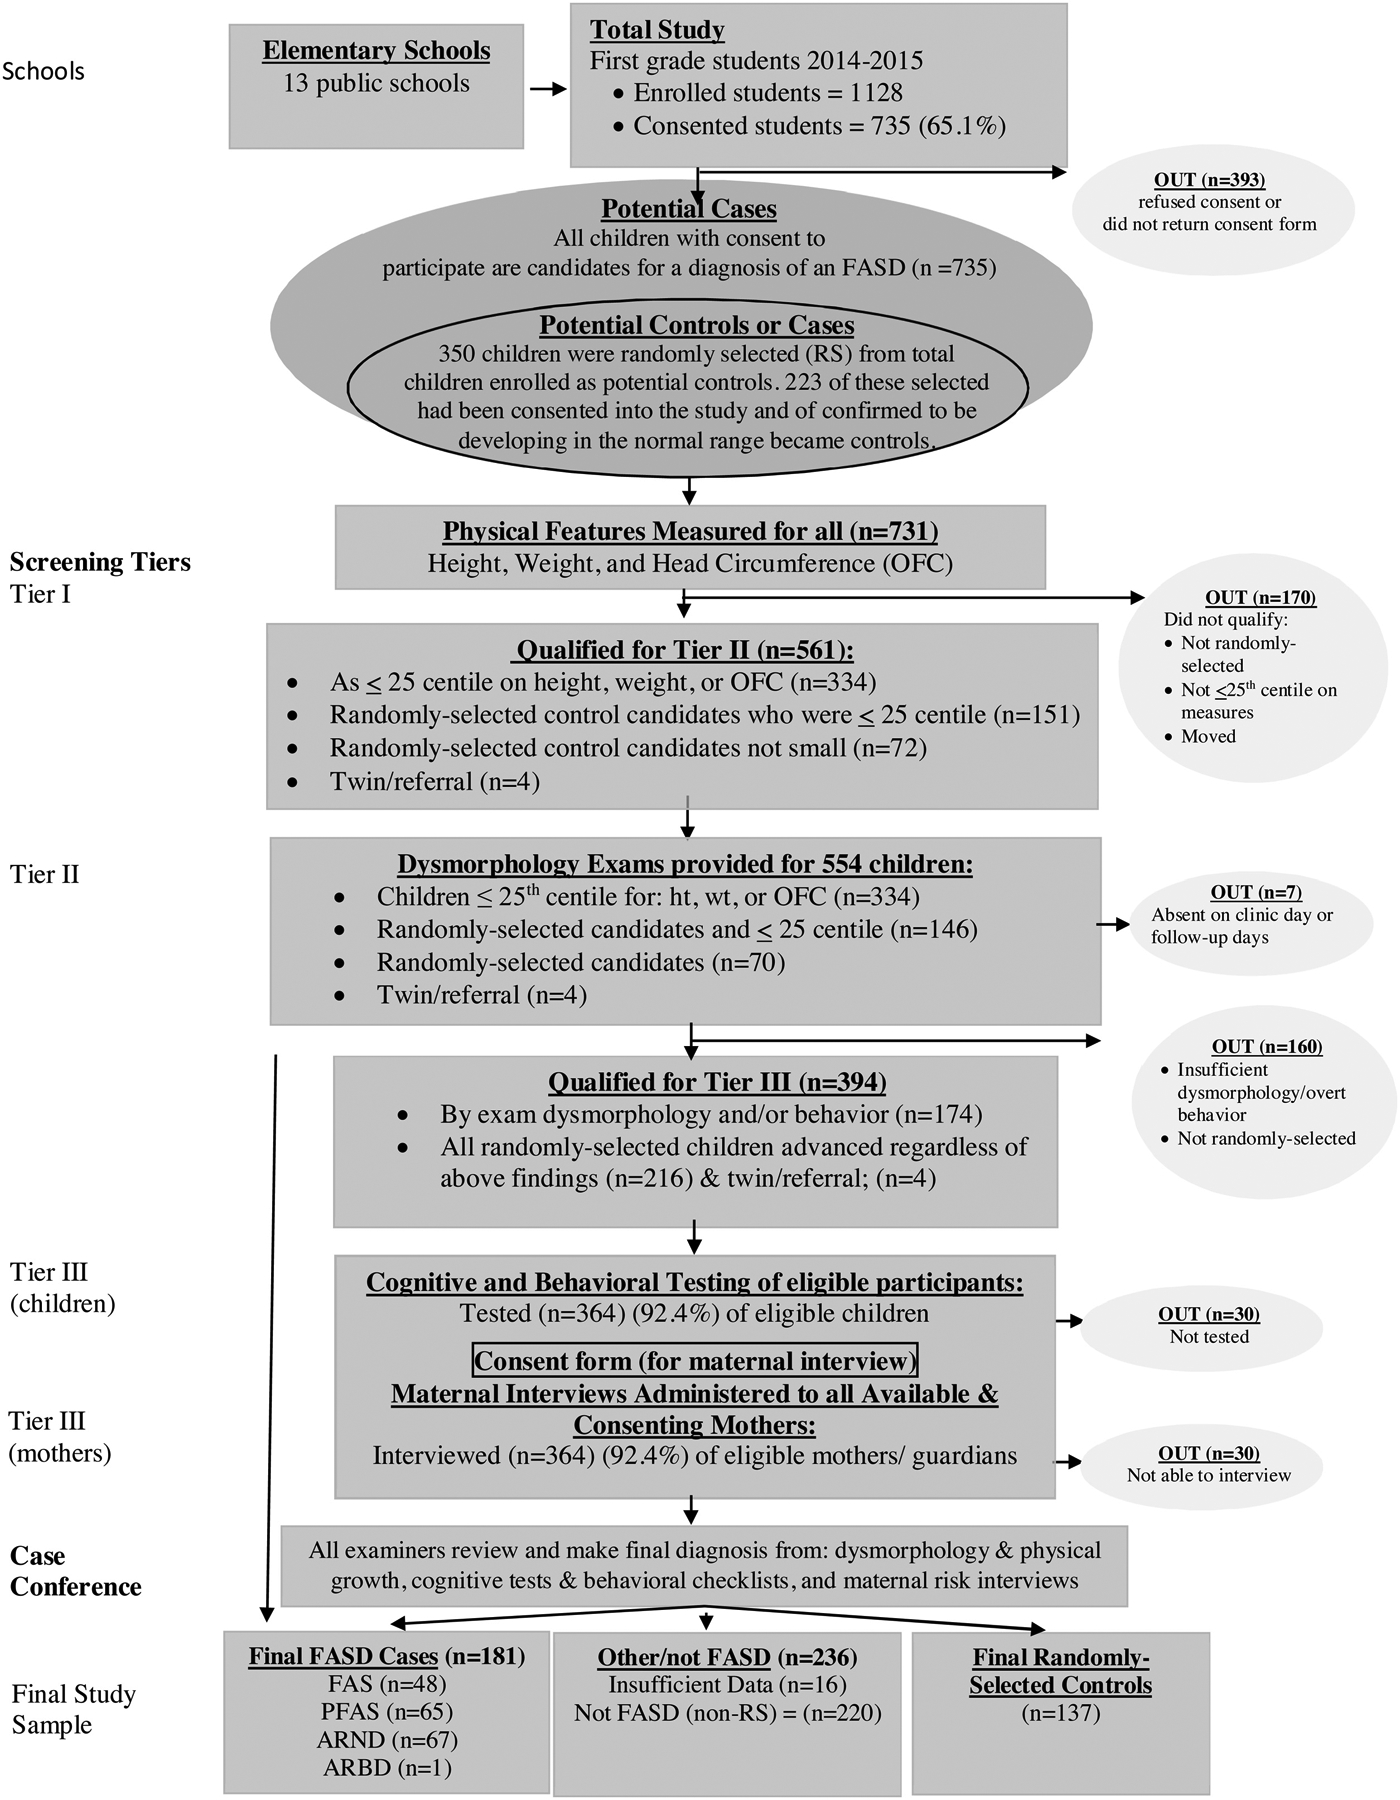
The Ethics Committee of Stellenbosch University Faculty of Medicine and Health Sciences and the Institutional Review Boards of the University of New Mexico and the University of North Carolina approved all protocols. All first-grade children (n=1128) from all 13 primary schools in the community participated in this study. Written consent for 735 first graders (65.1%) was received from parents/guardians and assent forms were obtained from children seven years and older. As illustrated in Figure 1, a three-tier, ACA process of screening, data collection and diagnosis were implemented.
Figure 1.
Sampling Methodology for Prevalence of FASD in a Sixth Sample in a South African Community
2.1.1. Tier I: Random Selection and Measurement of Physical Features
In Tier I, all consented and assented children were measured for height, weight, and head circumference [occipital frontal circumference (OFC)]. All children ≤25th centile on height, weight and/or OFC were advanced to Tier II for physical examinations. In addition, 350 enrolled students from the 13 schools were selected randomly from class rolls to participate as potential cases or controls, and 223 of these children had been consented into the study (See Figure 1). All children who had been consented to enter the study, who had been chosen randomly, and/or who fell below the 25th centile on one of more of the size criteria, were advanced to Tier II for a physical examination (n=561).
2.1.2. Tier II: Dysmorphology Exams
In Tier II, experienced pediatric dysmorphologists/medical geneticists performed live examinations of 554 children, and data were documented on standardized forms. All examiners were blinded from any information regarding the children and their mothers. Before each physical exam, 2-dimensional facial photographs of all children were taken for future reference during the final case conference. If any of the cardinal physical traits or minor anomalies associated with one of the four diagnoses on the continuum of FASD were present in a child, the child was advanced to Tier III. Additionally, all randomly-selected children, regardless of their size or dysmorphology findings, were advanced to Tier III for diagnosis as a case or as a typically-developing control. If the exams and testing indicated development in the normal range, randomly-selected children became controls. Based on exams and/or random selection, 394 children and their mothers/guardians qualified for Tier III of the diagnostic process.
2.1.3. Tier III: Assessment of Cognitive and Behavioral Traits
Cognitive and behavioral testing of eligible children was conducted in Tier III. Four tools assessed neurobehavioral traits of consented children: 1) Test of Reception of Grammar (TROG), a measure of verbal intelligence (Bishop, 1989); 2) Raven Coloured Progressive Matrices, a measure of nonverbal intelligence (Raven, 1981); 3) Digit-Span Scaled Score of the Weschler Intelligence Scales for Children, fourth edition (WISC-IV), to assess short-term memory and executive functioning (Wechsler, 2003); and 4) the Achenbach Teacher Report Form to measure inattention and problem behaviors (Achenbach and Rescorla, 2001).
2.1.4. Tier III: Maternal Risk Factor Assessment: Proximal and Distal Variables
To ensure accuracy in the reporting of alcohol use during the index pregnancy, highly trained and experienced, Afrikaans-speaking, grant-funded field staff administered maternal interviews to all available and consenting mothers (n=364; 92.4%). Maternal interviews gathered information regarding general health, childbearing history, nutrition, alcohol and other drug use and socioeconomic status (SES) before, during and after the birth of the index child. Drinking questions adhered to a structured timeline follow back, evidence-based format, to maximize recall and minimize under-reporting (Sobell et al., 2001, 1988). Under-reporting is believed to be more common when the interviews are carried out quickly in busy prenatal clinics by medical staff (Jacobson et al., 2002). A one-week, day-by-day, retrospective drinking log linked to nutrition questions documented current alcohol consumption (King, 1994) and served as a baseline quantification of alcohol use before the questions moved onto retrospective reports of alcohol consumption prior to the index pregnancy and during each trimester. Retrospective reports of alcohol use during pregnancy have also been characterized as more accurate than those reported in prenatal clinics, for respondents may often report no alcohol use or reduced consumption to healthcare providers (Czarnecki et al., 1990; Hannigan et al., 2010). These techniques have been used successfully in other studies and countries by others as well as our team (Chambers et al., 2019b; Jacobson et al., 2008; May et al., 2017, 2016d, 2016a, 2013, 2008, 2005; Popova et al., 2019; Viljoen et al., 2005, 2002). Previous South African studies have also confirmed that such direct maternal reports of prenatal alcohol use are accurate in this particular population. Two alcohol use biomarkers have been employed to confirm the accuracy (>90%) of the reporting by women from this population (May et al., 2018b). Both proximal and distal maternal risk variables were covered in the interviews. Proximal variables measured drinking and other drug use, including the quantity, frequency and (gestational) timing of use and drinking during the period of breastfeeding (May et al., 2016c). Distal variables measured the mothers’ physical characteristics, childbearing history, SES and other demographic variables.
Variations on the American “Standard Drink” (14g of absolute alcohol (AA)) were employed due to the fact that the South African standard drink is 12g (“What Is A Standard Drink? | National Institute on Alcohol Abuse and Alcoholism (NIAAA),” n.d.). Furthermore, because South African wine and beer are somewhat higher in alcohol content on average, these amounts were used as standard drinks: 340mL at 5% alcohol by volume for beer; 120mL of wine (14% by volume); and 50mL of 40% alcohol by volume for liquor.
2.1.5. Multidisciplinary Case Conference for Final Diagnosis
At the end of the three-tier process, a multidisciplinary case conference provided a final diagnosis for each child. Research team members who had collected the information from examinations, testing and maternal interviews evaluated the data and findings from all domains, including growth, dysmorphology, cognitive/behavioral performance, and maternal risk factors. After formally reviewing the detailed data and findings for each child and the corresponding maternal interview, a final diagnosis (or in a few cases, a deferral for more information to a later decision date) was made by the dysmorphologists with the consensus of the entire clinical team.
2.2. IOM Diagnostic Categories
The revised IOM diagnostic criteria (Figure 2) for FASD were employed (Hoyme et al., 2005, 2016). Philtrum and vermilion border morphology were assessed utilizing the South African lip/philtrum guide, which was developed specifically for this predominantly Cape Coloured population (Hoyme et al., 2015). For children with FAS, significant growth restriction and specific facial dysmorphia must be present. For a child to qualify for a diagnosis of PFAS, less growth restriction is required. However, at least two of the three cardinal facial features must be present to make a diagnosis of either FAS or PFAS. The revised IOM guidelines allow FAS and PFAS diagnoses to be made by qualified practitioners without direct documentation of alcohol exposure after ruling out other malformation syndromes with similar phenotypes (Hoyme et al., 2005, 2016). In this and all previous WCP community studies, diagnosing children as FAS or PFAS without direct maternal reports of prenatal exposure or detailed collateral reports from close relatives has been rare (May et al., 2016d, 2016a, 2013, 2011, 2008). A diagnosis of ARND or ARBD requires direct maternal reporting, or in very rare instances, other direct documentation such as alcohol-related injury or arrest or collateral reports from close associates of the mother indicating a significant level of alcohol exposure in the index pregnancy. A summary total dysmorphology score is used as a descriptive, numerical summary of cardinal physical features that are characteristic of FASD for each child; but this score is not used as a rigid cut off measure for any of the diagnoses in the FASD continuum. It reflects a single number to describe of total weighted value of the specific physical features commonly found in children exposed to alcohol prenatally (see Hoyme et al., 2016).
Figure 2.
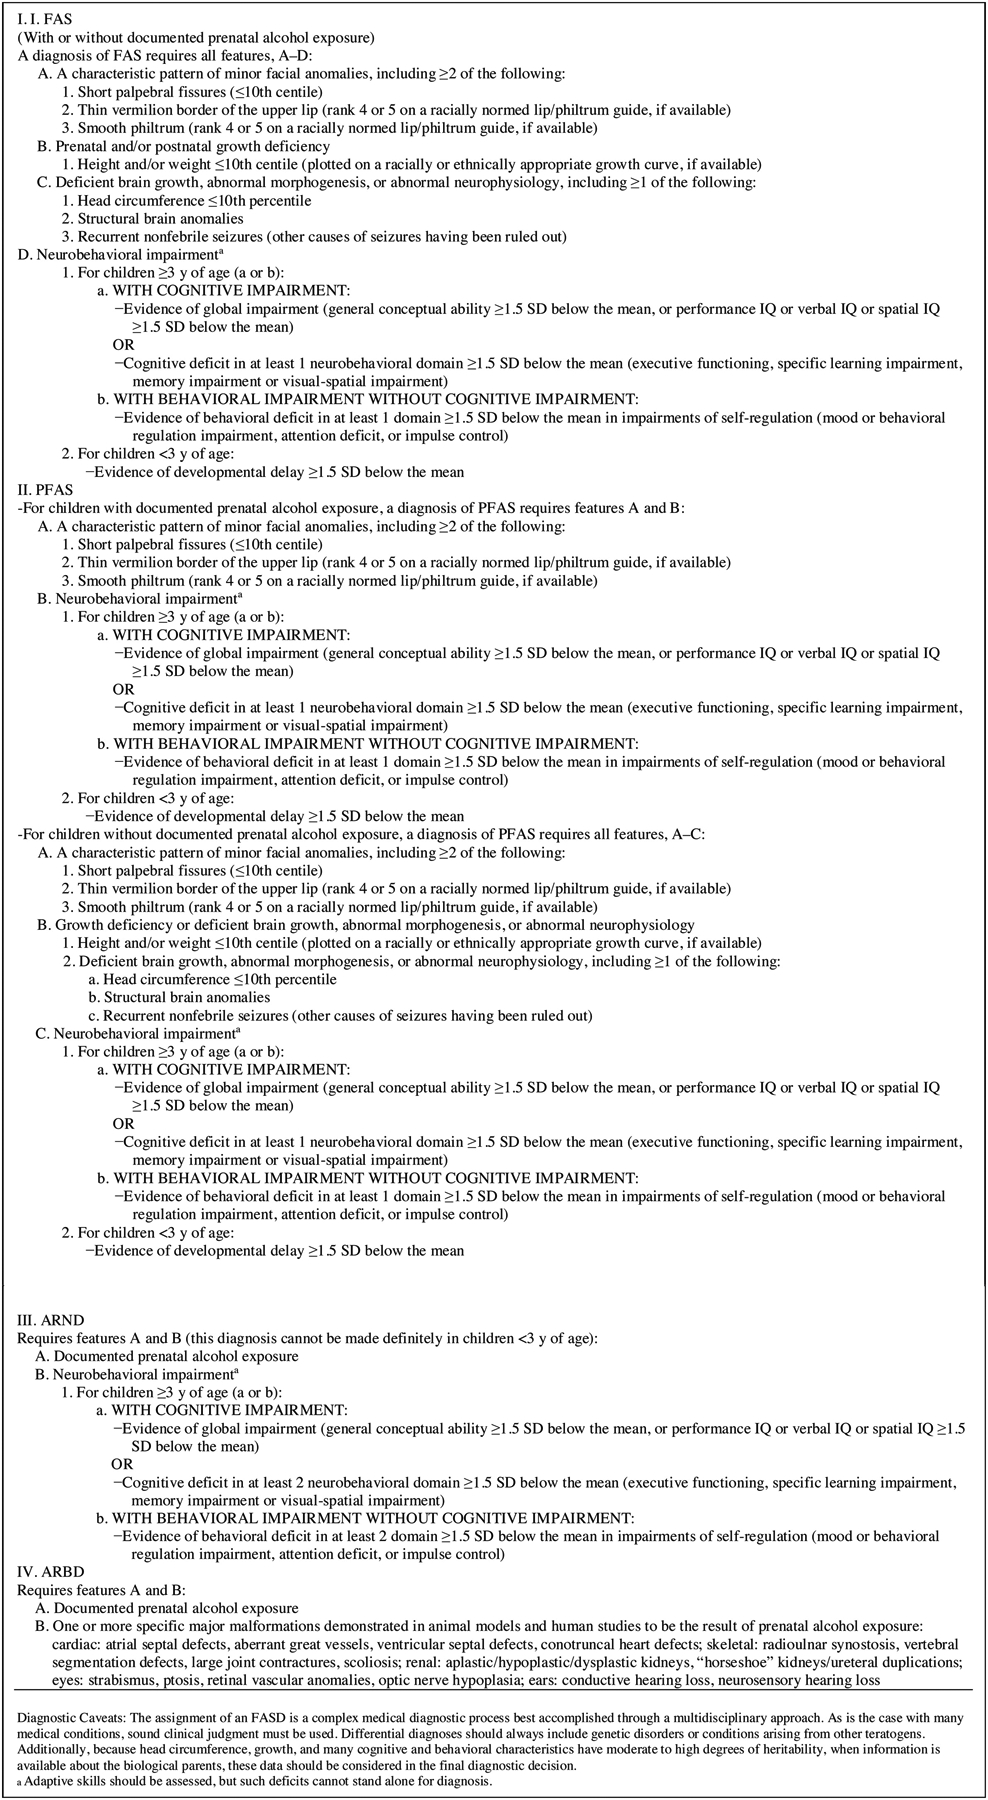
Institute of Medicine Diagnostic Guidelines for Specific Fetal Alcohol Spectrum Disorders (FASD) as clarified by (Hoyme et al., 2005). Reproduced with permission from Pediatrics, Vol. 138, Pages 3–4, Copyright © 2016 by the AAP
2.3.1. Statistical Analysis
Data were entered and analyzed using Excel (Microsoft Excel, 2015) and SPSS Version 25.0 (IBM, 2017). Case control analyses compared results across FASD diagnostic groups and controls. Chi-square, t-tests, z-tests of proportions, and one-way analysis of variance (ANOVA) using Bonferroni-adjusted values, where appropriate, determined statistical significance as noted in the tables (Tabachnick and Fidell, 2019). Post-hoc analyses utilized Dunnett’s C pairwise comparisons (α=.05) on statistically significant ANOVAs to determine bivariate significance. Dunnett tests control for alpha error (Type 1; false positive) produced when performing multiple comparisons of group means (Tabachnick and Fidell, 2019).
2.3.2. Estimating True Prevalence
The estimated prevalence of individual diagnoses within the FASD continuum were calculated as low to high based on three techniques. First, crude rates were based on two denominators: all children attending first grade (enrollment rate); and the total number of children with consent to participate in the study (sample rate). Second, the proportion of FASD cases by individual diagnosis was derived from random sample entrants into the study, and the estimated rate (per 1,000) for all enrolled students was calculated by applying these proportions to estimate the number of cases missed because of non-consent. Third, the final weighted estimates were derived from: (a) FASD cases diagnosed in the consented sample, added to (b) the estimated cases in the non-consented sample utilizing the proportional diagnostic distribution of FASD cases among randomly-selected children, added to (c) the proportion of small children not randomly-selected and not tested for ARND, but who might have qualified for an ARND diagnosis. Then the sum of a+b+c was divided by all first-grade children enrolled in the schools. For a full description and the formula of these weighted prevalence methods see May et al (2018a).
2.3.3. Association Analysis
Zero-order correlations were calculated to determine the association of all social and environmental risk factors and prenatal alcohol use with selected child traits. Partial correlation analysis was also performed. Partial correlations adjusted for household income and mother’s education to determine the primary associations between maternal alcohol use and the same select neurobehavioral outcomes and dysmorphology as in the zero-order correlations. Analysis of variance explained by measures of drinking and socio-environmental variables was performed via stepwise multiple regression. Binary logistic regressions, adjusted for tobacco use, were performed to predict the: 1) odds of an FASD diagnosis in this community by usual DDD in the first trimester and 2) by all trimester combinations.
3. Results
3.1. Child Physical Growth, Physical Development and Dysmorphology
Data in the first column of Table 1 were not included in the statistical analyses. They represent values for all consented children who received dysmorphology exams. The average age of the first graders was 7.0 years (83.6 months), with a mean height of 116.4 cm, an average weight of 20.5 kg and an OFC of 50.6 cm. There were minimal differences when compared with the randomly-selected control group. In this first grade cohort of the study community, 48 children were diagnosed with FAS, 65 with PFAS and 67 with ARND. Not included in Table 1, or any of the child trait tables, was one child who was diagnosed with ARBD, very rare condition in every population. All statistically significant variables across groups met Bonferroni-adjusted levels (p<.0038), indicating that the IOM diagnostic criteria worked well to distinguish FASD groups from controls. Post hoc analysis indicated that total dysmorphology score and OFC significantly differentiated every group from one another in inter-group comparison with Dunnett C (bivariate) comparison tests (p<.05). Height, weight, and palpebral fissure length (PFL) were also significantly different in five inter-group bivariate comparisons, and BMI distinguished the diagnostic groups significantly in three comparisons. One might also note that children with ARND differed significantly (actually p<.001) from randomly-selected, typically-developing controls on height, weight, BMI, and total dysmorphology score.
Table 1.
Children’s Demographic, Growth, Cardinal FAS Variables, and Total Dysmorphology Score from a South African Community with Post Hoc Analysis Summary: A Sixth Sample
| All children1 (n=554) | PFAS (n=65) |
ARND (n=67) |
RS Controls (n=137) | ||||||
|---|---|---|---|---|---|---|---|---|---|
| 48.7 | .715 | ||||||||
| 83.6 | 86.0 | (8.4) | 84.7 | (5.9) | 84.6 | (6.5) | 82.6 | (4.1) | .002C |
| 116.4 | 112.1 | (4.7) | 116.2 | (5.6) | 116.3 | (5.2) | 118.1 | (5.1) | <001A,B,C,E,F |
| 20.5 | 17.7 | (1.8) | 20.4 | (2.6) | 20.0 | (3.1) | 22.0 | (4.1) | <001A,B,C,E,F |
| 15.1 | 14.1 | (1.0) | 15.1 | (1.3) | 14.7 | (1.5) | 15.7 | (2.0) | <001A ,C,F |
| 36.2 | 18.7 | (20.8) | 36.4 | (26.4) | 29.3 | (25.4) | 45.4 | (29.6) | <001A,C,F |
| 50.6 | 48.6 | (1.2) | 50.7 | (1.1) | 49.9 | (1.5) | 51.5 | (1.7) | <001A,B,C,D,E,F |
| -- | <.001 | ||||||||
| -- | <.001 | ||||||||
| -- | 7.5 | (10.9) | 14.6 | (14.1) | 25.8 | (14.2) | 29.0 | (18.1) | <.001A,B,C,D,E |
| <.001 | |||||||||
| <.001 | |||||||||
| -- | <.001 | ||||||||
| -- | <.001 | ||||||||
| -- | 18.1 | (3.1) | 13.2 | (3.2) | 9.7 | (4.2) | 6.9 | (3.8) | <001A,B,C,D,E,F |
All children column was excluded from statistical analyses.
Scores of 4 or 5 on South African Lip/Philtrum Guide (Hoyme et al, 2015).
Bonferroni-adjusted value: p<.0038
Significant (p<.05) post-hoc Dunnett C comparisons between:
FAS & PFAS;
FAS & ARND;
FAS & Controls;
PFAS& ARND;
PFAS & Controls;
ARND & Controls
Children with FAS tended to be older than those in other groups, for some were repeating first-grade. In Table 1 and Figure 3, one can observe that mean OFC differed significantly across all groups, whether measured by centile or actual measurement. True microcephaly (OFC ≤3%) was documented in 58% of children with FAS and in 33% of those with ARND. Table 1 and Figure 3 also document the significant bivariate difference in total dysmorphology score among the diagnostic groups and from typically-developing controls. The FAS group displayed the highest dysmorphology score (18.1), followed in a continuumlike manner by PFAS (13.2), ARND (9.7), and controls (6.9).
Figure 3.
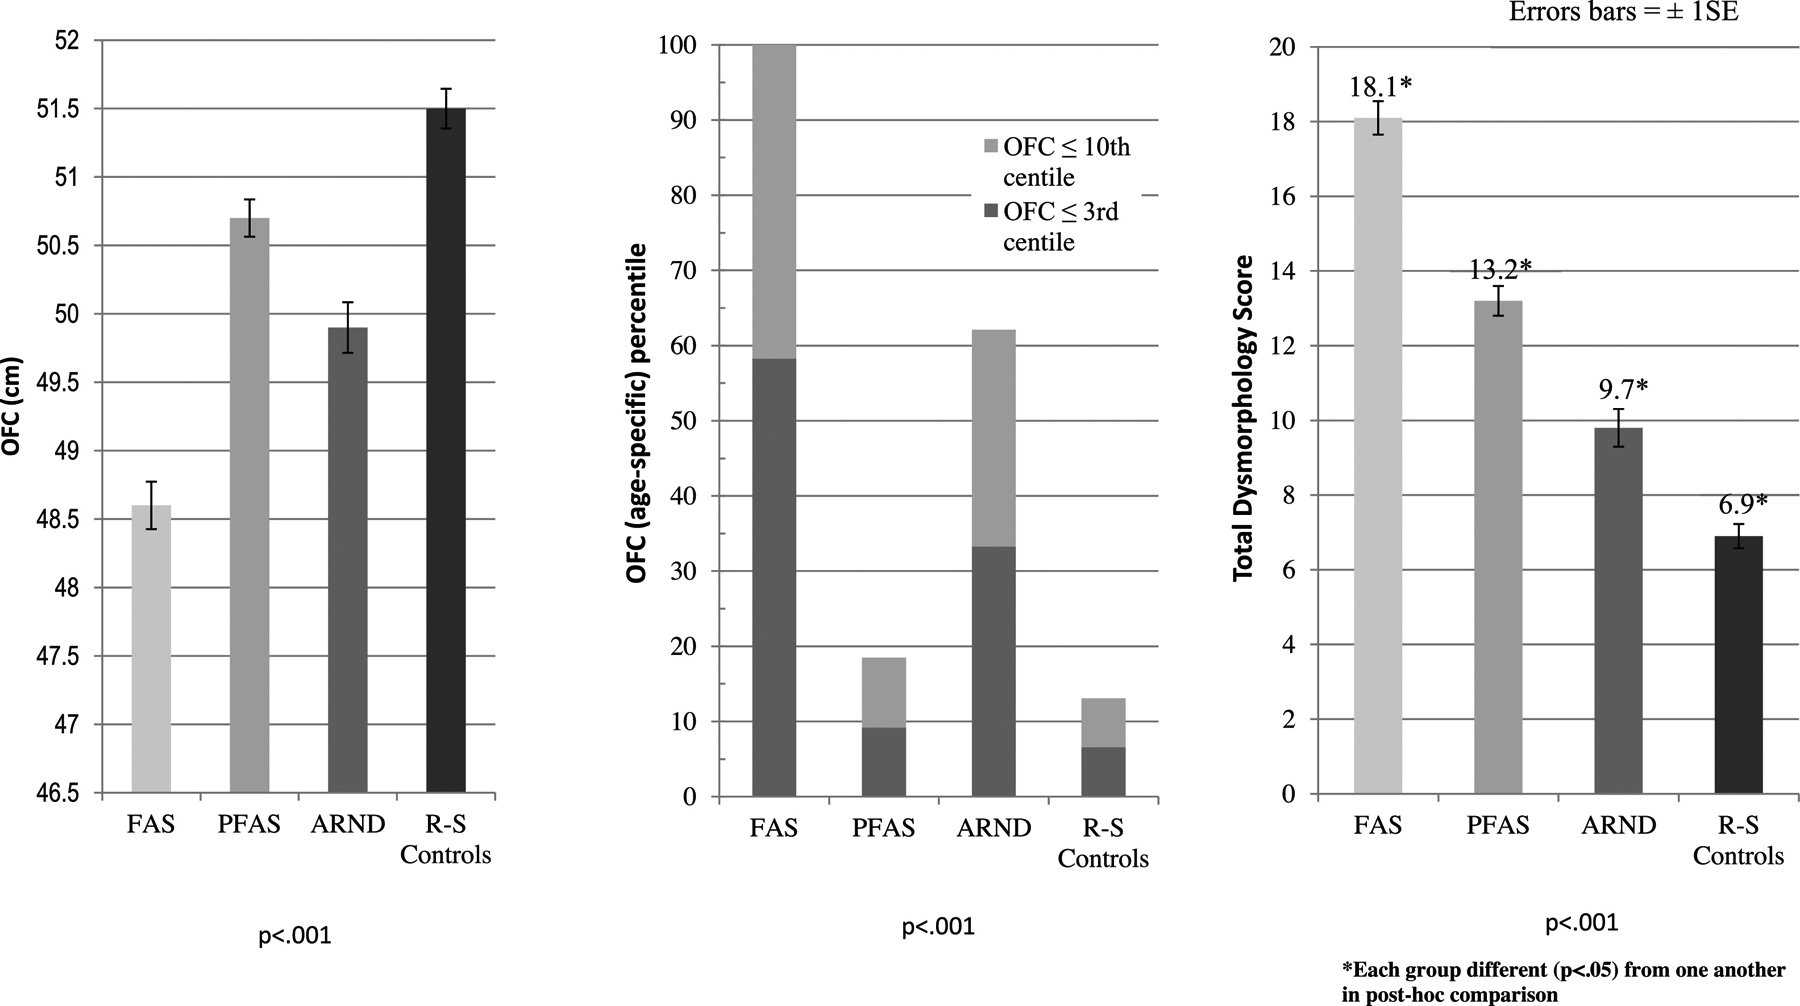
Average Occipitofrontal (head) Circumference (OFC) by Measurement (cm) and Age-specific Percentile and Total Dysmorphology Scores by Diagnostic Category for a Sixth South African Sample
3.2. Other Minor Anomalies
Table 2 presents other minor anomalies observed in children with FAS, PFAS, ARND and the randomly-selected, verified, typically-developing controls. Maxillary and mandibular arcs, inner pupillary distance (IPD), outer canthal distance (OCD), hypoplastic midface, “railroad track” or “cupped” ears, and ptosis differed significantly across diagnostic groups at the Bonferroni-adjusted level (p<.0045) Flat nasal bridge, prognathism and altered palmar creases are significant at levels <.01, therefore approaching significance on the Bonferroni-adjusted alpha level Children with PFAS are the most prognathic when compared to other diagnostic groups (16.9%). Maxillary and mandibular arc measurements and OCD were also strong discriminators in post-hoc comparisons. The ARND group was again significantly different from the control group on three post hoc comparisons: maxillary arc, mandibular arc, and outer canthal distance.
Table 2.
Other Minor Anomalies of Children with FAS, PFAS, and ARND Compared to Controls: A Sixth Sample in South Africa
| PFAS (n=65) |
ARND (n=67) |
RS Controls (n=137) |
p-value | |||||
|---|---|---|---|---|---|---|---|---|
| Maxillary Arc (cm) – Mean (SD) | (0.8) | 23.9 | (0.9) | 23.7 | (0.9) | 24.2 | (1.0) | <.001A,B,C,F |
| Mandibular Arc (cm) – Mean (SD) | (1.0) | 24.7 | (1.0) | 24.9 | (1.0) | 25.4 | (1.2) | <.001B,C,E,F |
| Inner canthal distance (ICD) centile – Mean (SD) | (22.4) | 50.5 | (22.2) | 45.1 | (22.5) | 53.2 | (21.5) | .107 |
| Inter pupillary distance (IPD) centile – Mean (SD) | (24.6) | 49.6 | (24.4) | 48.9 | (21.8) | 57.5 | (23.7) | .002C |
| Outer canthal distance (OCD) centile – Mean (SD) | (11.4) | 24.2 | (13.5) | 23.3 | (12.5) | 34.3 | (19.3) | <.001A,C,E,F |
| .001 | ||||||||
| .003 | ||||||||
| .007 | ||||||||
| .012 | ||||||||
| .006 | ||||||||
| <.001 | ||||||||
Bonferroni-adjusted value: p<.0045
Significant (p<.05) post-hoc Dunnett C comparisons between:
FAS & PFAS;
FAS & ARND;
FAS & Controls;
PFAS& ARND;
PFAS & Controls;
ARND & Controls
3.3. Race of the Children by Diagnosis
The racial breakdown of the children consented into the study was: 9.1% Black, 86.1% Cape Coloured (mixed race), and 4.8% White (Table A.1. in Appendix ). Of the 727 consented children, four of the black children were diagnosed with an FASD, as were 173 of the Coloured children and three of the White children. Whether measured by specific FASD diagnosis (chi-square=20.8, df =8, p=.008) or as FASD vs not FASD (chi-square=20.1, df=2, p<.001), this distribution is significantly different (Table A.2 in the Appendix). FASD is most prevalent among mixed-race children, then the White, and least among the Black. Of the total 180 children diagnosed with an FASD, 96% of the children with FASD were Cape Coloured even though they were 86% of the children in the study. This was a significant over-representation (z=4.509, p<.001) (see Table A.3 in the Appendix). Nine percent (9%) of the White children received an FASD diagnosis, while they were 5% of those in the study (z=1.696, p=not statistically significant). The Black African children had a significantly lower proportion of FASD diagnoses (2%) than the 9% representation in the study (z=4.509, p<.001).
3.4. Cognitive and Behavioral Traits
Cognitive and behavioral results in Table 3 characterize low average achievement levels for all community children, and one-way ANOVA values indicated significant differences among all diagnostic groups on each neurobehavioral indicator. Mean values for the control group were best for all five measures, and all the FASD groups were performing significantly lower than controls on all measures. The ARND and FAS groups had the lowest mean scores on TROG (verbal ability), Raven (non-verbal ability) and the Digit Span (working memory and executive functioning). Children with FAS had the highest means for behavioral and inattention problems. In post hoc analysis, average total behavioral problems were significantly higher among subjects with each of the FASD diagnoses than controls. Inattention problem scores were the most discriminating among the group averages, for all but two inter-group comparisons were significantly different (FAS vs ARND and FASD and ARND).
Table 3.
Mean Scores on Developmental and Behavioral Indicators1 of Children with FAS, PFAS, and ARND Compared to Controls from a South African Community with Post Hoc Analyses: A Sixth Sample
| FAS (n=48) |
PFAS (n=65) |
ARND (n=66)2 |
RS Controls (n=119)2 | p-value | |||||
|---|---|---|---|---|---|---|---|---|---|
| TROG Percentile Score^ | 4.1 | (10.3) | 4.8 | (9.9) | 2.6 | (7.3) | 9.4 | (15.7) | .001F |
| Raven Percentile Score+ | 16.1 | (13.4) | 19.2 | (14.2) | 16.9 | (13.3) | 34.0 | (21.1) | <.001C,E,F |
| WISC IV Digit Span Percentile Score | 18.5 | (21.8) | 28.2 | (26.7) | 19.3 | (22.1) | 40.5 | (29.1) | <.001C,E,F |
| Total Behavior Problems | 75.5 | (25.7) | 65.0 | (26.1) | 62.1 | (29.1) | 43.3 | (29.6) | <.001C,E,F |
| Total Inattention Problems | 76.5 | (27.1) | 58.7 | (28.9) | 63.8 | (30.1) | 42.9 | (27.1) | <.001A,C,E,F |
All scores standardized for age of child at time of testing.
One child with ARND and 18 controls did not complete the entire test battery.
Test of Reception of Grammar (TROG). A measure of verbal intelligence.
Raven Coloured Progressive Matrices. A measure of nonverbal intelligence.
Bonferroni-adjusted value: p<0.01
Significant (p<.05) post-hoc Dunnett C comparisons between:
FAS & PFAS;
FAS & ARND;
FAS & Controls;
PFAS&ARND;
PFAS & Controls;
ARND & Controls
3.5. Distal Maternal Risk – Physical, Childbearing, and Demographic
The ANOVA analysis indicated that mothers of children with FASD were significantly shorter, lighter, and demonstrated lower BMIs, lower education, lower household income and were later in recognition of the index pregnancies (11.9–15.8 weeks) than the mothers of controls (11.2 weeks) (Table 4). Means of gravidity and parity were all higher among mothers of children with FASD, although not a statistically significant difference from other diagnostic groups when Bonferroni-adjustment was applied. Post hoc analysis indicated that the only significant bivariate difference for gravidity and parity was between mothers of children with FAS and controls for gravidity. Other post-hoc significance on weight was reported for lower maternal weight, BMI, head circumference, and number of years of schooling completed between mothers of children with FAS, PFAS, and ARND vs controls. Mothers of children with FAS were later in pregnancy recognition than were mothers of children with ARND and controls. Household income was less for mothers of children with FAS than controls and for mothers of children with ARND than controls.
Table 4.
Maternal Physical, Demographic, Childbearing, and Drinking of Alcohol in South Africa: A Sixth Sample
| FAS (n=48) |
PFAS (n=65) |
ARND (n=67) |
RS Controls (n=117) |
|||||||||||
|---|---|---|---|---|---|---|---|---|---|---|---|---|---|---|
| Mean | (SD) | Mean | (SD) | Mean | (SD) | Mean | (SD) | p−value | ||||||
| Physical, Demographic and Childbearing Variables | ||||||||||||||
| Maternal height (cm) | 154.2 | (6.4) | 157.3 | (6.5) | 158.6 | (7.2) | 160.0 | (6.9) | <.001B,C | |||||
| Maternal weight (kg) | 59.7 | (18.5) | 64.1 | (17.0) | 62.3 | (13.7) | 76.4 | (18.8) | <.001C,E,F | |||||
| Maternal body mass index (BMI) | 24.9 | (7.0) | 26.1 | (6.6) | 24.8 | (5.2) | 29.8 | (6.6) | <.001C,E,F | |||||
| Maternal head circumference (cm) | 54.2 | (1.8) | 55.0 | (2.2) | 54.8 | (1.9) | 55.9 | (2.2) | <.001C,E,F | |||||
| # of years of school completed | 7.8 | (2.9) | 8.5 | (2.3) | 8.7 | (2.0) | 10.2 | (1.9) | <.001C,E,F | |||||
| Household income (in Rands) | 1307 | (1078) | 1482 | (1308) | 1223 | (1397) | 2302 | (3106) | .004C,F | |||||
| Gravidity | 3.6 | (1.5) | 3.4 | (1.8) | 3.0 | (1.4) | 2.8 | (1.4) | .005C | |||||
| Parity | 3.3 | (1.5) | 3.1 | (1.5) | 2.7 | (1.3) | 2.6 | (1.3) | .018 | |||||
| Child’s birth order | 2.7 | (1.5) | 2.5 | (1.5) | 2.1 | (1.1) | 2.1 | (1.3) | .023 | |||||
| Maternal age (years) during pregnancy | 27.1 | (7.2) | 25.8 | (6.5) | 25.0 | (6.3) | 26.2 | (6.9) | .427 | |||||
| Aware of pregnancy (weeks) | 15.8 | (7.1) | 13.7 | (6.1) | 11.9 | (5.9) | 11.2 | (5.8) | <.001B,C | |||||
| Alcohol Consumption Reported for the Index Pregnancy | ||||||||||||||
| 3 months before pregnancy, usual # of drinks per drinking day (DDD) | 7.8 | (6.1) | 5.3 | (4.3) | 6.2 | (3.5) | 2.2 | (3.9) | .001C,E,F | |||||
| Direct evidence of drinking during pregnancy (% Yes)1 | 85.1 | 85.1 | 100.C | 37.3 | <.001 | |||||||||
| Once pregnancy known, usual number of DDD | 5.1 | (5.9) | 2.8 | (4.1) | 2.6 | (4.2) | 0.7 | (3.0) | <.001C,E,F | |||||
| Drank in 1st trimester (%) | 85.1 | 81.5 | 98.5 | 36.4 | <.001 | |||||||||
| Usual number of DDD in 1st trimester | 8.0 | (6.5) | 5.1 | (4.2) | 6.1 | (4.1) | 2.1 | (3.9) | <.001C,E,F | |||||
| Usual number of DDD in 1st trimester2 | 9.4 | (6.0) | 6.3 | (3.8) | 6.2 | (4.1) | 5.9 | (4.5) | .002A,B,C | |||||
| Usual Frequency of DDD in 1st trimester2 | ||||||||||||||
| Drank in 2nd trimester (%) | 71.7 | 55.4 | 55.2 | 15.3 | <.001 | |||||||||
| Usual number of DDD in 2nd trimester | 6.8 | (6.9) | 3.1 | (4.0) | 3.4 | (4.3) | 1.0 | (3.4) | <.001C,E,F | |||||
| Usual number of DDD in 2nd trimester2 | 9.6 | (6.3) | 5.8 | (3.8) | 6.3 | (4.1) | 7.4 | (6.0) | .014A | |||||
| Usual Frequency of DDD in 2nd trimester2 | ||||||||||||||
| Drank in 3rd trimester (%) | 55.3 | 38.5 | 28.4 | 12.5 | <.001 | |||||||||
| Usual number of DDD in 3rd trimester | 4.2 | (5.3) | 2.1 | (3.9) | 1.9 | (4.0) | 0.7 | (2.9) | <.001C | |||||
| Usual number of DDD in 3rd trimester2 | 7.8 | (4.9) | 6.0 | (4.4) | 7.1 | (5.0) | 7.9 | (6.9) | .648 | |||||
| Usual Frequency of DDD in 3rd trimester2 | ||||||||||||||
| Tobacco and Other Drug Variables | ||||||||||||||
| Grams of tobacco used per week3 | 43.3 | (26.7) | 49.6 | (37.3) | 42.8 | (30.1) | 51.9 | (46.8) | .604 | |||||
| Used tobacco during pregnancy (% Yes) | 60.9 | 62.5 | 74.2 | 35.0 | <.001 | |||||||||
| Used other drugs during pregnancy (% Yes) | 0.0 | 5.9 | 2.3 | 2.5 | .564 | |||||||||
Significant (p<.05) post-hoc Dunnett C comparisons between:
FAS & PFAS;
FAS & ARND;
FAS & Controls;
PFAS& ARND;
PFAS & Controls;
ARND & Controls
Bonferroni-adjusted significant values: demographic and childbearing: p≤.0045; drinking variables: p<.0036; tobacco and other drugs: p<.017
In over 90% of the cases, the source of the direct evidence of alcohol used during the index pregnancy is the maternal interview. In the other cases, evidence is from collateral reports of relatives or close associates.
Among drinkers only in the specific time period.
Among women who reported using tobacco in the previous 12 months.
DDD = drinks consumed per drinking day
3.6. Proximal Maternal Risk – Alcohol Use in the Index Pregnancy
Results for proximal risk factors revealed significant maternal differences among groups for many drinking variables (Table 4). Average DDD for mothers of children with FAS was highest prior to pregnancy and in every trimester. Fewer mothers of children with PFAS (82%) reported drinking during the first trimester but drank fewer days per week than mothers of FAS and ARND children. Thirty-six percent (36%) of mothers of normal controls reported drinking during first trimester, and 64% abstained. All mothers of children with ARND were confirmed to have had an alcohol-exposed pregnancy through either collateral informants or self-report, and first trimester drinking was reported by 98.5%. The trend in drinking by trimester was downward; mothers of children in all the FASD diagnostic categories reported lower DDD and less frequent drinking in second and third trimesters. Mothers of children with FAS went from reports of 85.1% in first trimester to 55.3% in the third trimester (difference of 29.8%, p<.001). Similar or greater declines from first to third trimester in all maternal groups were equally significant (p<.001) via z-tests (see analysis in Appendix Table A.4). DDD in all groups declined from first to third trimester, but none of these reductions were significant (see Appendix Table A.5). However, mothers of children with FAS reported less reduction of both percentage drinking and quantity DDD in the last two trimesters.
3.7. Prevalence Rates
Final diagnoses and the first estimation of prevalence are presented in the left side of Table 5 and Figure 4. Forty-eight (48) children were diagnosed with FAS, 65 with PFAS, 67 with ARND and 1 with ARBD. Oversampling of small children in Tier I provided the greatest probability of including virtually every child with FAS or PFAS who had consent to participate. Using technique one, the lowest possible rate for FAS was 42.6, and the lowest possible high rate was 65.3 per 1,000. The rate of total FASD was lowest at 160.5 and lowest high estimate was 246.3 per 1,000.
Table 5.
Prevalence Rate (per 1,000) of Individual Diagnoses within Fetal Alcohol Spectrum Disorders (FASD) and Total FASD by Three Methods of Estimation from a Sixth Sample in A South African Community
| Oversample of children ≤25th centile on height, weight, or OFC | Random Sample Rate of FASD Diagnosesand Estimated Cases in the Non-Consented Children | (c) EstimatedARND casesin non-randomly selected small children screened negative forFAS orPFAS (n=160) | Combined rate from cases: a) in consented sample (n=735) and b) estimated cases in non-consented sample (n=393) and c) small children not followed in Tier III | |||||||||
|---|---|---|---|---|---|---|---|---|---|---|---|---|
| Diagposis | (a) Total Cases Diagnosed n | School Enndlment rate1 (n=1128) | Consented student rate2 (n=735) | Cases found among randomly-selected control candidates n | Proportion of FASD cases in random sample (n=210) | (b) Estimated Cases in non-consented sample (n=393) | Rate of FASD from random sample only3 | 95% Confidenc e Intervals | (a+b+c) Total diagnosed and estimated cases n | Final estimate d rate for all enrolled students4 | 95% Confidence Intervals | |
| FAS | 48 | 42.6 | 65.3 | 14 | .06666 | 26 | 66.7 | 32.9–100.4 | -- | 74 | 65.7 | 51.3–80.2 |
| PFAS | 65 | 57.6 | 88.4 | 22 | .10476 | 41 | 104.8 | 63.3–146.2 | -- | 106 | 94.1 | 77.1–111.2 |
| ARND | 67 | 59.4 | 91.2 | 37 | .17619 | 69 | 176.2 | 124.7–227.2 | 28 | 164 | 145.3 | 124.9–166.0 |
| ARBD | 1 | 0.9 | 1.4 | 0 | .00000 | 0 | 0.0 | 0.0–.7.6 | -- | 1 | 0.9 | 0.0–2.6 |
| Total FASD | 181 | 160.5 | 246.3 | 73 | .34761 | 137 | 347.6 | 283.2–412.0 | 28 | 345 | 305.9 | 279.0–332.7 |
Denominator is all children attending first grade in local schools. Rate per 1,000 based on the entire enrollment in 1st grade classrooms (n=1128).
Denominator is the total number of children with consent to participate in this study. Rate per 1,000 based on the sample consented and screened (n=735).
Calculated as the FASD cases diagnosed from the randomly-selected control candidates (numerator) over total number of randomly-selected children × 1,000.
Rate per 1,000 children calculated from: FASD cases diagnosed in the consented sample (a), added to the estimated cases in the non-consented sample utilizing the proportional diagnostic distribution of FASD cases among randomly-selected children (b), and divided by all 1st grade children enrolled in the schools (n=1128).
Figure 4.
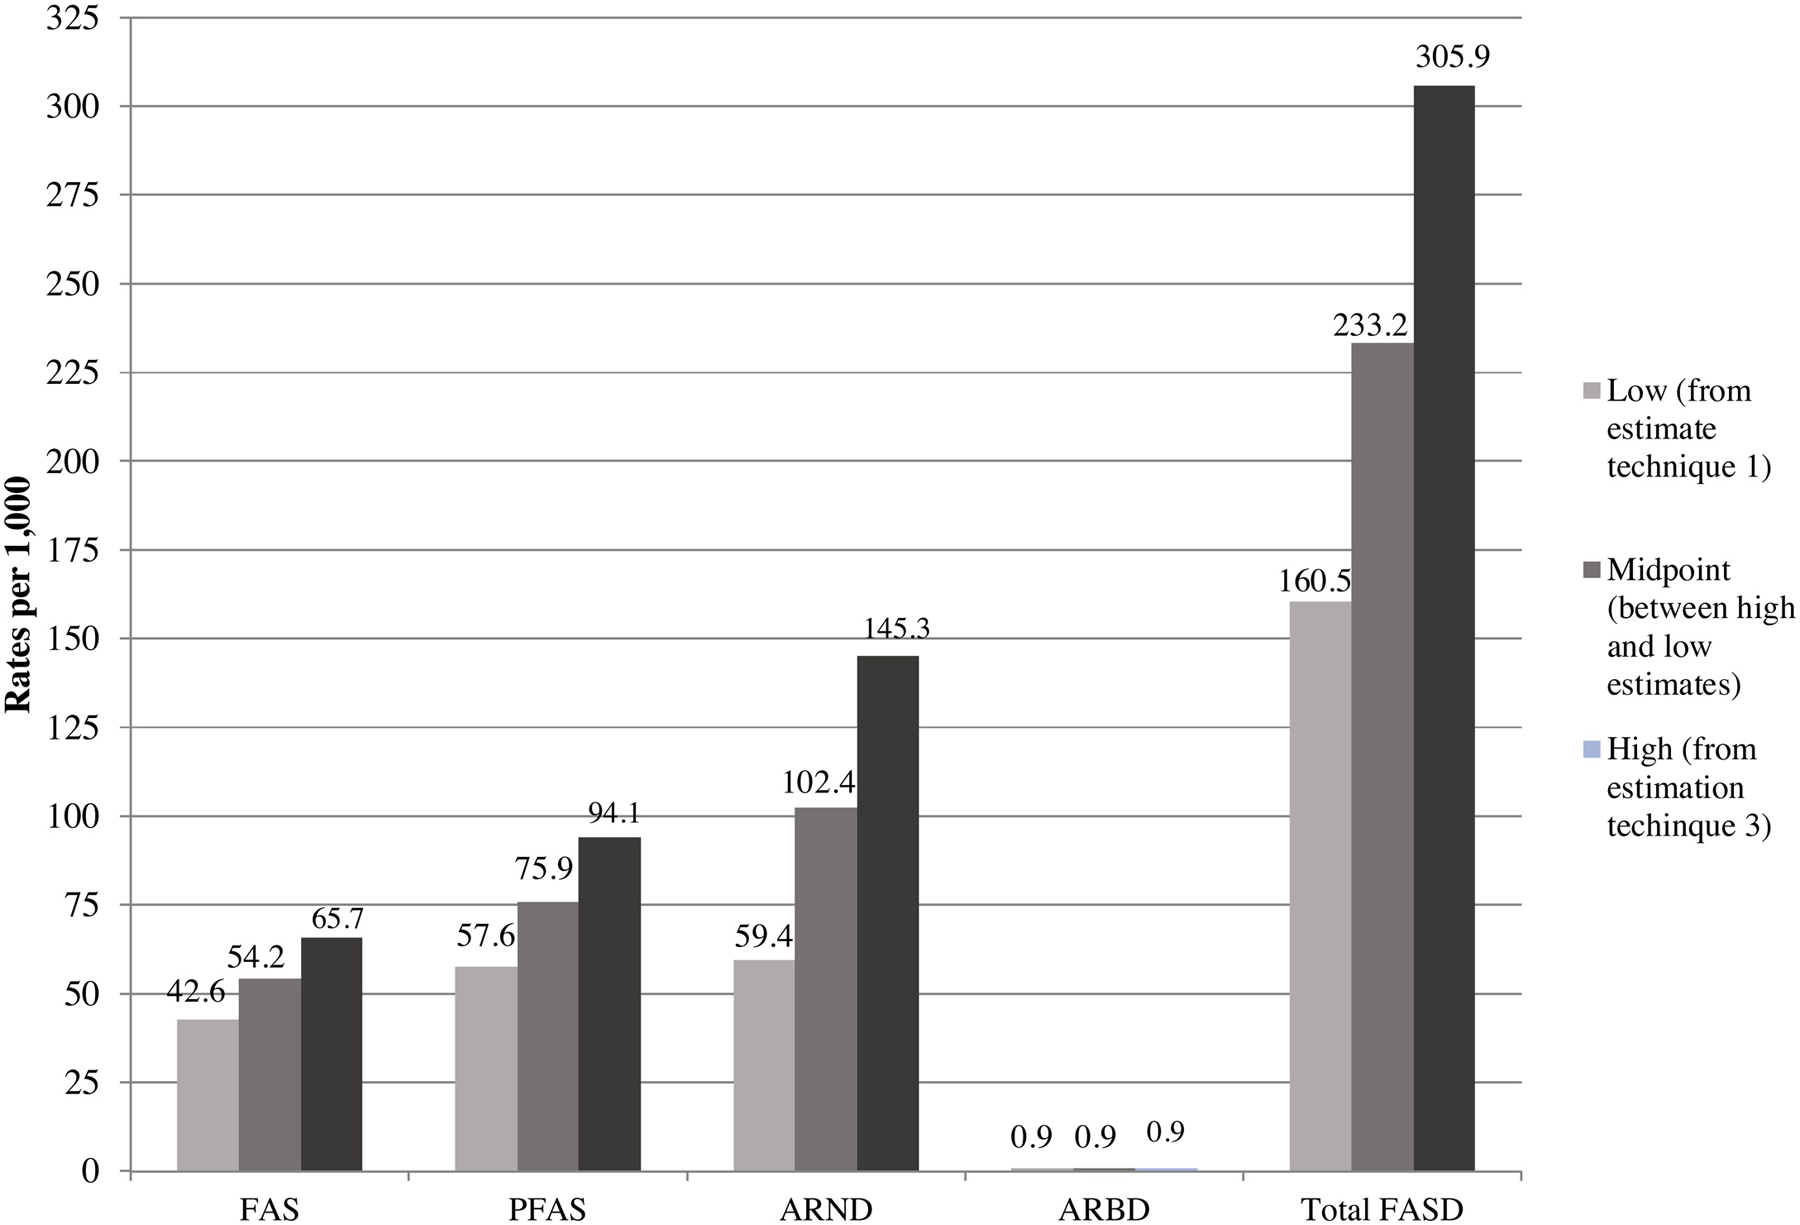
Final Prevalence Rates (per 1,000) of FASD Diagnostic Groups and Controls: A Sixth South African Sample
The second technique produced a single rate of estimated prevalence from the 73 cases and their proportional representation of FASD diagnoses found within the 210 children who entered the study via random selection and completed all tiers of the study (middle section, Table 5). FAS and total FASD rates from this technique were 66.7 FAS cases per 1,000, and the total FASD rate was 347.6 per 1,000. This rate of total FASD was the highest prevalence estimate produced by any of the three techniques employed.
The third and final technique (Table 5, right section), estimated the total number of cases likely to exist among unconsented children (b), and by estimating the probable ARND cases in small children who were not randomly-selected and not tested for neurobehavioral problems (c). This final estimate of true prevalence added (a) the number of cases diagnosed to (b) the cases estimated in the non-consented sample and (c) the estimated ARND cases not tested for neurobehavioral problems among consented children. Therefore, the numerator of technique three is (a + b + c) and the denominator was all 1st grade children in these schools. This third technique estimated the true prevalence of FAS to be 65.7 per 1,000 and total FASD as 305.9 per 1,000 (95% CI=279.0–332.7 per 1,000). Figure 4 graphically displays these rates.
3.8. Prevalence Over Time: 1997–2014
Figure 5 presents prevalence rates per 1,000 children. The prevalence of FAS in this community over this 17-year period has changed in studies over the years. In 1999 the FAS rate was 69 per 1,000 and dropped to 54 per 1,000 in 2003. It then rose to 91 per 1,000 in 2008, was 79 per 1,000 in 2010 and then returned to 66 in this study. FAS is the original FASD diagnosis in what is now the FASD continuum. FAS represents the children with the most severe physical dysmorphology commonly used by pediatric dysmorphologists/geneticists for detecting prenatal alcohol exposure and therefore has had consistent criteria over the span of these studies. PFAS was not utilized as a diagnosis by our clinical team until 2003, and once initiated PFAS prevalence increased from 17 per 1,000 to 70 in 2008, to 106 in 2010 and then trended down only slightly to 94 in 2014. The first use of the ARND diagnosis in this community was in 2008, but it was not yet fully defined by extensive research criteria at that time (Hoyme et al., 2016). Once more detailed diagnostic protocols were developed by a variety of researchers and employed by the clinical team, the rate in this community rose from 47 per 1,000 in 2008 and 48 in 2010 to 148 in 2014. Quite often certain isolated dysmorphic features such as small head size, and subtle minor anomalies are clues to refer a child for neurobehavioral testing to assess possible ARND.
Figure 5: Rate of FAS, PFAS, and ARND in the Original Study Community (W) 1997–2014.
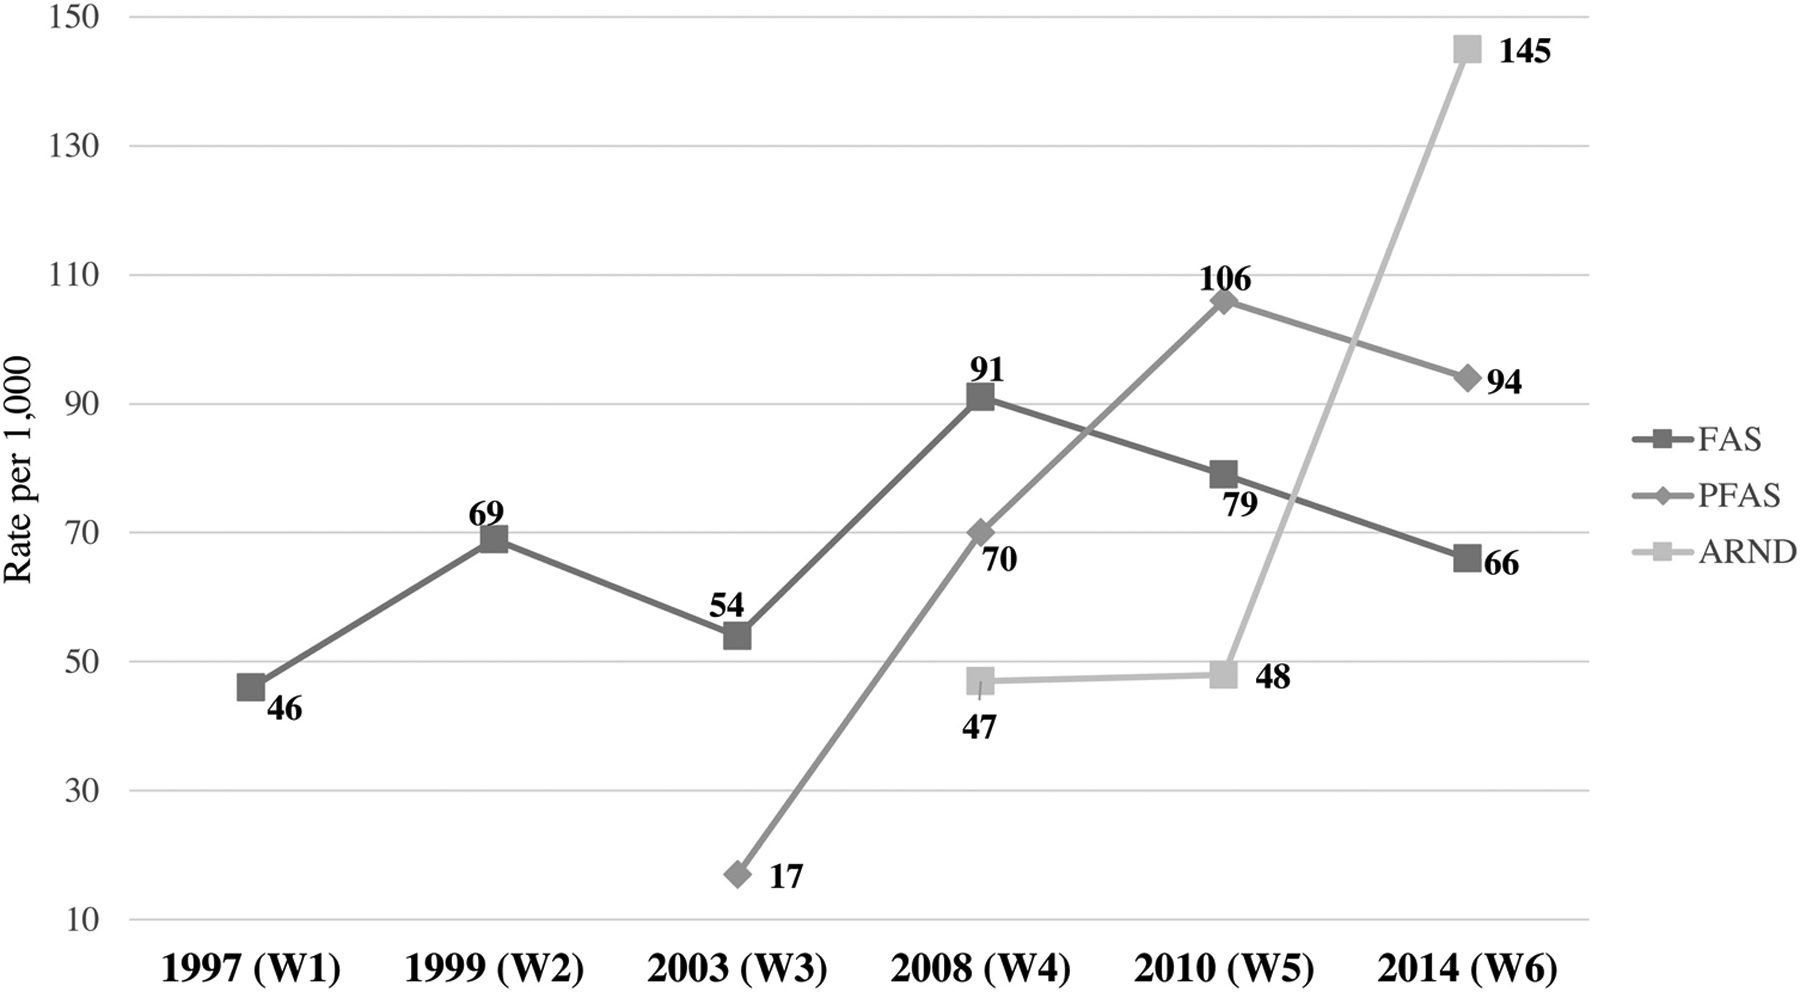
The ARND prevalence rate of 145 per 1,000 children in 2014 reflects both improved skill of diagnosing ARND and also a new, more complete technique for estimating the number of children with ARND among enrolled students. Otherwise, the estimate for children with ARND in 2014 would be 90.1 without the additional estimation technique (estimate “c” in Table 5)
3.9. Zero-Order and Partial Correlation and Multiple Regression Analysis
Table 6 presents zero-order and partial correlation analyses between select child traits and four quantity by timing of drinking variables. The zero-order correlations represent the association between select maternal risk factors in this community and certain child traits. The partial correlations adjusted for household income and level of education of the mother to isolate the effect of alcohol from environmental conditions such as socioeconomic status and poverty.
Table 6.
Zero-Order and Partial Correlation Coefficients (Adjusted for Square Root of Household Income and Square Root of Mother’s Education) for Developmental1 and Physical Dysmorphology Variables with Selected Maternal Drinking Measures During Pregnancy from a South African Community
| Child Trait | Mother Reported Drinking During Pregnancy | Drinks Per Drinking Day During 1st trimester (log) | Drinks Per Drinking Day During 2nd trimester (log) | Drinks Per Drinking Day During 3rd trimester (log) | |||||
|---|---|---|---|---|---|---|---|---|---|
| Verbal abilitya (log) | Zero-Order | Partial | Zero-Order | Partial | Zero-Order | Partial | Zero-Order | Partial | |
| r | −0.065 | −.031 | −0.101 | −.041 | −0.086 | .007 | −0.069 | .028 | |
| P | .228 | .568 | .062 | .452 | .114 | .893 | .200 | .611 | |
| df | 340 | 338 | 340 | 338 | 340 | 338 | 340 | 338 | |
| Non-verbal abilityb (log) | r | −0.167 | −.132 | −0.180 | −.121 | −0.257 | −.173 | −0.215 | −.120 |
| P | .002 | .015 | .001 | .026 | <.001 | .001 | <.001 | .027 | |
| df | 340 | 338 | 340 | 338 | 340 | 338 | 340 | 338 | |
| WISC-IV Digit Span (log) | r | −0.080 | −.041 | −0.112 | −.053 | −0.135 | −.045 | −0.173 | −.078 |
| P | .138 | .446 | .039 | .332 | .012 | .408 | .001 | .149 | |
| df | 340 | 338 | 340 | 338 | 340 | 338 | 340 | 338 | |
| Behaviorc (sqrt) | r | 0.117 | .089 | 0.142 | .091 | 0.140 | .063 | 0.163 | .086 |
| P | .030 | .103 | .009 | .093 | .009 | .247 | .003 | .114 | |
| df | 340 | 338 | 340 | 338 | 340 | 338 | 340 | 338 | |
| Inattention problemsc (sqrt) | r | 0.102 | .070 | 0.153 | .102 | 0.194 | .120 | 0.218 | .142 |
| P | .059 | .197 | .005 | .060 | <.001 | .027 | <.001 | .009 | |
| df | 340 | 338 | 340 | 338 | 340 | 338 | 340 | 338 | |
| Head Circumference (OFC) | r | −0.175 | −.141 | −0.176 | −.111 | −0.213 | −.116 | −0.242 | −.145 |
| P | .001 | .009 | .001 | .041 | <.001 | .032 | <.001 | .007 | |
| df | 340 | 338 | 340 | 338 | 340 | 338 | 340 | 338 | |
| Total Dysmorphology score | r | 0.273 | .241 | 0.318 | .266 | 0.354 | .267 | 0.313 | .212 |
| P | <.001 | .000 | <.001 | .000 | <.001 | .000 | <.001 | .000 | |
| df | 340 | 338 | 340 | 338 | 340 | 338 | 340 | 338 | |
All scores standardized for age of child at time of testing.
Tests of the Reception of Grammar (TROG)
Raven Colored Progressive Matrices
Personal Behavior Checklist (PBCL-36)
The zero-order correlations were statistically significant at the <.05 level on 22 of the associations with drinking. And for the partial correlations, 14 of the associations were significant at the <.05 level. Both correlation approaches had some significant associations with variables covering non-verbal ability, Digit Span Score, behavior, inattention, head circumference, and total dysmorphology score. Only verbal ability fails to be significant this level (<.05).
With a Bonferroni adjustment to mitigate Type I error for multiple analyses, all the maternal drinking variables by quantity were significantly associated with head circumference and total dysmorphology score (p<.001) in pregnancy overall and in each trimester for both zero-order and partial correlations.
The correlation coefficients and variance explained by the effect of alcohol alone and the combined effect of alcohol and impoverished social conditions in this community sample were estimated with stepwise multiple regression (presented in Appendix Table A.6). Non-Verbal abilities of the children were significantly and negatively associated with DDD in the first and second trimesters (R=−.269, R2=.073, p<.001). Alcohol alone explained 7.3% of the variance in ability. Then when the effect of maternal education and household income were added, the overall association was stronger (R=.373, R2=.139, p<.001), and DDD in first and second trimesters and low maternal education and low household income explained 13.9% of the variance in non-verbal scores. Similarly, drinking in the first two trimesters also produced a significant association with inattention problems in the children (R=.228, R2=.052, p=.001), explaining 5.2% of the variance in inattention. The combined effect of drinking, maternal education and household income was significant with higher correlation coefficients (R=.316, R2=.100, p<.001) and explaining 10% of the variance in inattention. The head circumference (OFC) of the children was correlated significantly with drinking (R=−.305, R2=.093, p<.001) explaining 9.3% of the variance in head size. Drinking and socio-environmental variables combined produced a stronger association (R=.387, R2=.150, p<.001) which explained 15% of the variance. Finally, the association of the total dysmorphology score with drinking in the first two trimesters alone was more robust than other associations with drinking alone (R=.385, R2=14.8, p<.001), explaining 14.8% of the variance. When drinking indicators were combined with the two socio-environmental indicators, this was the strongest relationship examined (R=.487, R2=.237, p<.001), explaining 23.7% of the variance in dysmorphology scores in this community.
3.10. Logistic Regression: Usual Drinks per Drinking Day in the First Trimester
In Table 7, binary logistic regression, adjusting for smoking, predicts the odds of an FASD diagnosis by the usual DDD in the first trimester. The comparison is between mothers who reported drinking during pregnancy and mothers who reported no drinking. Mothers who report drinking three or more DDD in the first trimester had 9.4 times greater odds (p<.002, 95%CI=1.91–33.61) of having a child with a diagnosis of FASD. Mothers who drank two (OR=13.01), four (OR=8.02) and five or more (OR=6.95) DDD in the first trimester also had significantly high odds of having a child diagnosed with FASD. The greater odds ratio at two DDD over the other DDD categories are likely due to maternal under-reporting of actual quantity of alcohol consumed.
Table 7.
Binary Logistic Regression (Controlling for Tobacco Use During Pregnancy) Predicting Odds of a FASD Diagnosis by Usual Drinks per Drinking Day in 1st Trimester: A Sixth South African Sample
| Lower | Upper | |||||
|---|---|---|---|---|---|---|
| -- | -- | 51.548 | <.001 | 1.0 | -- | -- |
| .612 | .965 | .402 | .526 | 1.844 | .278 | 12.222 |
| 2.566 | 1.187 | 4.669 | .031 | 13.010 | 1.269 | 133.358 |
| 2.240 | .721 | 9.662 | .002 | 9.397 | 1.912 | 33.608 |
| 2.081 | .731 | 8.099 | .004 | 8.015 | 1.165 | 41.508 |
| 1.939 | .912 | 4.525 | .033 | 6.953 | 6.077 | 25.777 |
| .726 | .347 | 4.392 | .036 | 2.067 | 1.048 | 4.077 |
| −1.467 | .277 | 28.073 | <.001 | .231 |
Yes/No
Table 8 presents regression results, controlling for smoking, for alcohol use by trimester. Children born to mothers drinking only in 1st trimester had an odds ratio 6.1 times greater for an FASD diagnosis than those born to non-drinkers (p<.001, 95%CI=2.98–12.55). Those born to mothers drinking only in first and second trimesters had odds of an FASD diagnosis 17.3 times that of non-drinkers (p<.001, 95%CI=6.59–45.26). Those mothers drinking in all three trimesters had a likelihood of a child with FASD that was 19.4 times that of a non-drinker (p<.001, 95%CI=8.21–46.02).
Table 8.
Binary Logistic Regression (Controlling for Tobacco Use During Pregnancy) Predicting Odds of a FASD Diagnosis by Trimester of Drinking: A Sixth South African Sample
| Odds | 95% C.I. for EXP(B) | |||||
|---|---|---|---|---|---|---|
| -- | -- | 60.816 | <.001 | 1.0 | -- | -- |
| 1.812 | .366 | 24.450 | <.001 | 6.121 | 2.985 | 12.550 |
| 2.849 | .492 | 33.562 | <.001 | 17.265 | 6.586 | 45.259 |
| 2.967 | .440 | 45.504 | <.001 | 19.433 | 8.207 | 46.019 |
| .657 | .306 | 4.600 | .032 | 1.929 | 1.058 | 3.517 |
| −1.542 | .279 | 30.514 | <.001 | .214 | ||
Yes/No
4. Discussion
4.1. Diagnostic Considerations
In this sixth cross-sectional, first grade cohort sample of FASD prevalence studies in this WCP community, the Revised IOM Diagnostic Criteria for physical traits, basic neurobehavioral testing, maternal risk factor assessment, and multidisciplinary case conference methodologies worked well. They produced quite a complete description of the prevalence of FASD, the relative frequency of occurrences of child physical traits, and a profile of selected neurobehaviors across the diagnostic spectrum of FASD. This study also provided information regarding the relationship of drinking and other maternal risk factors to these child traits and the diagnoses of FASD. The criteria, methodology, and techniques for diagnosing the full spectrum of FASD has improved substantially over the past two decades, especially so with the challenging categories of PFAS and ARND. While the rate of full-blown FAS appears to have stabilized, or possibly to have decreased, in recent years in this community, the prevalence of PFAS and ARND has risen, in part due to the increasing clarity and sophistication of diagnostic criteria of the more subtle alcohol-related traits in the children with these diagnoses (del Campo and Jones, 2017; Jones et al., 2010). This is particularly important given that there is an absence of major dysmorphology, many fewer minor anomalies, and growth deficits with which to characterize PFAS and ARND in most populations. Dysmorphology and physical growth have been, and remain, critical cornerstones of diagnostic criteria for FAS and PFAS. Gaining a better understanding of co-occurring minor anomalies that are often associated with prenatal alcohol exposure, adds more diagnostic tools to the traditional cardinal features of FASD and the general growth deficits associated with FAS (Abell et al., 2016; Coles et al., 2020; Gomez et al., 2020; Sawada Feldman et al., 2012). Furthermore, the recognition of additional dysmorphic traits sometimes associated with prenatal alcohol exposure has brought more attention to, and discovery of, the most common FASD-linked behavioral problems and anomalies which is leading to a new appreciation of the substantial variation in FASD phenotypes (Goh et al., 2016; Mattson et al., 2013, 2010; Ware et al., 2012). Furthermore, an expanded knowledge of proximal and distal maternal risk factors has emerged from the time our team members began to work in this community.
Evidence of this improved diagnostic understanding is demonstrated in the finding that children with ARND had significantly higher dysmorphology scores than typically developing controls. Furthermore, each of the five neurobehavioral tests contributed significantly to the diagnosing of children on the spectrum of FASD. This is especially so with the children with ARND. The TROG, which measures the reception of grammar, was the least statistically discriminating among the assessment tools used, but overall was still discriminating among the diagnostic groups.
4.2. Maternal Risk Trends
For proximal maternal risk, this community population (and others in the WCP) remains virtually exclusive in the use of alcohol and tobacco over other drugs (Fletcher et al., 2018; Watt et al., 2017). Less than 3% of the women in this population, even among mothers of children with FASD, reported use of drugs other than tobacco and alcohol. Tobacco use remains the only significant drug other than alcohol used by mothers in this community. Mothers of children with FASD smoked significantly more (66% vs. 35%) than controls.
The lowest quantity of alcohol consumed in the first trimester that significantly increased the odds of an FASD diagnosis (OR=13.0) was two DDD when controlling for tobacco use. But there is some evidence to suspect under-reporting of the actual quantity of alcohol consumed by those who reported two DDD, for the odds ratios drop when the reported levels increase to three, four, and five or more. Nevertheless, since tobacco use and alcohol use were both common among mothers of children with FASD we might still conclude that heavy smoking and heavy drinking combined to produce this level of risk for the fetus in this particular population.
The modal frequency of drinking that produced a significantly high probability of a child with an FASD diagnosis was two drinking days per week in the first trimester. Those women who drink alcohol in all three trimesters increase the odds of an FASD diagnosis over non-drinkers by 19.4 times (p<.001, 95%CI=8.21–46.01). Therefore, the gestational timing of drinking is critical for producing an association with an FASD diagnosis. In the first trimester, the odds of an FASD diagnosis were increased six times over abstainers but Adrinking heavily in the second and third trimesters increased the odds of an FASD diagnosis by 17 to 19 times.
Distal maternal risk variables have remained somewhat similar in this community over the years. Lower values of maternal height, weight and BMI were first identified in this community as placing children at higher risk for FASD (May et al., 2015, 2008; Viljoen et al., 2005). They were again significant in this cohort. Furthermore, higher gravidity and parity and lower socioeconomic status as measured by lower education and household income, remain substantial risk factors (Abel, 1995; Abel and Hannigan, 1995). Finally, later recognition of pregnancy, as we have also documented in the United States, is significantly more typical of mothers of FASD (Chambers et al., 2019a; May et al., 2020a, 2020b, 2020c).
The correlation analyses that utilized both zero-order and partial correlations provided some comparison of the combined effect of overall social conditions and drinking during pregnancy versus that of alcohol only. The partial correlations, controlling for socio-environmental variables, were more targeted to the teratogenic influence of alcohol alone. The relationship of drinking quantity by trimester with neurobehavioral variables, head circumference and total dysmorphology, illustrated the stronger associations between the socio-environmental conditions and alcohol combined on the child traits of FASD than with prenatal alcohol use alone. Furthermore, the stepwise multiple regression also demonstrated that more robust correlations were obtained, and more variance in the child traits was explained, when both quantity of alcohol use per drinking day and socio-environmental variables were considered in the analysis. In other words, the challenging conditions of poverty, stress, and less than optimal nutrition (May et al., 2016b, 2014) faced by many mothers and families in this community combine with the teratogenicity of alcohol for a stronger association with negative outcomes on the common traits of children with FASD.
4.3. Prevalence
The prevalence of FAS remains high in this community, and with the improved diagnostic capability to diagnose PFAS, may appear to be less prevalent. However, the diagnoses of PFAS and ARND appear to be more prevalent and may have plateaued at a high level. As stated before, these trends are partially explained by an improvement in diagnostic rigor and improved criteria and understanding of these subtle phenotypes by the clinical disciplines. The current rates may also may be attributed to an increased availability, access to, and greater use of, more alcoholic beverages, and a greater variety thereof, in the community and surrounding rural areas (SA Wine Industry 2019 Statistics NR 44, n.d.; Spotong, 2019).
4.4. Strengths and Limitations
This study has several strengths. First, the study was population-based; therefore, the findings are representative of this entire community and first grade children therein. Second, because the children were six to seven years old, they were old enough for assessment of meaningful dysmorphology, physical growth, and meaningful neurobehavioral characteristics. Third, the population of children was virtually exclusively alcohol-exposed except for tobacco exposure. Therefore, alcohol was likely the prime teratogenic agent affecting the major negative outcomes in the children with FASD. The findings were not substantially biased by co-morbid exposures to marijuana, opioids, cocaine, or other drugs, and the regression analyses was designed to control for the effect of co-morbid tobacco use. But some of the analysis indicated that social and environmental factors exert a meaningful negative effect as well. Further research on these other effects is warranted. Fourth, the access to, and inclusion of, many randomly-selected, typically-developing controls ensured an adequate comparison group of children who had been exposed to the same environmental and cultural conditions as the affected children. This also allows for a conservative, but likely accurate, weighted estimation of true prevalence of cases, child traits, and maternal risk factors specific to this community. Fifth, the accumulated experience of the local and American clinical and epidemiological investigative team, spans 20 years and provides a robust set of experiences for diagnosing and understanding FASD in this population.
There were also limitations to this study. First, the reports of drinking are seven years retrospective and may be influenced by poor recall and misrepresentation. But, as we have demonstrated previously with a biomarker study in a sample of pregnant WCP women (May et al., 2016a), this population reports with a candor and accuracy when interviewed by experienced interviewers using sophisticated research protocols in a comfortable setting. Under these conditions the accuracy of self-reported alcohol use mirrors the findings of two alcohol use biomarkers used in combination. Second, this was not a longitudinal study. It was a descriptive, cross-sectional, period prevalence study of a first-grade cohort. This approach and the analysis presented here was not geared to an extended consideration of etiology beyond specific associations which link diagnostic outcomes to the primary teratogen. Longitudinal study methods are better suited to assess multivariate influences on, or contributions to, the severity of FASD traits in children. Third, a longitudinal study initiated in the prenatal period might be more desirable for robust empirical documentation of prenatal exposure during pregnancy and assessment of child development and outcomes over time (Kalberg et al., 2019). Our team initiated such studies a decade ago, and there is little variance in the findings of the children at five years of age, and also in the maternal risk traits identified, in longitudinal studies when compared to those in these cross-sectional studies (Kalberg et al., 2019). Carrying out longitudinal studies on children with FASD into adulthood has rarely been done (Spohr, 2018). But such an approach is vital for a more complete understanding of FASD and developmental traits and trajectory across the lifespan.
Supplementary Material
Highlights.
The rate of total FASD in this community was high in 2014, 16–30%
The rate of fetal alcohol syndrome was 4.3–6.6%, similar to that in 1999
As few as 2 drinks per drinking day was significantly associated with FASD diagnoses
Two days per week was the modal drinking frequency reported for FASD diagnoses
Drinking in all trimesters increased the odds of FASD to 19 times that of abstinence
Acknowledgements
The authors thank the South African, Western Cape Province, Department of Education administrators and teachers who approved and facilitated the study, the parents who consented to have their children participate in the study, all children who participated in the study, and each of the mothers who provided information for the maternal risk portion of this study. We are especially indebted to the stellar fieldwork staff for this study: Belinda Joubert, Marise Cloete, Natalie Hendricks, Corne Spies, Cecile Kriel, Sumien Roux, Isobel Botha, Theresa Alexander, and Fredeline Philander whose skill in locating, transporting, interviewing, and accommodating subjects was invaluable. Lise Anthonissen and Tanya van de Water completed the psychological testing with efficiency, style, and accuracy.
Role of the funding source
This work was supported by the National Institutes of Health, National Institute on Alcohol Abuse and Alcoholism (NIAAA) [UO1 AA15134].
Footnotes
Publisher's Disclaimer: This is a PDF file of an unedited manuscript that has been accepted for publication. As a service to our customers we are providing this early version of the manuscript. The manuscript will undergo copyediting, typesetting, and review of the resulting proof before it is published in its final form. Please note that during the production process errors may be discovered which could affect the content, and all legal disclaimers that apply to the journal pertain.
Conflict of interest
None of the authors have any conflicts of interest to declare.
References
- Abel EL, 1995. An update on incidence of FAS: FAS is not an equal opportunity birth defect. Neurotoxicol. Teratol 17, 437–443. 10.1016/0892-0362(95)00005-C [DOI] [PubMed] [Google Scholar]
- Abel EL, Hannigan JH, 1995. Maternal risk factors in fetal alcohol syndrome: Provocative and permissive influences. Neurotoxicol. Teratol 17, 445–462. 10.1016/0892-0362(95)98055-6 [DOI] [PubMed] [Google Scholar]
- Abell K, May W, May PA, Kalberg W, Hoyme HE, Robinson LK, Manning M, Jones KL, Abdul-Rahman O, 2016. Fetal alcohol spectrum disorders and assessment of maxillary and mandibular arc measurements. Am. J. Med. Genet Part A 170, 1763–1771. 10.1002/ajmg.a.37656 [DOI] [PubMed] [Google Scholar]
- Achenbach T, Rescorla L, 2001. Manual For The ASEBA School-Age Forms And Profiles. University of Vermont, Research Center for Children, Youth, and Families, Burlington, VT. [Google Scholar]
- Bishop DVM, 1989. Test for Reception of Grammar Age and Cognitive Performance Research Centre. University of Manchester, Manchester. [Google Scholar]
- Census 2011. [WWW Document], n.d. URL http://census2011.adrianfrith.com/place/166005 (accessed 7.24.20).
- Chambers CD, Coles C, Kable J, Akshoomoff N, Xu R, Zellner JA, Honerkamp-Smith G, Manning MA, Adam MP, Jones KL, 2019a. Fetal Alcohol Spectrum Disorders in a Pacific Southwest City: Maternal and Child Characteristics. Alcohol. Clin. Exp. Res 43, 2578–2590. 10.1111/acer.14213 [DOI] [PMC free article] [PubMed] [Google Scholar]
- Chambers CD, Coles C, Kable J, Akshoomoff N, Xu R, Zellner JA, Honerkamp-Smith G, Manning MA, Adam MP, Jones KL, 2019b. Fetal Alcohol Spectrum Disorders in a Pacific Southwest City: Maternal and Child Characteristics. Alcohol. Clin. Exp. Res. acer 14213 10.1111/acer.14213 [DOI] [PMC free article] [PubMed] [Google Scholar]
- Chasnoff IJ, Wells AM, King L, 2015. Misdiagnosis and missed diagnoses in foster and adopted children with prenatal alcohol exposure. Pediatrics 135, 264–70. 10.1542/peds.2014-2171 [DOI] [PubMed] [Google Scholar]
- Coles CD, Kalberg W, Kable JA, Tabachnick B, May PA, Chambers CD, 2020. Characterizing Alcohol- Related Neurodevelopmental Disorder: Prenatal Alcohol Exposure and the Spectrum of Outcomes. Alcohol. Clin. Exp. Res 44, 1245–1260. 10.1111/acer.14325 [DOI] [PMC free article] [PubMed] [Google Scholar]
- Czarnecki DM, Russell M, Cooper ML, Salter D, 1990. Five-year reliability of self-reported alcohol consumption. J. Stud. Alcohol 51, 68–76. [DOI] [PubMed] [Google Scholar]
- del Campo M, Jones KL, 2017. A review of the physical features of the fetal alcohol spectrum disorders. Eur. J. Med. Genet 60, 55–64. 10.1016/j.ejmg.2016.10.004 [DOI] [PubMed] [Google Scholar]
- Fletcher OV, May PA, Seedat S, Sikkema KJ, Watt MH, 2018. Attitudes toward alcohol use during pregnancy among women recruited from alcohol-serving venues in Cape Town, South Africa: A mixed-methods study. Soc. Sci. Med 215, 98–106. 10.1016/j.socscimed.2018.09.008 [DOI] [PubMed] [Google Scholar]
- Goh PK, Doyle LR, Glass L, Jones KL, Riley EP, Coles CD, Hoyme HE, Kable JA, May PA, Kalberg WO, Sowell ER, Wozniak JR, Mattson SN, 2016. A Decision Tree to Identify Children Affected by Prenatal Alcohol Exposure. J. Pediatr 177, 121–127.e1. 10.1016/j.jpeds.2016.06.047 [DOI] [PMC free article] [PubMed] [Google Scholar]
- Gomez DA, May PA, Tabachnick BG, Hasken JM, Lyden ER, Kalberg WO, Hoyme HE, Manning MA, Adam MP, Robinson LK, Jones KL, Buckley D, Abdul-Rahman OA, 2020. Ocular measurements in fetal alcohol spectrum disorders. Am. J. Med. Genet Part A ajmg.a.61759. 10.1002/ajmg.a.61759 [DOI] [PubMed] [Google Scholar]
- Hannigan JH, Chiodo LM, Sokol RJ, Janisse J, Ager JW, Greenwald MK, Delaney-Black V, 2010. A 14-year retrospective maternal report of alcohol consumption in pregnancy predicts pregnancy and teen outcomes. Alcohol 44, 583–594. 10.1016/j.alcohol.2009.03.003 [DOI] [PMC free article] [PubMed] [Google Scholar]
- Hoyme H, May P, Kalberg W, Kodituwakku P, Gossage J, Trujillo P, Buckley D, Miller J, Aragon A, Khaole N, Viljoen D, Jones K, Robinson L, 2005. A practical clinical approach to diagnosis of fetal alcohol spectrum disorders: clarification of the 1996 Institute of Medicine criteria. Pediatrics 115, 39–47. 10.1542/peds.2004-0259 [DOI] [PMC free article] [PubMed] [Google Scholar]
- Hoyme HE, Hoyme DB, Elliott AJ, Blankenship J, Kalberg WO, Buckley D, Abdul-Rahman O, Adam MP, Robinson LK, Manning M, Bezuidenhout H, Jones KL, May PA, 2015. A South African mixed race lip/philtrum guide for diagnosis of fetal alcohol spectrum disorders. Am. J. Med. Genet. A 167A, 752–755. 10.1002/ajmg.a.37023 [DOI] [PMC free article] [PubMed] [Google Scholar]
- Hoyme HE, Kalberg WO, Elliott AJ, Blankenship J, Buckley D, Marais A-S, Manning MA, Robinson LK, Adam MP, Abdul-Rahman O, Jewett T, Coles CD, Chambers C, Jones KL, Adnams CM, Shah PE, Riley EP, Charness ME, Warren KR, May PA, 2016. Updated Clinical Guidelines for Diagnosing Fetal Alcohol Spectrum Disorders. Pediatrics 138 10.1542/peds.2015-4256IBM,2017. [DOI] [PMC free article] [PubMed] [Google Scholar]
- IBM SPSS Statistics for Windows.
- Jacobson SW, Chiodo LM, Sokol RJ, Jacobson JL, 2002. Validity of maternal report of prenatal alcohol, cocaine, and smoking in relation to neurobehavioral outcome. Pediatrics 109, 815–825. [DOI] [PubMed] [Google Scholar]
- Jacobson SW, Stanton ME, Molteno CD, Burden MJ, Fuller DS, Hoyme HE, Robinson LK, Khaole N, Jacobson JL, 2008. Impaired eyeblink conditioning in children with fetal alcohol syndrome. Alcohol. Clin. Exp. Res 32, 365–372. 10.1111/j.1530-0277.2007.00585.x [DOI] [PubMed] [Google Scholar]
- Jones KL, Hoyme HE, Robinson LK, Del Campo M, Manning MA, Prewitt LM, Chambers CD, 2010. Fetal alcohol spectrum disorders: Extending the range of structural defects. Am. J. Med. Genet Part A 152, 2731–2735. 10.1002/ajmg.a.33675 [DOI] [PMC free article] [PubMed] [Google Scholar]
- Jones KL, Smith DW, 1973. Recognition of the fetal alcohol syndrome in early infancy. Lancet (London, England) 302, 999–1001. [DOI] [PubMed] [Google Scholar]
- Kalberg WO, May PA, Buckley D, Hasken JM, 2019. Early-Life Predictors of Fetal Alcohol Spectrum Disorders. Pediatrics 144. [DOI] [PMC free article] [PubMed] [Google Scholar]
- King AC, 1994. Enhancing the self-report of alcohol consumption in the community: two questionnaire formats. Am. J. Public Health 84, 294–296. [DOI] [PMC free article] [PubMed] [Google Scholar]
- Lange S, Rehm J, Popova S, 2018. Implications of Higher Than Expected Prevalence of Fetal Alcohol Spectrum Disorders. JAMA. 10.1001/jama.2017.21895 [DOI] [PubMed] [Google Scholar]
- Mattson SN, Foroud T, Sowell ER, Jones KL, Coles CD, Fagerlund A, Autti-Ramo I, May PA, Adnams CM, Konovalova V, Wetherill L, Arenson AD, Barnett WK, Riley EP, 2010. Collaborative initiative on fetal alcohol spectrum disorders: methodology of clinical projects. Alcohol 44, 635–641. 10.1016/j.alcohol.2009.08.005 [DOI] [PMC free article] [PubMed] [Google Scholar]
- Mattson SN, Roesch SC, Glass L, Deweese BN, Coles CD, Kable JA, May PA, Kalberg WO, Sowell ER, Adnams CM, Jones KL, Riley EP, 2013. Further Development of a Neurobehavioral Profile of Fetal Alcohol Spectrum Disorders. Alcohol. Clin. Exp. Res 37, 517–528. 10.1111/j.1530-0277.2012.01952.x [DOI] [PMC free article] [PubMed] [Google Scholar]
- May P, De Vries M, Marais A-S, Kalberg W, Buckley D, Adnams C, Hasken J, Tabachnick B, Robinson L, Manning M, Bezuidenhout H, Adam M, Jones K, Seedat S, Parry C, Hoyme H, 2017. Replication of High Fetal Alcohol Spectrum Disorders Prevalence Rates, Child Characteristics, and Maternal Risk Factors in a Second Sample of Rural Communities in South Africa. Int. J. Environ. Res. Public Health 14, 522 10.3390/ijerph14050522 [DOI] [PMC free article] [PubMed] [Google Scholar]
- May PA, Blankenship J, Marais A-S, Gossage JP, Kalberg WO, Barnard R, De Vries M, Robinson LK, Adnams CM, Buckley D, Manning M, Jones KL, Parry C, Hoyme HE, Seedat S, 2013. Approaching the prevalence of the full spectrum of fetal alcohol spectrum disorders in a South African population-based study. Alcohol. Clin. Exp. Res 37, 818–830. 10.1111/acer.12033 [DOI] [PMC free article] [PubMed] [Google Scholar]
- May PA, Brooke L, Gossage JP, Croxford J, Adnams C, Jones KL, Robinson L, Viljoen D, 2000. Epidemiology of fetal alcohol syndrome in a South African community in the Western Cape Province. Am. J. Public Health 90, 1905–1912. [DOI] [PMC free article] [PubMed] [Google Scholar]
- May PA, Chambers CD, Kalberg WO, Zellner J, Feldman H, Buckley D, Kopald D, Hasken JM, Xu R, Honerkamp-Smith G, Taras H, Manning MA, Robinson LK, Adam MP, Abdul-Rahman O, Vaux K, Jewett T, Elliott AJ, Kable JA, Akshoomoff N, Daniel F, Arroyo JA, Hereld D, Riley EP, Charness ME, Coles CD, Warren KR, Jones KL, Hoyme HE, 2018a. Prevalence of fetal alcohol spectrum disorders in 4 US communities. JAMA - J. Am. Med. Assoc 319, 474–482. 10.1001/jama.2017.21896 [DOI] [PMC free article] [PubMed] [Google Scholar]
- May PA, de Vries MM, Marais AS, Kalberg WO, Adnams CM, Hasken JM, Tabachnick B, Robinson LK, Manning MA, Jones KL, Hoyme D, Seedat S, Parry CDH, Hoyme HE, 2016a. The continuum of fetal alcohol spectrum disorders in four rural communities in south africa: Prevalence and characteristics. Drug Alcohol Depend. 159, 207–218. 10.1016/j.drugalcdep.2015.12.023 [DOI] [PMC free article] [PubMed] [Google Scholar]
- May PA, Fiorentino D, Coriale G, Kalberg WO, Hoyme HE, Aragon AS, Buckley D, Stellavato C, Gossage JP, Robinson LK, Jones KL, Manning M, Ceccanti M, 2011. Prevalence of children with severe fetal alcohol spectrum disorders in communities near Rome, Italy: new estimated rates are higher than previous estimates. Int. J. Environ. Res. Public Health 8, 2331–2351. 10.3390/ijerph8062331 [DOI] [PMC free article] [PubMed] [Google Scholar]
- May PA, Fiorentino D, Phillip Gossage J, Kalberg WO, Eugene Hoyme H, Robinson LK, Coriale G, Jones KL, del Campo M, Tarani L, Romeo M, Kodituwakku PW, Deiana L, Buckley D, Ceccanti M, 2006. Epidemiology of FASD in a province in Italy: Prevalence and characteristics of children in a random sample of schools. Alcohol. Clin. Exp. Res 30, 1562–1575. 10.1111/j.1530-0277.2006.00188.x [DOI] [PubMed] [Google Scholar]
- May PA, Gossage JP, Brooke LE, Snell CL, Marais A-S, Hendricks LS, Croxford JA, Viljoen DL, 2005. Maternal risk factors for fetal alcohol syndrome in the Western cape province of South Africa: a population-based study. Am. J. Public Health 95, 1190–1199. 10.2105/AJPH.2003.037093 [DOI] [PMC free article] [PubMed] [Google Scholar]
- May PA, Gossage JP, Kalberg WO, Robinson LK, Buckley D, Manning M, Hoyme HE, 2009. Prevalence and epidemiologic characteristics of FASD from various research methods with an emphasis on recent in-school studies. Dev. Disabil. Res. Rev 15, 176–192. 10.1002/ddrr.68 [DOI] [PubMed] [Google Scholar]
- May PA, Gossage JP, Marais A-S, Adnams CM, Hoyme HE, Jones KL, Robinson LK, Khaole NCO, Snell C, Kalberg WO, Hendricks L, Brooke L, Stellavato C, Viljoen DL, 2007. The epidemiology of fetal alcohol syndrome and partial FAS in a South African community. Drug Alcohol Depend. 88, 259–271. 10.1016/j.drugalcdep.2006.11.007 [DOI] [PMC free article] [PubMed] [Google Scholar]
- May PA, Gossage JP, Marais A-S, Hendricks LS, Snell CL, Tabachnick BG, Stellavato C, Buckley DG, Brooke LE, Viljoen DL, 2008. Maternal risk factors for fetal alcohol syndrome and partial fetal alcohol syndrome in South Africa: a third study. Alcohol. Clin. Exp. Res 32, 738–753. 10.1111/j.1530-0277.2008.00634.x [DOI] [PubMed] [Google Scholar]
- May PA, Hamrick KJ, Corbin KD, Hasken JM, Marais AS, Blankenship J, Hoyme HE, Gossage JP, 2016b. Maternal nutritional status as a contributing factor for the risk of fetal alcohol spectrum disorders. Reprod. Toxicol 59, 101–108. 10.1016/j.reprotox.2015.11.006 [DOI] [PMC free article] [PubMed] [Google Scholar]
- May PA, Hamrick KJ, Corbin KD, Hasken JM, Marais AS, Brooke LE, Blankenship J, Hoyme HE, Gossage JP, 2014. Dietary intake, nutrition, and fetal alcohol spectrum disorders in the Western Cape Province of South Africa. Reprod. Toxicol 46, 31–39. 10.1016/j.reprotox.2014.02.002 [DOI] [PMC free article] [PubMed] [Google Scholar]
- May PA, Hasken J, Baete A, Russo J, Elliott AJ, Kalberg WO, Buckley D, Brooks M, Ortega MA, Hedrick DM, Tabachnick BG, Abdul-Rahman O, Adam MP, Jewett T, Robinson LK, Manning M, Hoyme HE, 2020a. Fetal Alcohol Spectrum Disorders in a Midwestern City: Child Characteristics, Maternal Risk Traits, and Prevalence. Alcohol. Clin. Exp. Res 44, 919–938. [DOI] [PMC free article] [PubMed] [Google Scholar]
- May PA, Hasken J, Bozeman R, Jones J-V, Burns MK, Goodover J, Kalberg WO, Buckley D, Brooks M, Ortega MA, Elliott AJ, Hedrick DM, Tabachnick B, Abdul-Rahman O, Adam MP, Jewett T, Robinson LK, Manning M, Hoyme HE, 2020b. Fetal Alcohol Spectrum Disorders in a Rocky Mountain Region City: Child Characteristics, Maternal Risk Traits, and Prevalence. Alcohol. Clin. Exp. Res 44, 900–918. [DOI] [PMC free article] [PubMed] [Google Scholar]
- May PA, Hasken J, Stegall JM, Mastro H, Kalberg WO, Buckley D, Brooks M, Hedrick DM, Ortega MA, Elliott AJ, Abdul-Rahman O, Adam MP, Robinson LK, Manning MA, Jewett T, Hoyme HE, 2020c. Fetal Alcohol Spectrum Disorders in a Southeastern County: Child Characteristics and Major Maternal Risk Traits. Alcohol. Clin. Exp. Res 44, 939–959. [DOI] [PMC free article] [PubMed] [Google Scholar]
- May PA, Hasken JM, Blankenship J, Marais AS, Joubert B, Cloete M, de Vries MM, Barnard R, Botha I, Roux S, Doms C, Gossage JP, Kalberg WO, Buckley D, Robinson LK, Adnams CM, Manning MA, Parry CDH, Hoyme HE, Tabachnick B, Seedat S, 2016c. Breastfeeding and maternal alcohol use: Prevalence and effects on child outcomes and fetal alcohol spectrum disorders. Reprod. Toxicol 63, 13–21. 10.1016/j.reprotox.2016.05.002 [DOI] [PMC free article] [PubMed] [Google Scholar]
- May PA, Hasken JM, De Vries MM, Marais AS, Stegall JM, Marsden D, Parry CDH, Seedat S, Tabachnick B, 2018b. A utilitarian comparison of two alcohol use biomarkers with self-reported drinking history collected in antenatal clinics. Reprod. Toxicol 77, 25–32. 10.1016/j.reprotox.2018.02.002 [DOI] [PMC free article] [PubMed] [Google Scholar]
- May PA, Keaster C, Bozeman R, Goodover J, Blankenship J, Kalberg WO, Buckley D, Brooks M, Hasken J, Gossage JP, Robinson LK, Manning M, Hoyme HE, 2015. Prevalence and characteristics of fetal alcohol syndrome and partial fetal alcohol syndrome in a Rocky Mountain Region City. Drug Alcohol Depend. 155, 118–127. 10.1016/j.drugalcdep.2015.08.006 [DOI] [PMC free article] [PubMed] [Google Scholar]
- May PA, Marais AS, de Vries MM, Kalberg WO, Buckley D, Hasken JM, Adnams CM, Barnard R, Joubert B, Cloete M, Tabachnick B, Robinson LK, Manning MA, Jones KL, Bezuidenhout H, Seedat S, Parry CDH, Hoyme HE, 2016d. The continuum of fetal alcohol spectrum disorders in a community in South Africa: Prevalence and characteristics in a fifth sample. Drug Alcohol Depend. 168, 274–286. 10.1016/j.drugalcdep.2016.09.025 [DOI] [PMC free article] [PubMed] [Google Scholar]
- Microsoft Excel, 2016.
- Okulicz-Kozaryn K, Borkowska M, Brzozka K, 2017. FASD Prevalence among Schoolchildren in Poland. J. Appl. Res. Intellect. Disabil 30, 61–70. 10.1111/jar.12219 [DOI] [PubMed] [Google Scholar]
- Petkovic G, Barisic I, 2013. Prevalence of fetal alcohol syndrome and maternal characteristics in a sample of schoolchildren from a rural province of Croatia. Int. J. Environ. Res. Public Health 10, 1547–1561. 10.3390/ijerph10041547 [DOI] [PMC free article] [PubMed] [Google Scholar]
- Petkovic G, Barisic I, 2010. FAS prevalence in a sample of urban schoolchildren in Croatia. Reprod. Toxicol 29, 237–241. 10.1016/j.reprotox.2009.11.006 [DOI] [PubMed] [Google Scholar]
- Popova S, Lange S, Poznyak V, Chudley AE, Shield KD, Reynolds JN, Murray M, Rehm J, 2019. Population-based prevalence of fetal alcohol spectrum disorder in Canada. BMC Public Health 19, 845 10.1186/s12889-019-7213-3 [DOI] [PMC free article] [PubMed] [Google Scholar]
- Raven J, 1981. Manual for Raven’s Progressive Matrices and Vocabulary Scales Research Supplement No. 1: the 1979 British Standardisation Of The Standard Progressive Matrices and Mill Hill Vocabulary Scales, Together With Comparative Data From Earlier Studies In the UK. Harcourt Assessment, San Antonio, TX. [Google Scholar]
- SA Wine Industry 2019. Statistics NR 44, n.d. [Google Scholar]
- Sawada Feldman H, Lyons Jones K, Lindsay S, Slymen D, Klonoff-Cohen H, Kao K, Rao S, Chambers C, 2012. Prenatal Alcohol Exposure Patterns and Alcohol-Related Birth Defects and Growth Deficiencies: A Prospective Study. Alcohol. Clin. Exp. Res 36, 670–676. 10.1111/j.1530-0277.2011.01664.x [DOI] [PubMed] [Google Scholar]
- Sobell LC, Agrawal S, Annis H, Ayala-Velazquez H, Echeverria L, Leo GI, Rybakowski JK, Sandahl C, Saunders B, Thomas S, Zioikowski M, 2001. Cross-cultural evaluation of two drinking assessment instruments: alcohol timeline followback and inventory of drinking situations. Subst. Use Misuse 36, 313–331. [DOI] [PubMed] [Google Scholar]
- Sobell LC, Sobell MB, Riley DM, Schuller R, Pavan DS, Cancilla A, Klajner F, Leo GI, 1988. The reliability of alcohol abusers’ self-reports of drinking and life events that occurred in the distant past. J. Stud. Alcohol 49, 225–232. [DOI] [PubMed] [Google Scholar]
- Spohr H-L, 2018. Fetal Alcohol Syndrome: A Lifelong Challenge. De Gruyter. [Google Scholar]
- Spotong, 2019. Trends in the South African liquor industry: Innovation and premiumisation keeps consumers coming back [WWW Document]. URL https://www.spotongmag.co.za/articles/trends-in-the-south-african-liquor-industry-9843.html (accessed 8.3.20).
- Stratton K, Howe C, Battaglia F, 1996. Fetal Alcohol Syndrome: Diagnosis, Epidemiology, Prevention, and Treatment. Washington DC. [Google Scholar]
- Streissguth AP, O’Malley K, 2000. Neuropsychiatric implications and long-term consequences of fetal alcohol spectrum disorders. Semin. Clin. Neuropsychiatry 5, ascnp0050177. 10.1053/scnp.2000.6729 [DOI] [PubMed] [Google Scholar]
- Tabachnick, Barbara G; Fidell LS, 2019. Using Mulivariate Statistics, 7th ed Pearson. [Google Scholar]
- Viljoen D, Croxford J, Gossage JP, Kodituwakku PW, May PA, 2002. Characteristics of mothers of children with fetal alcohol syndrome in the Western Cape Province of South Africa: a case control study. J. Stud. Alcohol 63, 6–17. [PubMed] [Google Scholar]
- Viljoen DL, Gossage JP, Brooke L, Adnams CM, Jones KL, Robinson LK, Hoyme HE, Snell C, Khaole NCO, Kodituwakku P, Asante KO, Findlay R, Quinton B, Marais A-S, Kalberg WO, May PA, 2005. Fetal alcohol syndrome epidemiology in a South African community: a second study of a very high prevalence area. J. Stud. Alcohol 66, 593–604. [DOI] [PMC free article] [PubMed] [Google Scholar]
- Ware AL, Crocker N, O’Brien JW, Deweese BN, Roesch SC, Coles CD, Kable JA, May PA, Kalberg WO, Sowell ER, Jones KL, Riley EP, Mattson SN, CIFASD, 2012. Executive Function Predicts Adaptive Behavior in Children with Histories of Heavy Prenatal Alcohol Exposure and Attention-Deficit/Hyperactivity Disorder. Alcohol. Clin. Exp. Res 36, 1431–1441. 10.1111/j.1530-0277.2011.01718.x [DOI] [PMC free article] [PubMed] [Google Scholar]
- Warren K, Floyd L, Calhoun F, 2004. Consensus Statement on FASD. National Organization on Fetal Alcohol Syndrome, Washington, DC. [Google Scholar]
- Watt MH, Knettel BA, Choi KW, Knippler ET, May PA, Seedat S, 2017. Risk for Alcohol-Exposed Pregnancies Among Women at Drinking Venues in Cape Town, South Africa. J. Stud. Alcohol Drugs 78, 795–800. 10.15288/jsad.2017.78.795 [DOI] [PMC free article] [PubMed] [Google Scholar]
- Wechsler D, 2003. Wechsler Intelligence Scale for Children, Fourth. ed. Psychological Corporation, San Antonio, TX. [Google Scholar]
- What Is A Standard Drink? | National Institute on Alcohol Abuse and Alcoholism (NIAAA) [WWW Document], n.d. URL https://www.niaaa.nih.gov/what-standard-drink (accessed 11.18.19).
Associated Data
This section collects any data citations, data availability statements, or supplementary materials included in this article.