

Abstract
Background
Clinical severity of hemophilia A (HA) varies, possibly due to interplay of many factors in the hemostatic pathway. Pharmacokinetic monitoring of factor VIII (FVIII) replacement therapy in HA patients consists of measuring FVIII activity levels and subsequent dose adjustment. The Nijmegen Hemostasis Assay (NHA) measures thrombin generation (TG) and plasmin generation (PG).
Objective
To determine differences in TG and PG between HA patients before and during a pharmacokinetic study and identify best parameters to develop a pharmacodynamic model.
Methods
Twenty‐five HA patients (baseline FVIII < 1‐9 IU/dL) underwent a pharmacokinetic study with a single dose of 25‐50 IU/kg standard half‐life FVIII concentrate. At baseline and after administration of FVIII TG and PG parameters were measured with the NHA.
Results
FVIII activity level increased from median 1.0 IU/dL (interquartile range < 1.0‐6.0) to 71 IU/dL (62‐82) 15 minutes after administration and decreased to 15 IU/dL (10‐26) at 24 hours. TG was enhanced simultaneously, with thrombin peak height (TPH) increasing from 22nM (15‐35) to 222nM (159‐255), and thrombin potential (TP) from 404nM/min (undetectable‐876) to 1834nM/min (1546‐2353). Twenty‐four hours after infusion, TG parameters remained high (TPH 73nM [58.5‐126.3]; TP 1394nM/min [1066‐1677]) compared to FVIII activity level. PG showed hyperfibrinolysis in severe HA patients compared to mild patients and controls, which normalized after FVIII supplementation.
Conclusion
HA patients showed clear differences in baseline TG and PG despite having comparable FVIII activity levels. These results reveal a discrepancy between FVIII activity level and TG, in which the latter may be a better parameter to monitor individualized treatment in HA patients.
Keywords: coagulation, factor VIII, fibrinolysis, hemophilia A, pharmacokinetic
Essentials.
Clinical phenotype of hemophilia A (HA) is variable when correcting for factor (F) VIII level.
Combined thrombin and plasmin generation (TG/PG) was determined after FVIII supplementation.
Patients with HA expose an individual response in TG before and after FVIII replacement therapy.
Treatment of HA can be individualized by TG monitoring in combination with FVIII level.
1. INTRODUCTION
Hemophilia A (HA) is an X‐linked hereditary disorder resulting in coagulation factor VIII (FVIII) activity deficiency and recurrent spontaneous and trauma‐related bleeding. 1 The mainstay of treatment is replacement therapy with FVIII either as prophylaxis or on demand in case of a bleeding episode. Traditionally, a FVIII trough level for prophylactic therapy of 1 IU/dL is preferred, 2 which is determined by pharmacokinetic (PK)‐guided dosing. 3 , 4 , 5 However, some patients still experience bleeding episodes despite adequate FVIII trough levels. 6 In general, severity of bleeding phenotype is roughly correlated with measured FVIII activity level but can vary between individual patients with an equal FVIII activity level. 7 , 8 , 9 The underlying difference in bleeding phenotype and response to replacement therapy is yet to be determined, with individual variations in the hemostatic balance as a potential leading cause.
The thrombin generation assay (TGA) can be used to assess the individual hemostatic potential as it measures the hemostatic balance as a whole. 10 Previously, TGAs were used to determine differences in phenotype of HA patients, 8 , 11 , 12 and to monitor hemostasis during replacement therapy in HA patients without an inhibitor. 7 , 13 , 14 , 15 Moreover, TGAs are more frequently used to monitor hemostatic response to bypassing agents (BPAs) in HA patients with inhibitors. 16 , 17 , 18 , 19 , 20 , 21 Specifically, in patients with inhibitors receiving emicizumab and BPAs, TGA is able to determine potential synergistic effects. 22 , 23 , 24 In general, the impact of FVIII on thrombin generation (TG), the pharmacodynamic (PD) effect, may be implemented to individualize treatment using a PK‐PD model.
A small study by Lewis et al showed that overall TG parameters were closely correlated with median FVIII activity levels in severe HA patients, but with a wide inter‐patient variability of TG parameters at different time points after FVIII infusion. However, intra‐patient variability was small, resulting in a predictable relation between FVIII and TG for an individual patient. 25 This is in accordance with another study that showed a high inter‐individual heterogeneity in baseline TG parameters in hemophilia A and B patients, but after spiking plasma with the specific coagulation factor, TG showed strong correlations in individual patients. 26 The main drawback of these previous studies is the limited number of patients in whom TG was measured (12 and 10 HA patients, respectively). 25 , 26
In this study, we performed PK analysis in a cohort of severe, moderate, and mild HA patients, and combined these with measurement of TG and plasmin generation (PG) using the Nijmegen Hemostasis Assay (NHA). The NHA is developed to simultaneously measure TG and PG in a single assay by a fluorimeter, thereby incorporating the interplay between TG and PG. 27 The aim of the current study is to determine TG and PG differences between HA patients. Furthermore, the responses of TG and PG after a single FVIII bolus are evaluated to generate the most optimal TG parameter to monitor FVIII replacement therapy.
2. MATERIALS AND METHODS
2.1. Patients
Patients (children and adults, without age limit) with severe (FVIII plasma activity level <1 IU/dL), moderate (FVIII activity level 1‐5 IU/dL), and mild HA (FVIII activity level 5‐40 IU/dL) who underwent a PK study with a standard half‐life FVIII concentrate in the Radboud University Medical Center, Nijmegen, the Netherlands, were enrolled in this monocenter study between February 2003 and July 2013. This study is registered in the Dutch Trial Registry (number NL2808). Exclusion criteria were: known allergy to plasma proteins, liver cirrhosis, hepatitis C treated with interferon within 6 months before inclusion, human immunodeficiency virus infection, hemoglobin level <8.0 mmol/L, platelet count <50*109/L, difficult venous access, switch of FVIII product during the last year, and specific medications known to interact with hemostasis (non‐steroidal anti‐inflammatories, platelet aggregation inhibitors, antimicrobials, thyroid inhibitors and selective serotonin reuptake inhibitors). The Medical Ethical Committee of the Radboud University Medical Centre approved the study and all participating patients, or parents in case of underaged children, gave written informed consent. The study was conducted in accordance with the Declaration of Helsinki.
For each patient age, height, body weight, baseline FVIII activity level, and dosage of FVIII replacement therapy (plasma derived or recombinant) were collected. Before administration of the FVIII bolus, hemoglobulin level, hematocrit, von Willebrand factor ristocetin activity level, and inhibitor titers were determined. Inhibitor titer was analyzed with the Nijmegen Bethesda Assay (NBA) 28 and Nijmegen Low Titer Inhibitor Assay (NLTIA), 29 both as described before.
The amount and type of FVIII product were determined by the treating physician, pursuing a dosage of 25 to 50 IU/kg. If possible, a standard wash‐out period of 72 hours was issued. Blood samples were collected at several time points for PK and PD measurements: at baseline (before the FVIII bolus), and at 3, 5, 15, 30 minutes, and 1, 3, 6, 9, and 24 hours after the bolus. Blood samples were collected by venipuncture in 3.2% buffered sodium citrate siliconized blood collecting tubes (Becton Dickenson, Plymouth, UK).
2.2. Sample preparation
All samples were processed directly after collection. For measurement of the NHA, platelet poor plasma (PPP) was obtained. Samples were centrifuged for 15 minutes at 4°C and 4200 g. PPP samples were aliquoted into 1.5 mL long‐term freezer storage tubes with O‐ring screw caps (USA Scientific, Ocala, FL, USA), directly frozen in liquid nitrogen, and stored at −80°C until analysis. All aliquoted plasma samples were defrosted only once to measure either FVIII activity levels, or simultaneously TG and PG according to the NHA methods. All analyses were performed in the Radboud University Medical Center, Nijmegen, the Netherlands.
2.3. FVIII activity level assay
At mentioned time points, FVIII plasma activity level was determined using the FVIII one‐stage clotting assay (Cephascreen reagents and STA Evolution, both Stago Group, Asnières sur Seine, France) according to manufacturer's instructions and the FVIII chromogenic assay according to manufacturer's instruction (Biophen FVIII:C assay, HYPHEN Biomed SAS, Neuville‐sur‐Oise, France), at the STA Evolution (Stago Group). For both assays, a normal pooled plasma sample consisting of plasma of 60 healthy donors was used as reference standard. All measurements were performed in duplicate. Because one‐stage data were more complete (chromogenic FVIII activity levels were lacking for two patients as this assay was not implemented at that time), and only standard half‐life products were used, all analyses were performed using one‐stage FVIII activity levels.
2.4. Nijmegen Hemostasis Assay
The NHA is developed to evaluate hemostasis through simultaneous measurement of TG and PG. The complete description of the assay and validation procedure has been described previously. 27 Seven essential parameters were obtained with the NHA: (a) lag time to thrombin generation initiation, (b) time to thrombin peak, (c) thrombin peak height, (d) area under the curve (AUC, thrombin potential), all for TG, and for PG: (e) plasmin peak, (f) fibrin lysis time, and (g) plasmin potential (AUC). In case of minimal TG, NHA parameters were difficult to obtain, especially low thrombin peak height, which can lead to an “undetectable” thrombin potential as the AUC cannot be calculated.
With NHA assay, multiple positive control measurements were obtained with normal pooled plasma (NPP), which consisted of equal amount of PPP, collected from 10 healthy donors, representing males and females equally, in the age range 18 to 70 years. Females were not pregnant, nor on oral contraceptives. NPP consisted of one batch that was aliquoted in separate vials and results from all positive control measurements were used as reference standard. The negative control measurements were obtained with plasma deficient of FVIII (HRF Inc, Raleigh, NC, USA). For all results, we used the mean of two measurements of the NHA.
2.5. Statistical analysis
All parameters are reported as median (interquartile range [IQR]) unless stated otherwise. We used descriptive statistics for patient characteristics. Spearman correlation was used to correlate FVIII one‐stage and chromogenic values and the correlation with TG parameters. The Mann‐Whitney test was used to determine differences in baseline NHA parameters between groups and the Wilcoxon matched‐pairs signed rank test to analyze differences before and after the FVIII bolus.
NHA parameters were obtained as absolute values and used to analyze individual response to the FVIII bolus. We have normalized the absolute values of thrombin peak height and thrombin potential by dividing them by the mean of NPP samples that were used as positive control along the specific patients’ assay run to be able to make a comparison between patients.
Statistical analyses were performed with Prism GraphPad, version 5.03. All p‐values are two‐sided and a p‐value lower than 0.05 was considered statistically significant.
3. RESULTS
3.1. Patient characteristics
In total, 25 patients were included in the study in which a complete PD profile was available. Furthermore, in one patient a PK/PD profile was determined twice because of a FVIII product switch, with an interval of 6 years, leading to a total of 26 PK/PD profiles. The patient group composed of 16 patients with severe HA, 3 with moderate, and 6 with mild HA. Patient characteristics are shown in Table 1 and individual patient characteristics are shown in Table S1 in supporting information. FVIII activity level before bolus administration were higher than the endogenous baseline (lowest ever measured) in some patients because of residual FVIII from previous administrations (patients on prophylaxis in whom a wash‐out period was impossible due to bleeding problems). The median age was 51 years (range 2‐77 years) and mean weight 82 kg (standard deviation [SD] 27 kg). Eleven patients received Advate for the PK study, five Aafact, five Helixate, three Kogenate, one Refacto, and one Haemate P®/Humate P. Median administered dose was 34 IU/kg (IQR 27‐35 IU/kg). Two patients were known to have a low‐titer inhibitor (patient 8 and 30 both 0.3 Nijmegen Bethesda units [NBU]/mL) and two additional patients had an inhibitor that was negative in the NBA, but positive in the NLTIA (patient 13 0.1 NLTIU/mL; patient 15 0.04 NLTIU/mL).
Table 1.
Clinical characteristics of patients
| Characteristic | Value |
|---|---|
| Number of patients | 25 |
| Number of determined profiles | 26 |
| Number of profiles per patient, median (range) | 1 (1‐2) |
| Hemophilia severity | |
| Severe, number (number of profiles) | 16 (16) |
| Baseline FVIII activity level in IU/dL, median (IQR) a | <1 (<1‐1) |
| Moderate, number (number of profiles) | 3 (4) |
| Baseline FVIII activity level in IU/dL, median (IQR) a | 5.5 (5‐6) |
| Mild, number (number of profiles) | 6 (6) |
| Baseline FVIII activity level in IU/dL, median (IQR) a | 9 (7‐10.5) |
| Age, median (range) 51 (2‐77) Weight, mean (SD) 76 (27) Dosage in IU/kg, median (IQR) 28 (27‐34) VWF concentration in %, median (IQR) 97 (77‐100) Hemoglobulin in mmol/l, median (IQR) 9.0 (8.4‐9.6) Patients with positive NBA, number (%) 2 (8) Patients with positive NLTIA, number (%) 4 (16) | |
| Product | |
| Advate | 11 |
| Aafact | 5 |
| Helixate | 5 |
| Kogenate | 3 |
| Haemate P | 1 |
| Refacto | 1 |
Abbreviations: FVIII, factor VIII; IQR, interquartile range; NBA, Nijmegen Bethesda Assay; NLTIA, Nijmegen Low Titer Inhibitor Assay; SD, standard deviation; VWF, von Willebrand factor.
Baseline FVIII activity level can be higher than lowest measured FVIII activity level due to residual FVIII concentrate or other factors (ie, stress).
3.2. Pharmacokinetic values
Median pre‐bolus baseline plasma FVIII activity level was 1.0 IU/dL (IQR < 1‐6.3) measured with the one‐stage assay and 2.5 IU/dL (<1‐6.0) with the chromogenic assay. Overall correlation between one‐stage and chromogenic assay was strong (r = 0.91; 95% confidence interval [CI] 0.90‐0.93; P < .0001; Figure 1A). Severe HA patients had a median FVIII activity level of <1 IU/dL (<1‐1), moderate patients of 5.5 IU/dL (5‐6), and mild patients of 9 IU/dL (7‐10.5).
Figure 1.
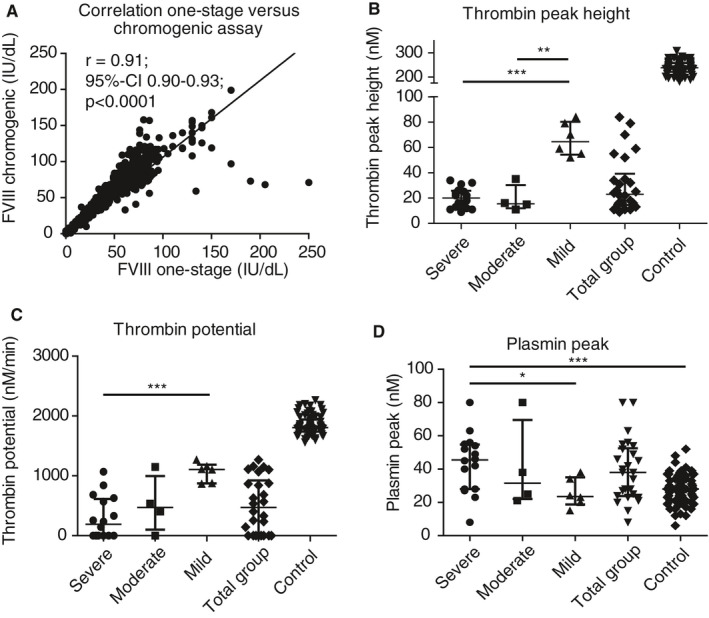
Correlation between factor VIII (FVIII) assays of all samples and baseline characteristics of thrombin peak height, thrombin potential, and plasmin peak. A, Correlation of FVIII activity level between FVIII one‐stage and chromogenic assay (r 0.91; 95% confidence interval [CI] 0.90‐0.93; P < .0001) of all FVIII activity levels measured (pre‐ and post‐bolus). Baseline characteristics of (B) thrombin peak height, (C) thrombin potential, and (D) plasmin peak. Group data are all patients taken together and the control represents all normal pooled plasma runs that were used as positive control with the Nijmegen Hemostasis Assay (n = 73). Lines represent median with interquartile range in all graphs. *P < .05; ** P < .01; *** P < .001
After infusion of the single FVIII bolus, median FVIII activity level increased to 71 IU/dL (62‐82) after 15 minutes, 68 IU/dL (55‐77) after 1 hour, 42 IU/dL (34‐55) after 6 hours, and 15 IU/dL (10‐26) after 24 hours, as shown in Figure 2A and Table S2 in supporting information.
Figure 2.
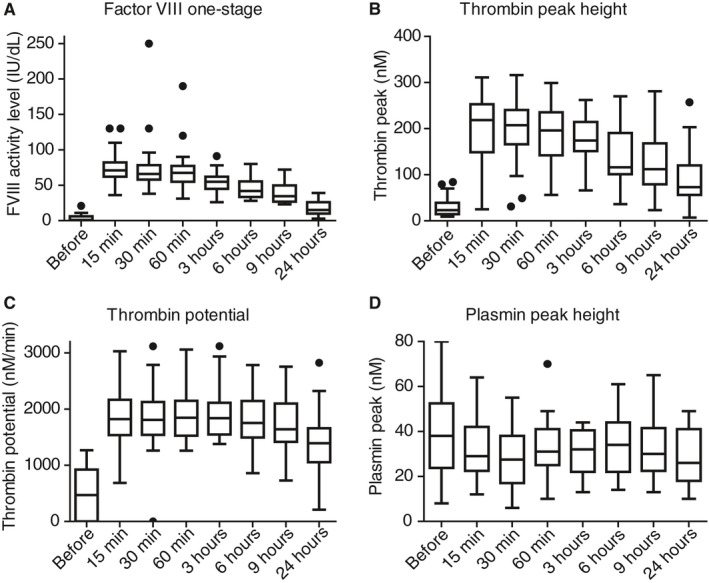
Factor VIII (FVIII), thrombin peak height, thrombin potential, and plasmin peak height after a single bolus of FVIII replacement therapy, measured at different time points. A, Reached FVIII activity level (in IU/dL) before and post infusion of FVIII replacement for the one‐stage assay, and reached (B) thrombin peak height (in nmol/L), (C) thrombin potential (in nmol/L/min), and (D) plasmin peak height (in nM) over time. Box represents median with interquartile range, whiskers indicate minimum and maximum, dots are outliers
3.3. Reference NHA values
Parallel to the NHA measurements of patient samples, the NHA was determined in samples of pooled plasma of healthy controls (a total of 73 separate runs from one batch of prepared NPP as positive control). The NHA results of this control group are given in Table S2. Correlations between FVIII activity level and TG parameters are shown in Figure S1 in supporting information.
3.4. Baseline values of thrombin and plasmin generation (pre‐bolus samples)
The results in baseline parameters of the NHA are shown in Figure 1 and individual baseline FVIII activity level and NHA parameters are shown in Table S3 in supporting information. At baseline, thrombin peak height was 23 nmol/L (IQR 15‐39; Figure 1B), and was relatively similar for severe and moderate HA patients (20 nmol/L [12‐26] versus 16 nmol/L [12‐30], respectively) but evidently higher in mild HA patients (65 nmol/L [54‐80], P < .001 for severe versus mild and P < .01 for mild versus moderate). Severe HA patients had a lower thrombin potential (190 nmol/L/min [undetectable‐613]) than moderate (471 nmol/L/min [102‐996]) and mild HA patients (1107 nmol/L/min [874‐1187], P < .001 for severe versus mild, Figure 1C). For plasmin generation, the difference in plasmin peak height was remarkable (Figure 1D; 38 nmol/L [24‐53] for all patients). It was 46 nmol/L (28‐55) in severe HA patients, but 32 nmol/L (22‐70) in moderate patients and 24 nmol/L (19‐35) in mild patients, indicating higher plasmin production in severe HA patients than in mild HA patients (P = .02), and even more pronounced when severe patients are compared to normal controls (28 [21.5‐34], P < .001). In Figure S2 in supporting information remaining TG and PG parameters are shown.
3.5. Pharmacodynamic parameters after FVIII replacement
Results of NHA measurement after FVIII replacement to assess pharmacodynamics are shown in Figure 2. Along with the increase of FVIII activity level after the bolus infusion, TG was enhanced as well. Thrombin peak height rose from 23 nmol/L (15‐39) pre‐bolus to 219 nmol/L (149‐253) at 15 minutes (Figure 2B) and gradually decreased to 73 nmol/L (56‐120) at 24 hours. Thrombin potential started at 471 nmol/L/min (undetectable‐924) and rose to 1823 nmol/L/min (1538‐2168) at 15 minutes (Figure 2C). Thrombin potential was enhanced for a longer period than FVIII activity level. At 24 hours after infusion, thrombin potential was still 1392 nmol/L/min (1054‐1660) corresponding to a FVIII activity level of 15 IU/dL. Plasmin peak decreased from 38 nmol/L (24‐53) to 28 nmol/L (17‐38) at 30 minutes after infusion of FVIII, P < .001 (Figure 2D). The other parameters of the NHA are shown in Figure S3 in supporting information and Table s2 and show normalization after FVIII replacement, as expected.
Figure 3 shows FVIII activity levels in combination with absolute values of TG parameters (thrombin peak [Figure 3A] and thrombin potential [Figure 3B]) at the different time points of the PK/PD study. Markedly, even though FVIII activity levels are relatively low 24 hours after the bolus, thrombin peak height and thrombin potential remained strikingly higher. Lag time and time to thrombin peak are shown in Figure S4 in supporting information.
Figure 3.
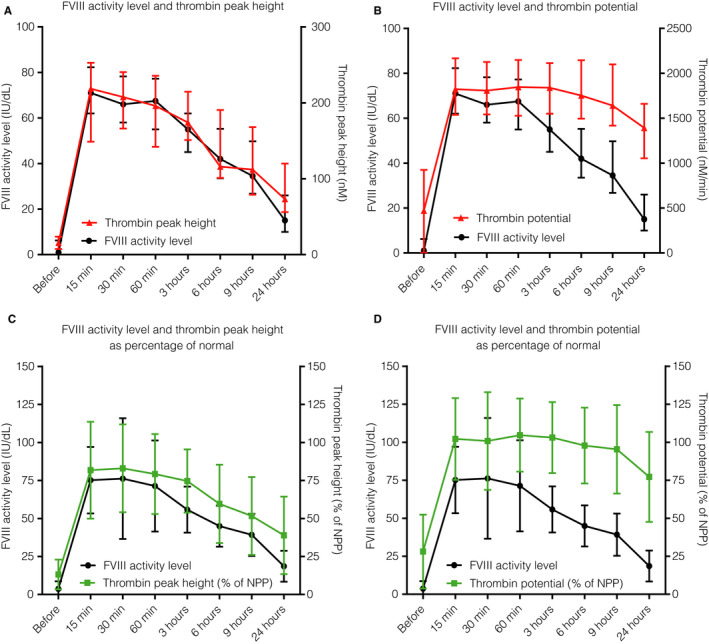
Factor VIII (FVIII) activity level and thrombin generation parameters (absolute and normalized) before and at different time points after FVIII supplementation. Reached FVIII activity level (in IU/dL on left y‐axis; black) before and post infusion of FVIII replacement and absolute values of (A) thrombin peak height (in nmol/L) and (B) thrombin potential (in nM/min), both in red on right y‐axis. Normalized values of (C) thrombin peak height (as percentage of NPP that was used as positive control in each assay) and (D) thrombin potential (as percentage of NPP) both in green, on right y‐axis. Dots represent median and error indicates interquartile range. NPP: normal pooled plasma
3.6. Normalized pharmacodynamic parameters
The results of the normalized values of thrombin peak height and thrombin potential in comparison to FVIII activity level are shown in Figure 3C and 3D and Table S2. In general, the normalized TG parameters showed comparable changes to the absolute TG parameters. Normalized thrombin peak (Figure 3C) was 10% of NPP before FVIII replacement therapy and increased to 87% (57‐108) after 15 minutes. As shown before (see Figure 3A), thrombin peak height remained higher than FVIII, at 6 hours it was 51% (43‐78) and at 24 hours 32% (23‐50). Thrombin potential showed matching results with normalized thrombin peak height (Figure 3D), but with an even longer persisting thrombin potential over time. At 9 hours, thrombin potential was 90% of normal (79‐114) and at 24 hours half the patients had a thrombin potential above 75% of normal (59‐87) while having a FVIII activity level of only 15 IU/dL (10‐26), indicating a persistent TG response after FVIII supplementation.
3.7. Patients with a neutralizing inhibitor and double pharmacokinetic profile
Two patients had a low titer inhibitor (patient 8 (Figure 4A) and 30 both 0.3 NBU (Figure 4B)) and two other patients had a low titer inhibitor measured with the NLTIA (patient 13 0.1 NLTIU (Figure 4C) and 15 0.04 NLTIU (Figure 4D)) with a negative result in the NBA. The FVIII half‐life was much shorter (eg, patient 8 of 4.5 hours) than average in three out of four patients, only patient 30 had a FVIII half‐life that was average (11.4 hours); also, the volume of distribution and clearance were influenced by the inhibitor. The PK profile and thrombin peak height and potential (as percentage of NPP) are given in Figure 4. All patients with a low inhibitor showed a normal thrombin peak height and potential recovery, and all, except for patient 8 (Figure 4A) and partially patient 13 (Figure 4C), show excellent duration of the thrombin potential response until 24 hours post infusion. Oppositely, thrombin peak height and FVIII activity level was lower compared to the mean level of patients without an inhibitor during the 24 hours after the bolus injection.
Figure 4.
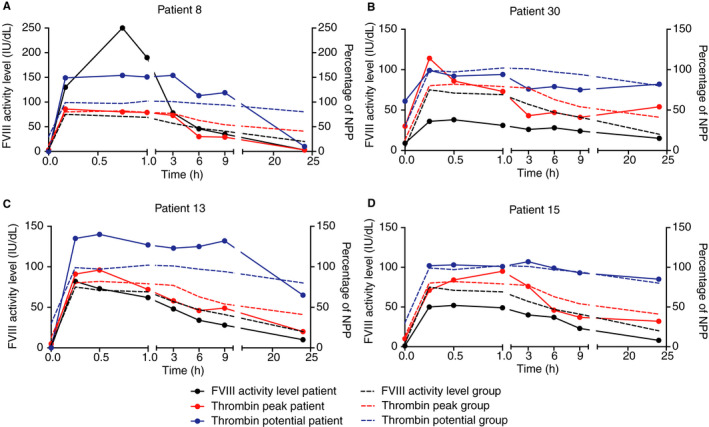
Pharmacokinetic and pharmacodynamic parameters of low titer inhibitor patients. The factor VIII (FVIII) activity level of the patient (continuous black line, on left y‐axis) before and at different time points post infusion of a bolus of FVIII replacement therapy and thrombin peak height (continuous red line, on right y‐axis) and thrombin potential (continuous blue line, on right y‐axis), both as percentage of NPP in hemophilia patients with an inhibitor. A, Patient 8; bolus of 91 IU/kg Kogenate, inhibitor in NBA 0.3 NBU/mL. B, Patient 30; bolus of 27 IU/kg Advate, inhibitor in NBA 0.3 NBU/mL. C, Patient 13; bolus of 39 IU/kg Advate, inhibitor in NLTIA 0.1 NLTIU/mL. D, Patient 15; bolus of 35 IU/kg Advate, inhibitor in NLTIA 0.04 NLTIU/mL. In all figures, the mean of all patients without inhibitors is shown in a dotted line (black for FVIII activity level; red for thrombin peak height and blue for thrombin potential). FVIII: factor VIII; NBA: Nijmegen Bethesda Assay; NBU, Nijmegen Bethesda unit; NLTIA: Nijmegen Low Titer Inhibitor Assay; NPP: normal pooled plasma
Most interestingly of all, patient 8 was given 91 IU/kg FVIII, leading to a FVIII activity level of 130 IU/dL after 10 minutes and even 250 IU/dL after 45 minutes. This was associated with a maximal thrombin peak height of 86% of normal and thrombin potential of 154% of normal, which both remained at this level for 3 hours; afterward it decreased to normal levels until 9 hours after the bolus and was only 10% of normal after 24 hours.
In one patient (patient 12), a PK profile was performed twice, when a switch in FVIII replacement product was initiated. The first PK profile was done with Aafact 23 IU/kg and the second with 26 IU/kg Advate (Figure S5 in supporting information). Notably, the patient has an adequate response of FVIII activity levels after both injections, but thrombin peak height was lower than expected with both products, while thrombin potential reached normal values, an effect that is not seen in other patients. Also, an increase in thrombin peak height and potential at 24 hours compared to previous time points is seen after both infusions.
4. DISCUSSION
In this study, the effect of FVIII replacement therapy on pharmacokinetic and pharmacodynamic parameters were obtained in a group of 25 HA patients. Baseline TG parameters showed significant differences between severe HA and mild HA patients, thereby indicating that small changes in FVIII activity levels can have a major impact on TG. After the FVIII bolus, most patients reached a normalization of TG, FVIII activity level decreased faster than TG, especially thrombin potential. Also, great differences in TG profiles were observed between severe HA patients with equal baseline plasma FVIII activity levels, indicating that other pro‐ and anticoagulation factors play an important role in an individual's hemostatic balance. Based on our results, thrombin peak height in combination with thrombin potential, and when possible, plasmin peak height measured with the NHA, reflect the hemostatic balance adequately in patients with HA.
The NHA is the only assay in which TG and PG is measured simultaneously in one well. The simultaneous thrombin and plasmin generation (STP) assay by Simpson et al 30 and the combined thrombin and plasmin generation (T/P‐G) assay by Matsumoto et al 31 measure TG and PG in separate wells. These assays have only been used to measure baseline TG and PG and show similar results regarding baseline TG in HA patients, 30 , 31 but a difference between severe and moderate HA patients was not observed. 31 We did observe a difference in TG between mild and severe HA patients, possibly because we included more patients in our study.
At baseline, we observed an increased plasmin peak height and plasmin potential, corresponding to low TG profiles that disappeared after the FVIII bolus, indicating hyperfibrinolysis associated with low TG. This is in accordance with previous reports that suggest an enhanced fibrinolytic capacity due to reduced thrombin formation and subsequent diminished thrombin activatable fibrinolysis inhibitor (TAFI) activation. 32 , 33 Even though hyperfibrinolysis was not demonstrated in the STP and T/P‐G assay, 30 , 31 this difference can be explained by the assay set‐up and shows the additional value of the NHA where the tissue plasminogen activator (tPA) concentration is titrated to adequately measure TAFI activity.
Overall, we observed a very good correlation between the one‐stage FVIII assay and the chromogenic assay. However, some patients (for example patient 18) clearly showed a discrepancy in the results between the assays. This discrepancy could be explained by the specific genetic mutation of the patient. 34 For patient 18, genetic data was unavailable, but the higher chromogenic FVIII activity level in patients 13 and 20 can be explained by their p.Arg1708Cys variant. 35
A clinically challenging group of HA patients are those who develop a neutralizing inhibitor during treatment. We showed the results of patients with a low titer inhibitor (n = 2) and a negative titer in the NBA with a positive NLTIA (n = 2). In general, except patients 8 and partially patient 13, patients showed an adequate initial response to the FVIII bolus, but later, mostly after 1 to 3 hours, mainly thrombin peak height was decreased compared to non‐inhibitor patients. In contrast, thrombin potential remained relatively equal to non‐inhibitor patients and did not show a decreasing trend over time. Only patient 8 had a diminished duration of FVIII supplementation with TG returning to baseline after 24 hours, probably due to the inhibitor effect. Another interesting observation was made in this patient, who reached a maximum FVIII activity level of 250 IU/dL. One could assume a highly increased TG in this case. However, the highest observed thrombin peak height was 240 nmol/L (corresponding to only 86% of normal) and thrombin potential of 3118 nmol/L/min (154% of normal) indicating that TG is a better indicator of an inhibitor than FVIII activity level. As elevated FVIII activity levels are associated with venous thromboembolism (VTE), 36 TGAs can possibly indicate which patient has an increased risk to develop VTE when FVIII is highly elevated, especially for a longer period of time. 37
One patient had a PK profile determined twice with a different product (plasma‐derived and recombinant) with an excellent reproducibility of the observed TG and PG parameters. This patient showed a normalization of thrombin potential (90%‐100% of normal) while thrombin peak height was only 50% of normal, proving the individual response of TG to FVIII supplementation. 25 , 26 Most interesting in this patient is the elevation of TG after 24 hours, which occurred with both products, with an interval of 6 years. This effect can possibly be explained by cellular and/or platelet alteration due to TG activation, for example because of microRNA expression and influence on other pro‐ and anticoagulation factor expression. 38
In general, we observed prolonged patency of thrombin peak height and mainly thrombin potential in contrast to FVIII activity levels, thereby indicating an increased duration of TG response after FVIII supplementation in HA patients without inhibitors. A proportion of patients even kept normal values of NHA parameters despite decreasing FVIII activity levels (13 patients had a thrombin potential of ≥75% of normal after 24 hours and 4 even of ≥100%). These prolonged TG effects have been observed previously by others, 7 , 25 and this effect is thought to be highly dependent on the individual patient. 25 , 26 As stated before, this inter‐patient variability can be explained by common genetic variations (eg, factor V Leiden) in factors involved in the hemostatic balance. This advocates for an individual TG profile monitoring and potential PD‐driven management of HA. 39
TG measurements make it possible to individualize treatment options. The plea for individual FVIII dosing is in accordance with the reduction in annual bleeding rate (ABR) using population‐based PK data to dose patients, 3 , 5 but an ABR of zero is still not possible with this approach. Therefore, the additional use of TG of HA patients can assess an individual patient's hemostatic balance to reach a maximum reduction of spontaneous bleeds, based on integrated PK/PD parameters. This approach has recently been tested in a study that showed an increased frequency of spontaneous bleeding in HA patients with reduced TG regardless of FVIII trough levels when patients were on personalized prophylaxis with human‐cl rhFVIII (Nuwiq). 9 A follow‐up study postulated a PK/PD non‐linear relationship between FVIII and ETP, thereby creating a dosing tool for this FVIII product to even further personalize FVIII prophylaxis. 40
Our goal is to use our PD data to develop a uniform model to individualize FVIII replacement therapy based on PK/PD data for a range of FVIII products. A concomitant advantage of PD analysis is that factors influencing the hemostatic balance, such as operative stress and inflammation, are also taken into account, and thereby possibly reduce FVIII product need. 41 , 42 A prospective study to determine safety (ie, bleeding) and efficacy of such a regime would be highly fascinating.
There are some limitations in this study. First, the inclusion period ran for 10 years and although most patients were included in the last years of the study, some of the samples were stored for a longer duration of time (ie, more than 10 years). The importance of adequate preanalytical procedures in TGA is clearly illustrated by some outliers in the data (eg, difficulty collecting blood from some patients). As all samples have been handled as much as possible according to the standardized preanalytical and analytical procedures of the International Society on Thrombosis and Haemostasis, 43 we have included these samples in the analysis to give the most accurate representation of our data. Second, despite all efforts, not all patients included in the PK study gave informed consent for analysis of TG and PG, therefore the PK data of these patients were excluded in this study. Also, patients did not receive an equal FVIII bolus, as this was determined by the treating physician. However, we found no correlation between FVIII dosage and highest measured thrombin peak height or thrombin potential (data not shown). Previous studies 8 , 11 , 12 have investigated the association of the bleeding phenotype of HA patients with TGAs. As this study was initiated to link PK with PD, no ABR was obtained. With results of baseline TG characteristics, this would be highly interesting, but we cannot determine this information retrospectively. Last, the main limitation of all studies using a TGA is lack of generalizability. To solve this problem, we have introduced normalized TG values, thereby making comparisons and partnerships between groups easier.
In conclusion, in this study we have shown clear differences in TGA data between HA patients with equal FVIII activity levels. HA patients show an individual TG response when a FVIII replacement bolus is administered, indicating the importance to determine a TG profile to prevent under‐ and overdosing of FVIII. As nowadays PK‐driven dosing of FVIII is becoming the new standard of care, we suggest adding pharmacodynamic parameters determined by TGAs to provide the maximum reflection of the hemostatic balance and thereby possibly preventing spontaneous bleeds and arthropathy in HA patients.
CONFLICTS OF INTEREST
WvH received unrestricted grants from Bayer, Shire, Novo Nordisk, and CSL Behring. WvH is the founder and CSO of Enzyre BV, a Radboudumc spinoff company. RM has received grants from governmental and societal research institutes such as NWO, ZonMW, and Innovation fund and unrestricted investigator research grants from Baxter, Baxalta, Shire, Takeda, Bayer, CSL Behring, and Sobi. He has served as advisor for Bayer, CSL Behring, Merck Sharp & Dohme, Baxter, Baxalta, Shire, Takeda. All grants and fees were paid to the institution. LV, LB, WB, BL‐vG, NB, and SS have no conflicts of interest to declare.
AUTHOR CONTRIBUTIONS
LV analyzed the data, performed the research, and wrote the manuscript. LB analyzed the data. WB conducted the measurements. BL‐vG recruited the patients. NB critically revised the manuscript. RM critically revised the manuscript. WvH designed the study, oversaw execution of measurements, and analysis of the data. SS wrote the manuscript. All authors critically revised the manuscript and gave final approval for publication.
Supporting information
Supplementary Material
Valke LLFG, Bukkems LH, Barteling W, et al. Pharmacodynamic monitoring of factor VIII replacement therapy in hemophilia A: Combining thrombin and plasmin generation. J Thromb Haemost. 2020;18:3222–3231. 10.1111/jth.15106
Manuscript handled by: Robert Gosselin
Final decision: Robert Gosselin, 14 September 2020
REFERENCES
- 1. Mannucci PM, Tuddenham EG. The hemophilias–from royal genes to gene therapy. N Engl J Med. 2001;344:1773‐1779. [DOI] [PubMed] [Google Scholar]
- 2. Srivastava A, Brewer AK, Mauser‐Bunschoten EP, et al. Treatment Guidelines Working Group on Behalf of The World Federation Of H. Guidelines for the management of hemophilia. Haemophilia. 2013;19:e1‐47. [DOI] [PubMed] [Google Scholar]
- 3. Iorio A. Using pharmacokinetics to individualize hemophilia therapy. Hematology Am Soc Hematol Educ Program. 2017;2017:595‐604. [DOI] [PMC free article] [PubMed] [Google Scholar]
- 4. Preijers T, van Moort I, Fijnvandraat K, et al. Cross‐evaluation of Pharmacokinetic‐Guided Dosing Tools for Factor VIII. Thromb Haemost. 2018;118:514‐525. [DOI] [PubMed] [Google Scholar]
- 5. Nagao A, Yeung CHT, Germini F, Suzuki T. Clinical outcomes in hemophilia A patients undergoing tailoring of prophylaxis based on population‐based pharmacokinetic dosing. Thromb Res. 2019;173:79‐84. [DOI] [PubMed] [Google Scholar]
- 6. Jimenez‐Yuste V, Auerswald G, Benson G, et al. Achieving and maintaining an optimal trough level for prophylaxis in haemophilia: the past, the present and the future. Blood Transfus. 2014;12:314‐319. [DOI] [PMC free article] [PubMed] [Google Scholar]
- 7. Dargaud Y, Beguin S, Lienhart A, et al. Evaluation of thrombin generating capacity in plasma from patients with haemophilia A and B. Thromb Haemost. 2005;93:475‐480. [DOI] [PubMed] [Google Scholar]
- 8. Beltran‐Miranda CP, Khan A, Jaloma‐Cruz AR, Laffan MA. Thrombin generation and phenotypic correlation in haemophilia A. Haemophilia. 2005;11:326‐334. [DOI] [PubMed] [Google Scholar]
- 9. Dargaud Y, Negrier C, Rusen L, et al. Individual thrombin generation and spontaneous bleeding rate during personalized prophylaxis with Nuwiq((R)) (human‐cl rhFVIII) in previously treated patients with severe haemophilia A. Haemophilia. 2018;24:619‐627. [DOI] [PubMed] [Google Scholar]
- 10. Young G, Sorensen B, Dargaud Y, Negrier C, Brummel‐Ziedins K, Key NS. Thrombin generation and whole blood viscoelastic assays in the management of hemophilia: current state of art and future perspectives. Blood. 2013;121:1944‐1950. [DOI] [PMC free article] [PubMed] [Google Scholar]
- 11. Tarandovskiy ID, Balandina AN, Kopylov KG, et al. Investigation of the phenotype heterogeneity in severe hemophilia A using thromboelastography, thrombin generation, and thrombodynamics. Thromb Res. 2013;131:e274‐e280. [DOI] [PubMed] [Google Scholar]
- 12. Haghpanah S, Bazrafshan A, Silavizadeh S, Dehghani J, Afrasiabi A, Karimi M. Evaluation of Thrombin Generation Assay in Patients With Hemophilia. Clin Appl Thromb Hemost. 2016;22:322‐326. [DOI] [PubMed] [Google Scholar]
- 13. Ay Y, Balkan C, Karapinar DY, Akin M, Bilenoglu B, Kavakli K. Feasibility of using thrombin generation assay (TGA) for monitoring of haemostasis during supplementation therapy in haemophilic patients without inhibitors. Haemophilia. 2012;18:911‐916. [DOI] [PubMed] [Google Scholar]
- 14. Hugenholtz GC, Luddington R, Baglin T. Haemostatic response to factor VIII administration in patients with haemophilia A measured by thrombin generation and correlation with factor concentrate use. Haemophilia. 2016;22:e42‐e45. [DOI] [PubMed] [Google Scholar]
- 15. Al Hawaj MA, Martin EJ, Venitz J, et al. Monitoring rFVIII prophylaxis dosing using global haemostasis assays. Haemophilia. 2013;19:409‐414. [DOI] [PMC free article] [PubMed] [Google Scholar]
- 16. Luna‐Zaizar H, Beltran‐Miranda CP, Esparza‐Flores MA, et al. Thrombin generation as objective parameter of treatment response in patients with severe haemophilia A and high‐titre inhibitors. Haemophilia. 2014;20:e7‐14. [DOI] [PubMed] [Google Scholar]
- 17. Dargaud Y, Lienhart A, Meunier S, et al. Major surgery in a severe haemophilia A patient with high titre inhibitor: use of the thrombin generation test in the therapeutic decision. Haemophilia. 2005;11:552‐558. [DOI] [PubMed] [Google Scholar]
- 18. Ay Y, Balkan C, Karapinar DY, Akin M, Bilenoglu B, Kavakli K. Feasibility of using thrombin generation assay (TGA) for monitoring bypassing agent therapy in patients with hemophilia having inhibitors. Clin Appl Thromb Hemost. 2013;19:389‐394. [DOI] [PubMed] [Google Scholar]
- 19. Ragni MV, DiMichele DM, Hay CM, et al. Thrombin generation and bleeding in haemophilia inhibitor patients during immune tolerance induction. Haemophilia. 2016;22:240‐247. [DOI] [PubMed] [Google Scholar]
- 20. Tripodi A, Chantarangkul V, Clerici M, et al. Thrombin generation assay for testing hemostatic effect of factor VIII concentrates in patients with hemophilia A and inhibitors: In vitro results from the PredicTGA study. Thromb Res. 2019;174:84‐87. [DOI] [PubMed] [Google Scholar]
- 21. Dargaud Y, Lienhart A, Negrier C. Prospective assessment of thrombin generation test for dose monitoring of bypassing therapy in hemophilia patients with inhibitors undergoing elective surgery. Blood. 2010;116:5734‐5737. [DOI] [PubMed] [Google Scholar]
- 22. Dargaud Y, Lienhart A, Janbain M, Le Quellec S, Enjolras N, Negrier C. Use of thrombin generation assay to personalize treatment of breakthrough bleeds in a patient with hemophilia and inhibitors receiving prophylaxis with emicizumab. Haematologica. 2018;103:e181‐e183. [DOI] [PMC free article] [PubMed] [Google Scholar]
- 23. Kizilocak H, Yukhtman CL, Marquez‐Casas E, Lee J, Donkin J, Young G. Management of perioperative hemostasis in a severe hemophilia A patient with inhibitors on emicizumab using global hemostasis assays. Ther Adv Hematol. 2019;10:2040620719860025. [DOI] [PMC free article] [PubMed] [Google Scholar]
- 24. Valke L, Beckers EAM, Blijlevens NMA, van Heerde WL, Schols SEM. Effect of emicizumab on thrombin generation: A case report of breakthrough bleeding during emicizumab treatment. Haemophilia. 2020. 10.1111/hae.14085 [DOI] [PubMed] [Google Scholar]
- 25. Lewis SJ, Stephens E, Florou G, et al. Measurement of global haemostasis in severe haemophilia A following factor VIII infusion. Br J Haematol. 2007;138:775‐782. [DOI] [PubMed] [Google Scholar]
- 26. Chelle P, Montmartin A, Piot M, et al. Prediction of individual factor VIII or IX level for the correction of thrombin generation in haemophilic patients. Haemophilia. 2018;24:995‐1001. [DOI] [PubMed] [Google Scholar]
- 27. van Geffen M, Loof A, Lap P, et al. A novel hemostasis assay for the simultaneous measurement of coagulation and fibrinolysis. Hematology. 2011;16:327‐336. [DOI] [PubMed] [Google Scholar]
- 28. Verbruggen B, Novakova I, Wessels H, Boezeman J, van den Berg M, Mauser‐Bunschoten E. The Nijmegen modification of the Bethesda assay for factor VIII: C inhibitors: improved specificity and reliability. Thromb Haemost. 1995;73:247‐251. [PubMed] [Google Scholar]
- 29. Dardikh M, Albert T, Masereeuw R, et al. Low‐titre inhibitors, undetectable by the Nijmegen assay, reduce factor VIII half‐life after immune tolerance induction. J Thromb Haemost. 2012;10:706‐708. [DOI] [PubMed] [Google Scholar]
- 30. Simpson ML, Goldenberg NA, Jacobson LJ, Bombardier CG, Hathaway WE, Manco‐Johnson MJ. Simultaneous thrombin and plasmin generation capacities in normal and abnormal states of coagulation and fibrinolysis in children and adults. Thromb Res. 2011;127:317‐323. [DOI] [PubMed] [Google Scholar]
- 31. Matsumoto T, Nogami K, Shima M. Simultaneous measurement of thrombin and plasmin generation to assess the interplay between coagulation and fibrinolysis. Thromb Haemost. 2013;110:761‐768. [DOI] [PubMed] [Google Scholar]
- 32. Broze GJ Jr, Higuchi DA. Coagulation‐dependent inhibition of fibrinolysis: role of carboxypeptidase‐U and the premature lysis of clots from hemophilic plasma. Blood. 1996;88:3815‐3823. [PubMed] [Google Scholar]
- 33. Mosnier LO, Lisman T, van den Berg HM, Nieuwenhuis HK, Meijers JC, Bouma BN. The defective down regulation of fibrinolysis in haemophilia A can be restored by increasing the TAFI plasma concentration. Thromb Haemost. 2001;86:1035‐1039. [PubMed] [Google Scholar]
- 34. Peyvandi F, Oldenburg J, Friedman KD. A critical appraisal of one‐stage and chromogenic assays of factor VIII activity. J Thromb Haemost. 2016;14:248‐261. [DOI] [PubMed] [Google Scholar]
- 35. Pavlova A, Delev D, Pezeshkpoor B, Muller J, Oldenburg J. Haemophilia A mutations in patients with non‐severe phenotype associated with a discrepancy between one‐stage and chromogenic factor VIII activity assays. Thromb Haemost. 2014;111:851‐861. [DOI] [PubMed] [Google Scholar]
- 36. Rietveld IM, Lijfering WM, le Cessie S, et al. High levels of coagulation factors and venous thrombosis risk: strongest association for factor VIII and von Willebrand factor. J Thromb Haemost. 2019;17:99‐109. [DOI] [PubMed] [Google Scholar]
- 37. O'Donnell J, Mumford AD, Manning RA, Laffan MA. Marked elevation of thrombin generation in patients with elevated FVIII: C and venous thromboembolism. Br J Haematol. 2001;115:687‐691. [DOI] [PubMed] [Google Scholar]
- 38. Teruel‐Montoya R, Rosendaal FR, Martinez C. MicroRNAs in hemostasis. J Thromb Haemost. 2015;13:170‐181. [DOI] [PubMed] [Google Scholar]
- 39. Pavlova A, Oldenburg J. Defining severity of hemophilia: more than factor levels. Semin Thromb Hemost. 2013;39:702‐710. [DOI] [PubMed] [Google Scholar]
- 40. Delavenne X, Ollier E, Lienhart A, Dargaud Y. A new paradigm for personalized prophylaxis for patients with severe haemophilia A. Haemophilia. 2020;26:228‐235. [DOI] [PMC free article] [PubMed] [Google Scholar]
- 41. Hazendonk HC, Lock J, Mathot RA, et al. Perioperative treatment of hemophilia A patients: blood group O patients are at risk of bleeding complications. J Thromb Haemost. 2016;14:468‐478. [DOI] [PubMed] [Google Scholar]
- 42. Schutte LM, de Rooij N, Hazendonk H, et al. Current dosing practices for perioperative factor VIII concentrate treatment in mild haemophilia A patients result in FVIII levels above target. Haemophilia. 2019;25:960‐968. [DOI] [PubMed] [Google Scholar]
- 43. Dargaud Y, Wolberg AS, Gray E, Negrier C, Hemker HC. Subcommittee on Factor Viii FIX, Rare Coagulation D. Proposal for standardized preanalytical and analytical conditions for measuring thrombin generation in hemophilia: communication from the SSC of the ISTH. J Thromb Haemost. 2017;15:1704‐1707. [DOI] [PMC free article] [PubMed] [Google Scholar]
Associated Data
This section collects any data citations, data availability statements, or supplementary materials included in this article.
Supplementary Materials
Supplementary Material