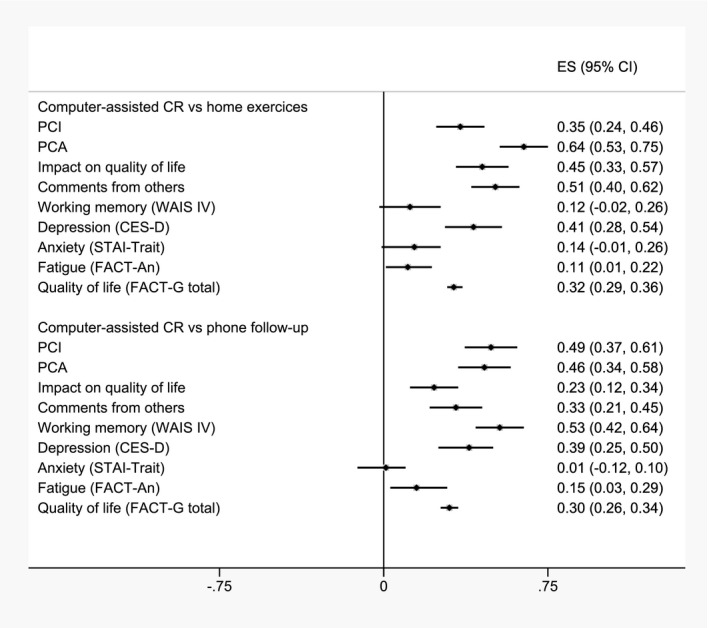
Figure 2.

Forest plot of effect sizes and 95% CIs for computer‐assisted cognitive rehabilitation compared with the 2 active control groups. CES‐D, Center for Epidemiologic Studies Depression Scale; CR, cognitive rehabilitation; ES, effect size; FACT‐An, Functional Assessment of Cancer Therapy–Anemia; FACT‐G, Functional Assessment of Cancer Therapy–General; PCA, perceived cognitive abilities; PCI, perceived cognitive impairments; STAI‐Trait, Spielberger State‐Trait Anxiety Inventory; WAIS, Wechsler Adult Intelligence Scale.
