

Abstract
Organisms adapt to their environment through coordinated changes in mitochondrial function and metabolism. The mitochondrial protonmotive force (PMF) is an electrochemical gradient that powers ATP synthesis and adjusts metabolism to energetic demands via cellular signaling. It is unknown how or where transient PMF changes are sensed and signaled due to the lack of precise spatiotemporal control in vivo. We addressed this by expressing a light‐activated proton pump in mitochondria to spatiotemporally “turn off” mitochondrial function through PMF dissipation in tissues with light. We applied our construct—mitochondria‐OFF (mtOFF)—to understand how metabolic status impacts hypoxia resistance, a response that relies on mitochondrial function. Activation of mtOFF induced starvation‐like behavior mediated by AMP‐activated protein kinase (AMPK). We found prophylactic mtOFF activation increased survival following hypoxia, and that protection relied on neuronal AMPK. Our study links spatiotemporal control of mitochondrial PMF to cellular metabolic changes that mediate behavior and stress resistance.
Keywords: anoxia, metabolism, optogenetics, uncoupling
Abbreviations
- AMPK
AMP‐activated protein kinase
- ATR
all‐trans‐retinal
- ChR2
channelrhodopsin 2
- ETC
electron transport chain
- IM
inner mitochondrial membrane
- IMS
intermembrane space
- mtOFF
mitochondria‐OFF
- mtON
mitochondria‐ON
- mmCRISPi
Mos1 mediated CRISPR Insertion
- MTS
mitochondrial targeting sequence
- NGM
nematode growth medium
- PMF
protonmotive force
- TMRE
tetramethylrhodamine ethyl ester
- ΔΨm
mitochondrial membrane potential
- ΔpH
pH gradient
1. INTRODUCTION
Mitochondria are organelles that provide energy to cells. Matching energy supply with energy demand is coordinated through various processes and is critical for cellular adaptation and survival under changing conditions. Therefore, an organism's health depends not only on mitochondrial energy production, but on the ability to sense metabolic status and the ability of mitochondria to signal appropriately to use that energy. 1 , 2 The mechanisms through which cellular energy‐related signaling can occur likely depend on the electrochemical gradient across the mitochondrial inner membrane (IM).
Mitochondrial respiration results in a proton gradient across the IM known as the protonmotive force (PMF). Ultimately, respiratory complexes of the electron transport chain (ETC) convert chemical energy into electrical potential energy by pumping protons across the IM, creating this gradient. The PMF can then be consumed at ATP synthase, converting the PMF back to chemical energy in the form of ATP to catalyze reactions (Figure 1A). This process is called oxidative phosphorylation, as ETC activity consumes oxygen (O2) to maintain PMF that is then used to phosphorylate ADP to ATP. The PMF is also used for substrate 3 and protein 4 import to the mitochondrial matrix or IM, calcium signaling, 4 and quality control management through autophagy, 5 , 6 mitochondrial biogenesis, 7 and proteostatic responses that involve mitochondria‐nucleus communication. 8
FIGURE 1.
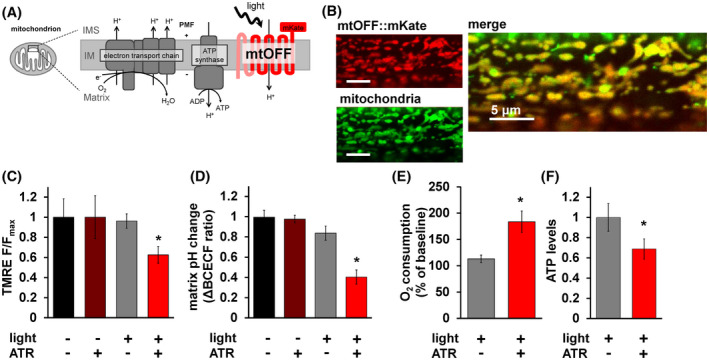
Mitochondria‐OFF (mtOFF) decreases mitochondrial protonmotive force. A, Schematic of mtOFF targeted to the mitochondrial inner membrane (IM) to dissipate the protonmotive force (PMF). Electron transport chain (ETC) complexes together consume O2 and generate the PMF by proton (H+) pumping from the matrix to the intermembrane space (IMS). Mitochondrial ATP synthase uses the PMF to make ATP from ADP. The N terminal mitochondria targeting sequence and two transmembrane regions of the rat SDHC1 protein are shown in pink fused to the red proton pumping portion of mtOFF. The red fluorescent protein mKate is shown on the C terminus in the IMS in red. Light activation of mtOFF results in proton pumping from the IMS to the matrix. B, Fluorescent images show muscle mitochondria of a living C. elegans ubiquitously expressing mtOFF. Red signal shows mKate fluorescence and green signal shows the MitoTracker Green staining of mitochondria. The merged image shows the mitochondrial localization of the mtOFF::mKate construct overlapping with MitoTracker Green signal. Scale bars are 5 μm. C, Quantification of TMRE fluorescence intensity in isolated mitochondria incubated with succinate to fuel membrane potential (ΔΨm) shows decreased ΔΨm upon mtOFF activation. Data are normalized to dark conditions and full light doses are presented in Figure S2B. One‐way ANOVA was performed with Tukey's test for multiple comparisons, *P = .0247. Data are means ± SEM, n = 4 independent mitochondrial isolations. D, Quantification of change in BCECF‐AM ratio in isolated mitochondria fueled with succinate shows decreased mitochondrial matrix pH after mtOFF activation. One‐way ANOVA was performed with Tukey's test for multiple comparisons, ‐ATR ‐light vs + ATR +light *P = .0002, +ATR ‐light vs + ATR +light *P = .0002, ‐ATR + light vs + ATR +light *P = .0036. Data are means ± SEM, n = 4‐5 independent mitochondria isolations. E, O2 consumption rates of whole animals normalized to dark conditions were increased upon mtOFF activation. Raw O2 consumption rates are shown in Figure S2D. Two‐tailed unpaired t test was performed, *P = .0195. Data are means ± SEM, n = 5, where one n is one O2 consumption rate from ~ 1500 animals in a Clark type O2 electrode. F, Relative ATP levels normalized to dark conditions from whole animals was decreased upon mtOFF activation. Two‐tailed unpaired t test was performed, *P = .0230. Data are means ± SEM, n = 5 independent assays from three plates each for each condition containing at least 100 animals
PMF changes are physiologic and adaptive, and function to alter cellular functions regulated by mitochondria. For example, organisms that experience different oxygen tensions can change ETC activity and PMF, 9 , 10 and the ability to adapt to these changes is linked to survival. 11 , 12 The inability to respond to changes through the PMF can result in pathology. For example, during hypoxia, the PMF is lost 13 and leads to damage or death if not restored. 14 Finding conditions that allow resistance to hypoxia is important to better understand diseases where O2 deprivation causes cellular damage. During ischemic stroke, for example, neurons are starved of the O2 that fuels the ETC, resulting in decreased PMF. The PMF is rapidly restored upon reperfusion, and this rapid reestablishment can drive oxidative stress from an overwhelmed ETC. 15 , 16 This oxidative damage is highly sensitive to the PMF, where a slight decrease at reperfusion can greatly decrease oxidative stress. 17 , 18 Artificially decreasing the PMF with drugs is protective in hypoxia models, but spatial and temporal nuance is missing due to the imprecise nature of pharmacology. Pharmacologic approaches are not tissue or cell‐type selective. In addition, once pharmacologic agents act to decrease PMF, they cannot be reversed. Therefore, using drugs to decrease the PMF is dangerous due to narrow therapeutic windows and lack of tissue selectivity. 19 , 20 , 21 This difficulty in developing PMF therapy highlights the need for spatiotemporal control in experimental models to understand how decreasing the PMF provides stress resistance. How and where the metabolic state of an organism is sensed, and how that translates to physiologic changes remains unclear. With this study, we sought to understand how and where animals sense PMF dissipation. We also asked how and where energy sensing elicits protective signaling prior to hypoxia exposure in living animals. We achieved this spatiotemporal control through optogenetics.
We have recently shown that a decreased PMF prior to pathologic hypoxia is necessary and sufficient for protective signaling in Caenorhabditis elegans. 22 Using the mitochondria‐ON (mtON) construct we determined the temporal effect by the acute reversibility of light exposure. Our result was supported by evidence in cells using a similar optogenetic approach to spatiotemporally control the PMF, showing brief PMF loss preconditions cells to be resistant to later, severe PMF disruption. 23 Decreasing the PMF during hypoxia to relieve oxidative stress is thoroughly characterized 24 , 25 , 26 , 27 , 28 ; here we address how decreasing the PMF prophylactically signals protection against impending hypoxic insults in vivo through energy sensing. We hypothesized that decreasing the PMF with high spatial and temporal precision using optogenetics would show how and where energetic signals are transmitted from mitochondria throughout an organism to mount a stress‐resistance response to hypoxia.
Responses to energy availability may provide a mechanism of hypoxia resistance through changes in the PMF, as fuel for the ETC impacts how O2 is used. Indeed, energy sensing through food availability plays an important and specific role in responses to O2 deprivation in model organisms. For example, the nematode C. elegans requires AMP‐activated protein kinase (AMPK) signaling for a healthy recovery from hypoxia. 29 C. elegans AMPK responds to nutritional state and coordinates hypoxia resistance. 29 These results translate to mammalian models, as AMPK protects against hypoxic pathologies like ischemia‐reperfusion injury. 30 , 31 In addition, AMPK acts as a neuronal energy sensor capable of changing an animal's behavior based on food availability. 32 , 33 These combined data lead us to ask how mitochondrial energy status is sensed and how it is translated to hypoxia resistance.
In our previous work with mtON, energy‐sensing signaling through AMPK was silenced when the mitochondrial function was increased with light. 22 Here, we causally link AMPK signaling as a direct readout of changing PMF and confirm its requirement for resistance to hypoxia. Given that neuronal AMPK can control an organism's behavior in response to sensed energy availability, 32 we show that neuronal AMPK is regulated downstream of changes in the PMF. Further, we show that neuronal AMPK activation downstream of dissipated PMF is sufficient for hypoxia resistance, linking perceived internal energy‐state to stress‐resistance through metabolism.
2. MATERIALS AND METHODS
2.1. Molecular biology
In vivo transgene construction was carried out by homology‐directed single‐copy CRISPR/Cas9 gene insertion using the Mos1 mediated CRISPR Insertion (mmCRISPi) method. 34 Briefly, transgenes were built through recombineering of four PCR fragments each containing at least 35 base pairs of homology. The fragments encoded a promoter, a mitochondrial targeting sequence of SDHC1 fused to the light‐activated proton pump, Mac, the red fluorescent protein mKate, and a characterized 5′ untranslated region from unc‐54. The DNA coding sequence for 144 N terminal amino acids of the rat SDHC1 protein was fused to the N terminus of Mac by molecular cloning 22 , 35 to achieve mitochondrial expression. The eft‐3 promoter was amplified from plasmid DNA pDD162 (forward amplification primer: ACAGCTAGCGCACCTTTGGTCTTTTA, reverse amplification primer: ACAACCGGTGAGCAAAGTGTTTCCCA). The rab‐3 promoter was amplified from plasmid DNA pSEP45 (forward amplification primer: TCAGTGCAGTCAACATGTCGAGTTTCGTGCCGAATGACGACGACGACCTCGACGGCAAC, reverse amplification primer: GCCATTTTTAAGCCTGCTTTTTTGTACAAACTTGTCTGAAAATAGGGCTACTGTAG). The vha‐6 promoter was amplified from plasmid DNA pELA10 (forward amplification primer: TCAGTGCAGTCAACATGTCGAGTTTCGTGCCGAATAGCACAGAACTGCATTAAG, reverse amplification primer: GCCATTTTTAAGCCTGCTTTTTTGTACAAACTTGTATTTTTATGGGTTTTGGTAG). SDHC1::Mac was amplified from plasmid DNA pBB38 (forward amplification primer: ACAAGTTTGTACAAAAAAGCAGGCTTAAAAATGGCTGCGTTCTTGCTGAGAC, reverse amplification primer: GGATCCTCCTCCTCCAGATCCTCCTCCACCTCGGGCGCCGTCGTCCTCGCCGATC). mKate was amplified from plasmid DNA pAP088 (forward amplification primer: cccgaGGTGGAGGAGGATCTGGAGGAGGAGGATCCATGGTTTCCGAGTTGATCAAGG, reverse amplification primer: TTAACGATGTCCGAGCTTGGATGGGAGATCACAATATC). These PCR fragments amplified with unique homology regions, the first and fourth with homology to the genomic cut site, were microinjected into C. elegans hermaphrodite gonads with purified Cas9 protein and crRNA (GTCCGCGTTTGCTCTTTATT, DNA target) to achieve transgene construction into the genome of progeny such that gene promoters were followed by SDHC1::Mac::mKate::3′ UTR when integrated into the genome. Transgenic lines generated by mmCRISPi were outcrossed to the wild‐type strain at least four times.
2.2. C. elegans strains growth and maintenance
Animals were maintained at 20°C on nematode growth medium (NGM) seeded with OP50 E coli. 36 All‐trans‐retinal (ATR) was added to OP50 used for seeding NGM plates for a final concentration of 100 μM where indicated, as previously described. 22 Day 1 adult hermaphrodite animals were used for all experiments, synchronized by egg lay. Gravid adults were allowed to lay eggs for 1‐2 hours and then removed from plates. The resulting synchronized populations were used for experiments at day 1 of adulthood. Transgenic strains were generated by plasmid DNA microinjection as described, 37 and the mmCRISPi method 34 as described above. For a complete strain list, see Table S1.
2.3. Fluorescence microscopy
Images were obtained using an FV1000 Olympus laser scanning confocal microscope using a 60 × oil objective (Olympus, NA 1.42), 561 nm diode laser illumination for red fluorescence and 488 nm for green fluorescence. Where indicated, animals were stained with 12 μM MitoTracker Green FM (Thermo Fisher Scientific, Waltham, MA) diluted in DMSO into the OP50 food for 20 hours (DMSO < 0.02% final). Line scan pixel intensity was performed using ImageJ software. Fluorescent determination of mtOFF localization was performed as previously reported. 22 , 38 , 39 Briefly, cross‐section intensity plots of mitochondrial fluorescence (coexpressing either mtOFF::mKate and GFP, or mtOFF animals stained with MitoTracker) were smoothed by three‐point moving averages and then normalized to maximum intensity. Distance between inflection points (defined as a threshold of 10% increase in pixel intensity from the previous point, in the direction from the outer border toward the middle of the mitochondrion) was measured in pixels and converted to μm.
2.4. Mitochondria isolation
C. elegans mitochondria were isolated from day 1 adult animals using differential centrifugation as previously described. 22 , 40 Briefly, fed animals from 3 to 5 15‐cm culture plates (~1 million animals) were transferred into 50 mL of M9 media (22 mM KH2PO4, 42 mM Na2HPO4, 86 mM NaCl, 1 mM MgSO4, pH 7) in a conical tube and settled by gravity on ice. Animals were rinsed with ice‐cold M9 twice, then once with ice‐cold mitochondrial isolation media (220 mM mannitol, 70 mM sucrose, 5 mM MOPS, 2 mM EGTA, pH 7.4) with 0.04% BSA. After again settling by gravity, the supernatant was removed, and worms were transferred onto ~2 g of pure sea sand per 1 mL of animals in an ice‐cold mortar. Animals were ground with an ice‐cold pestle for 1 minutes and extracted from the sand using mitochondrial isolation media and transferred to a 10‐mL conical tube. The samples were then homogenized in an ice‐cold glass Dounce homogenizer with 40 strokes. The homogenate was centrifuged at 600 g for 5 minutes, then the supernatant was transferred to a new tube and centrifuged at 700 g for 10 minutes. The second pellet was resuspended in 1 mL of mitochondrial isolation media without BSA in a 1.5 mL tube and centrifuged at 7000 g for 5 minutes. The final pellet was resuspended in 50 μL of mitochondrial isolation media without BSA. Protein was quantified using the Folin‐phenol method.
2.5. Light sources for mtOFF activation
Illumination sources were a 580 nm Quantum SpectraLife LED Hybrid lamp by Quantum Devices, Barneveld WI (abbreviated Quantum LED in the text), a 540‐600 nm GYX module, X‐Cite LED1 by Excelitas, Waltham MA, (abbreviated XCite LED), and a 540‐580 nm excitation filter MVX10 Fluorescence MacroZoom dissecting microscope by Olympus (abbreviated MVX) powered by an X‐Cite 220 V mercury bulb by Excelitas. Light intensities are indicated for each experimental condition and were determined with a calibrated thermopile detector (818P‐010‐12, Newport Corporation, Irvine, CA) and optical power meter (1916‐R, Newport Corporation).
2.6. Immunoblotting
Fed adult animals were harvested in M9 media after 4‐hour exposure to 1 Hz light (Quantum LED, 0.02 mW/mm2). Biological replicates were individual plates for each experimental condition, each repeated four times. Animals were centrifuged at 1000 g for 1 minutes and ground by plastic pestle disruption in lysis buffer (20 mM Tris‐HCl, 100 mM NaCl, 1 mM EDTA, 1 mM DTT, 10% glycerol, 0.1% SDS, pH 7.6, 1 × Halt protease inhibitor cocktail, Thermo78429). Samples were then diluted 1:1 in sample loading buffer (100 mM Tris‐HCl, 10% glycerol, 10% SDS, 0.2% w/v bromophenol blue, 2% β‐mercaptoethanol). Samples were heated at 95°C for 5 minutes, and 12.5 μg of protein was loaded in each lane of a 7.5% polyacrylamide gel for separation by SDS‐PAGE. Protein was transferred to nitrocellulose membranes, blocked using 5% non‐fat milk/TBST (50 mM Tris, 150 mM NaCl, 0.05% Tween 20, pH 8.0) for 1 hour at room temperature, and incubated at 4°C in primary antibodies diluted 1:1,000 in 5% bovine serum albumin. Membranes were washed in TBST and incubated in horseradish peroxidase‐conjugated secondary antibodies for 1 hour at room temperature. Antibodies used: 1:2000 anti‐Actin (Abcam #ab14128), 1:10 000 anti‐phospho‐AMPKα Rabbit (Cell Signaling, #2535), 1:2000 anti‐rabbit IgG (Cell Signaling #7074S), and anti‐mouse IgG (Thermo Scientific #32430). Detected proteins were visualized by chemiluminescence (ChemiDoc, Bio‐Rad) using ECL (Clarity Western ECL Substrate, Bio‐Rad). Densitometry was performed using ImageJ software.
2.7. Mitochondrial membrane potential measurement
0.5 mg/mL of isolated mitochondria were stirred in mitochondrial respiration buffer (MRB: 120 mM KCl, 25 mM sucrose, 5 mM MgCl2, 5 mM KH2PO4, 1 mM EGTA, 10 mM HEPES, 1 mg/mL of FF‐BSA, pH 7.35) at 25°C with 2 μM rotenone and 5 mM succinate. 20 nM tetramethylrhodamine ethyl ester (TMRE, Thermo Fisher, T669) was added to observe mitochondrial membrane potential in non‐quench mode, where TMRE accumulates in the matrix and fluorescence is high in the presence of mitochondrial membrane potential. Upon the addition of the protonophore FCCP, TMRE exits mitochondria and fluorescence decreases. TMRE signal was measured by Cary Eclipse Fluorescence Spectrophotometer (Agilent Technologies) using a 335‐620 nm excitation filter and a 550‐1100 nm emission. Illumination was continuous throughout all measurements (0.39 mW/mm2 XCite LED) with increasing light dose (fluence, J/cm2). 2 μM FCCP was added to completely depolarize mitochondria and observe minimum fluorescence. Data are normalized to maximum succinate‐fueled fluorescence (F/Fmax).
2.8. Mitochondrial matrix pH measurement
BCECF‐AM (Thermo Fisher, B1170), a ratiometric pH indicator, was used to measure pH change in the mitochondrial matrix 22 , 41 , 42 in response to mtOFF activation. Isolated mitochondria (~200 μL) were incubated with 50 μM BCECF‐AM for 10 minutes at room temperature. Mitochondria were pelleted at 7000 g for 5 minutes at 4°C, isolation media was replaced and mitochondria were pelleted again to remove residual BCECF‐AM. Mitochondria were then assayed as described in the mitochondrial membrane potential measurements. 440 and 490 nm excitation wavelengths were used to measure 545 nm emission fluorescence using a Cary Eclipse Fluorescence Spectrophotometer (Agilent Technologies). Fluorescence ratio at 545 nm of 490/440 nm excitation wavelengths is presented to show pH changes in the mitochondrial matrix. Light treatment was 0.39 mW/mm2 (XCite LED), and 2 μM FCCP was used at the end of each trace to establish a minimum signal. Change in the ratio (∆BCECF ratio) value is presented comparing before and after the illumination of mtOFF.
2.9. C. elegans O2 consumption
Whole animal O2 consumption was recorded using a Clark‐type O2 electrode (S1 electrode disc, DW2/2 electrode chamber, and Oxy‐Lab control unit, Hansatech Instruments, Norfolk UK). Adult animals were collected in M9 and pelleted by centrifugation. Animals were then rinsed in M9 and added to the chamber in 0.5 mL of continuously stirred M9. Continuous light exposure (XCite LED) was 0.39 mW/mm2 throughout baseline measurement where indicated. 160 µM final concentration FCCP was added to induce maximal respiration, and 40 mM final concentration sodium azide was added to inhibit mitochondrial respiration. O2 consumption rates (baseline, maximal, and inhibited) were measured for 10 minutes or until stable. Animals were collected after measurement for protein quantification by the Folin‐phenol method. 43
2.10. ATP measurements
Whole animals were used for ATP quantification by luciferase bioluminescence. Adult animals on OP50 seeded plates were exposed to 4 hours of 1 Hz light (Quantum LED, 0.02 mW/mm2), and then collected in M9 media in 1.5 mL tubes. Samples were quickly centrifuged to pellet animals and supernatant was removed to leave pelleted animals in 100 μL of M9. Samples were freeze‐cracked three times in liquid nitrogen and protein concentration was measured using the Folin‐phenol method. Samples were then boiled at 100°C for 15 minutes, then placed on ice for 5 minutes. Samples were centrifuged at 14.8 g for 10 minutes at 4°C. An ATP determination kit was used according to the manufacturer's instructions to measure ATP levels. (Invitrogen Molecular Probes, A22066). Fold change in relative ATP levels are presented after normalization to either – or + ATR baseline levels without light.
2.11. Whole animal fat measurement
Synchronized day 1 adults were collected in M9 and pelleted by centrifugation. Animals were then rinsed in M9 and added to a glass 4‐walled cuvette containing 0.5 mL of M9. Animals were illuminated with 10 minutes of continuous light exposure (XCite LED, 0.39 mW/mm2) as described for O2 consumption experiments (see C. elegans O2 consumption section). Oil Red O (StatLab, McKinney, TX) staining was performed as described in previous protocols. 44 , 45 Briefly, Oil Red O product was diluted 3:2 in isopropanol, equilibrated for 2 days, and then filtered (0.4 μm). Immediately after light treatment, animals were dehydrated in 40% isopropanol/PBST (137 mM NaCl, 2.7 mM KCl, 10 mM Na2HPO4, 1.8 mM KH2PO4, Tween 20 0.1%) for 3 minutes. Animals were pelleted by centrifugation and the supernatant was removed. Animals were incubated with 600 μL of filtered Oil Red O for 2 hours at room temperature. Animals were then centrifuged, supernatant removed, and washed in PBST for 30 minutes. Animals were centrifuged and media was replaced with PBST for imaging. Animals were photographed using an MVX10 MacroZoom dissecting microscope by Olympus, and whole‐animal Oil Red O density was quantified using ImageJ.
2.12. Locomotion measurement
The number of animal body bends in 15 seconds was scored on and off of OP50 food to assess locomotion 46 (n = 30‐60 animals scored on at least 2 separate days). Change in the direction of motion of the posterior pharyngeal bulb was counted as one body bend. 47 AMPK inhibition was achieved by 24‐hour exposure to 50 μM final concentration of compound C in the NGM plates. Where indicated, light treatment was continuous throughout body bend measurements (MVX, 0.265 mW/mm2).
2.13. Hypoxia exposure
A hypoxic chamber (Coy Laboratory Products, 5%/95% H2/N2 gas, palladium catalyst) was used at 26°C with 15‐50 animals per plate for hypoxia experiments. O2 concentration was monitored and always <0.01%. 1 Hz light exposure (Quantum LED, 0.02 mW/mm2) was applied for 4, 20 hours before hypoxia exposure based on a time window identified for protective signaling to occur. 22 18.5‐hour hypoxic exposure was used to kill at least 50% of animals. Twenty‐four hours after hypoxia exposure moving animals or animals that moved in response to a light touch with an eyelash were scored as alive. Animals supplemented with ATR laid eggs onto plates without ATR that were subsequently used as adults in hypoxia experiments to minimize the potential effects of ATR supplementation (Figure S4). 22 Data are presented as protection (%), where baseline survival was subtracted from the survival of animals exposed to light to show potential damaging or protective effects as negative or positive values, respectively.
2.14. Oxidative stress resistance
Seeded plates were supplemented with 200 mM paraquat (final concentration) 24 hours before the experiments. 10‐15 synchronized day 1 adult animals were moved onto paraquat plates. Control plates were kept in the dark, and experimental plates were exposed to light (Quantum LED, 1 Hz, 0.02 mW/mm2) for the duration of the experiment. Animals that were moving or those that moved in response to a light touch to the head were scored as alive. Survival was scored every hour for 7 hours.
2.15. Statistics
Using GraphPad Prism (v7), we performed two‐tailed unpaired t tests and one‐ or two‐way ANOVA with post hoc tests where appropriate. For hypoxia experiments, we used two‐tailed paired t tests where samples were paired by hypoxia exposure. Throughout, n values are biological replicates: independent animal populations. Technical replicates are from one biological replicate exposed separately to experimental interventions. See figure legends for detailed statistical information.
3. RESULTS
3.1. Mitochondria‐OFF (mtOFF) is expressed in C. elegans mitochondria
Recently, light‐activated channels called channelrhodopsin 2 (ChR2) have been directed to mitochondria to dissipate the protonmotive force (PMF) in response to light. 23 , 48 This technique allows light‐specific dissipation of PMF and has been validated in different metabolic contexts to impact broad cellular signaling activities. 23 , 48 We extend this approach using the light‐activated proton pump from mitochondria‐ON (mtON) in our previous work, 22 here oriented to dissipate the PMF in whole animals. Using a light‐activated proton pump required yellow‐green light and avoided the use of blue light that is required for ChR2. Blue light can be damaging to biological samples, 49 especially mitochondria, which contain light‐sensitive redox‐active flavins that could alter oxidative stress. 50 , 51 Proton selectivity 52 also avoids caveats of ChR2 moving other cellular ions such as potassium and calcium, 53 , 54 both ions that are important for other mitochondrial and cellular functions. 55 , 56 Using a ubiquitously expressed gene promoter, we expressed the light‐activated proton pump, Mac, 52 in C. elegans mitochondria. Our construct was oriented to pump protons from the mitochondrial intermembrane space (IMS) into the matrix to dissipate the PMF (Figure 1A). We called this construct mitochondria‐OFF, or mtOFF, due to its ability to “turn off” mitochondrial function through the PMF in response to light, as validated here and by other studies using ChR2. 23 , 48 The mitochondrial targeting sequence (MTS) and part of the coding sequence of the SDHC1 protein were used to direct and orient mitochondrial expression of Mac. This SDHC1::Mac construct is the functional unit mtOFF (Figure 1A). We then used C terminal fusion to the red fluorescent protein mKate for visualization in living animals. Using CRISPR/Cas9 genome editing we integrated a single copy of the mtOFF construct into the C. elegans genome under the control of a ubiquitous promoter (eft‐3p) using the mmCRISPi technique 34 to avoid over‐expression artifacts. Fluorescence indicated mitochondrial expression when observed by confocal microscopy in animals stained with MitoTracker Green (Figure 1B). Further, in single mitochondria of living animals, C terminal mKate fluorescence was distant from MitoTracker Green fluorescence in the mitochondrial matrix, but overlapped with IMS targeted GFP (Figure S1A‐C). In line with our previous work, 22 these data suggest the orientation of the proton pump was as predicted (Figure 1A) indicated by the distance between red and green fluorescence in each case (Figure S1D).
3.2. mtOFF decreases mitochondrial PMF in response to light
Using mtON, we previously showed that a proton pump oriented oppositely from our approach here was able to generate a PMF independent of ETC function. 22 Therefore, a pump inserted into the membrane in the opposite orientation is predicted to decrease the PMF. Based on the expected topology (Figure 1A) and the localization of mKate (Figure S1A‐D), we asked if mtOFF could decrease the PMF. We tested this by measuring the PMF in response to mtOFF activation in two independent assays. Optogenetic proteins such as the Mac component of mtOFF require a cofactor, all‐trans‐retinal (ATR), for photocurrents to occur. 22 , 35 C. elegans require ATR supplementation due to endogenous absence in the organism. 57 Therefore, each of our experiments controlled for ATR supplementation, as well as light exposure to control for any confounding effects of light or ATR. Only light exposure and the presence of ATR allow the mtOFF function. 22 , 57 Under these conditions, mtOFF decreased the PMF in response to light when observed through both components of the gradient, the membrane potential (ΔΨm), and the pH gradient (ΔpH) (Figure S2A). Isolated mitochondria loaded with the ΔΨm fluorescent indicator tetramethylrhodamine ethyl ester (TMRE) were incubated with succinate to fuel respiration and to maintain the PMF. Upon light exposure, ΔΨm decreased significantly (Figure 1C) and light‐dose dependently (Figure S2B). The ΔpH was assessed by observing BCECF fluorescence in isolated mitochondria. BCECF‐AM is a ratiometric pH indicator that can be loaded into isolated mitochondria 41 , 42 to determine changes in matrix pH. When provided succinate to maintain PMF, mtOFF activation resulted in significant, reversible matrix pH decrease (Figures 1D, S2C), indicating decreased ΔpH. These data independently demonstrate that the mtOFF activation dissipated the PMF through both its components, ΔΨm and ΔpH.
Respiratory control is a phenomenon of increased ETC activity in response to dissipated PMF. 58 , 59 The ETC increases activity (and resulting O2 consumption) in an attempt to maintain PMF. We, therefore, measured whole‐animal O2 consumption rates and ATP levels to assess the consequences of dissipated PMF. mtOFF activation resulted in around a 70% increase in respiration compared to control conditions (Figures 1E, S2D), similar to results obtained in a cell model with mitochondria‐targeted ChR2. 48
To test a whole animal measure of nutrient metabolism, we asked whether mtOFF acutely affected stored fat. mtOFF activation did not affect fat stores in whole animals (Figure S2E). The short timescale of mtOFF activation was likely not sufficient to significantly deplete stored lipids. This result suggests that the effects of mtOFF are through acute mitochondrial PMF dissipation, and that mtOFF is not affecting bulk metabolism in the short term, as expected. We then measured relative ATP levels to assess if mtOFF was, indeed, interrupting respiratory control in vivo. Whole animal ATP levels were decreased after mtOFF activation (Figure 1F), indicating that the mtOFF‐mediated PMF dissipation decreased cellular energetics. Together, these results indicated that mtOFF caused mitochondrial uncoupling, the phenomenon of acutely increased respiration, and lost ATP production because of dissipated PMF. Therefore, mtOFF functioned to decrease the PMF to alter the internal metabolic state of organisms.
3.3. mtOFF modulates energy‐sensing behavior through neuronal AMPK
To understand how PMF dissipation affects metabolism and physiology in living animals, we used C. elegans expressing mtOFF. As we have previously shown, AMP‐activated protein kinase (AMPK) activity is altered downstream of PMF changes and in signaling that affects C. elegans behavior. 22 C. elegans respond to food availability and their internal metabolic state (fed vs starved) 60 , 61 through AMPK by increasing or decreasing their locomotion speed. 46 , 47 In the presence of food, animals will move slowly to stay in its presence, and in the absence of food, animals will increase their movement speed (Figure 2A,B). This behavior is blunted in animals lacking AMPK activity (aak‐2 mutant animals 22 , 32 , 62 ) (Figure 2D). Previously, we found that increasing the PMF silenced AMPK signaling under starvation conditions, and could slow animal locomotion. 22 Conversely, mtOFF activation caused increased AMPK phosphorylation and therefore activation (Figures2C,D, S6), causing increased locomotion under fed conditions (Figure 2E,F). mtOFF was able to create an energy demand resulting in increased locomotion when animals were still in the presence of food. This optogenetic effect was abolished when AMPK was inhibited with compound C. Since compound C can have non‐specific or off‐target effects we chose to proceed using the genetic inhibition of AMPK. The mtOFF‐mediated increase in locomotion was blocked in AMPK mutant animals expressing mtOFF (Figure 2F). These data suggest that AMPK activity is regulated downstream of mitochondrial function to regulate metabolic demand, and they show that mtOFF can control animal behavior through the PMF and resultant energy‐sensing signaling. Since mtOFF increases locomotion speed, we next activated mtOFF in the absence of food to test if there was an additive effect on the high locomotion rate off of food. We found a small but statistically significant decrease in locomotion (Figure S3), though not to the same degree as the fed rate of locomotion (Figure 2F).
FIGURE 2.
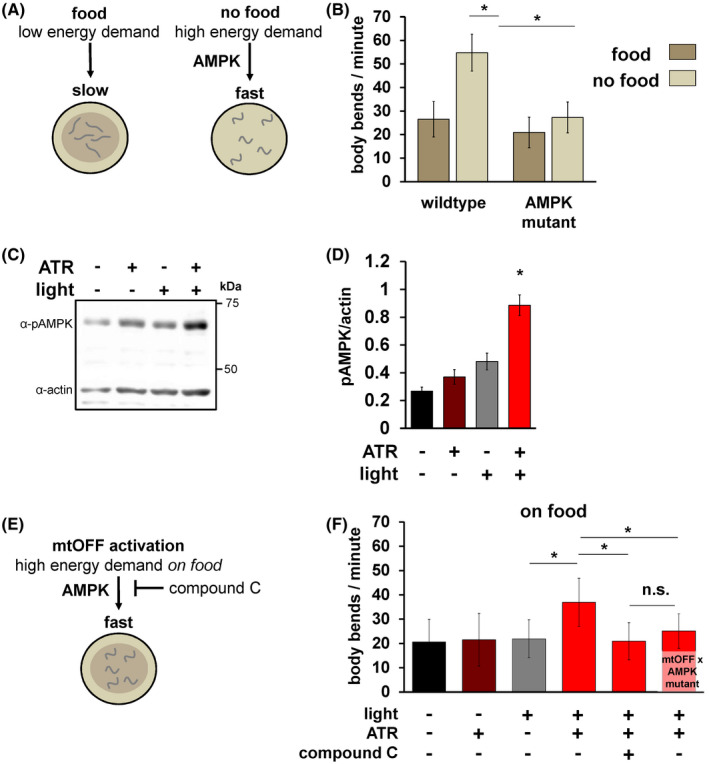
mtOFF modulates energy‐sensing behavior through AMPK. A, Schematic showing locomotion differences in C. elegans under both fed (left) and starved (right) conditions. Removal from food results in increased locomotion, mediated by AMPK signaling. This output is used in this study to validate functional AMPK signaling. B, Locomotion was scored by counting body bends per minute. Animals were scored either on food or immediately after being transferred off of food. C. elegans AMPK is encoded by the aak‐2 gene. The non‐functional aak‐2(ok524) mutant strain was used for AMPK mutant animals. One‐way ANOVA with Tukey's test for multiple comparisons was performed, wild type on food vs wild‐type off of food *P < .0001, wild‐type off of food vs AMPK mutant off of food *P < .0001,. Data are means ± standard deviation, n = 30‐60 animals each condition from at least two experimental days. C, Immunoblot against phosphorylated (active) AMPK (pAMPK, top bands, 62 kDa) and actin (bottom bands, 43 kDa) from whole animal lysate on the same blot shows increased phosphorylation level under conditions of activated mtOFF. D, Quantification of pAMPK/actin densitometry shows increased pAMPK in response to mtOFF activation. pAMPK/actin is used to measure activated AMPK as there is no validated total AMPK antibody in C. elegans. One‐way ANOVA with Tukey's test for multiple comparisons was performed, ‐ATR ‐light vs + ATR +light *P = .0001, +ATR ‐light vs + ATR +light *P = .0006, ‐ATR + light vs + ATR +light *P = .0043. Data are means ± SEM, n = 4 independent blots from one plate of worms for each condition per replicate, with at least 1000 animals per plate. E, Schematic showing effects of mtOFF activation on locomotion. mtOFF is expected to create an energy demand through PMF dissipation that will increase locomotion, mediated by AMPK signaling. F, Body bends were scored, and illumination was throughout measurement where indicated. Animals were exposed to 50 μM compound C for 24 hours where indicated. One‐way ANOVA with Tukey's test for multiple comparisons was performed, −ATR + light vs + ATR +light *P < .0001, +ATR + light vs + ATR +light + compound C *P < .0001, +ATR + light vs mtOFF × AMPK mutant + ATR +light + compound C *P < .0001. n.s. is not significant, P = .3999. Data are means ± standard deviation, n = 30‐60 animals each condition from at least two experimental days
AMPK signaling in neurons alone is sufficient for driving increased locomotion in response to energy demand. 32 Therefore, we tested whether mtOFF could trigger increased locomotion with AMPK signaling only functional in neurons to signal perceived metabolic demand. Using a pan‐neuronal gene promoter, we rescued neuronal AMPK expression in AMPK mutant animals as previously described 32 and confirmed its sufficiency for restoring increased locomotion upon starvation. The AMPK mutant strain alone and the mtOFF‐AMPK mutant strain in the absence of food appeared to have baseline differences; however, we did not compare these effects directly. Regardless, AMPK mutant animals expressing mtOFF did not respond to starvation by increasing locomotion to the same degree as wild type, unless AMPK was rescued in neurons (Figure 3A). Under fed conditions, mtOFF activation increased locomotion in AMPK mutant animals with rescued neuronal AMPK (Figure 3B), similar to our results with mtOFF in a wild‐type background. This confirmed that neuronal AMPK alone was sufficient to respond to dissipated PMF. Following this result in neurons, we asked whether tissue‐restricted mtOFF activity could have similar effects on locomotion. We tested this hypothesis using tissue‐specific gene promoters to drive mtOFF expression separately in neurons and intestine (Figure 3C). We chose to also test the intestinal expression of mtOFF to rule out the possibility of signaling coming from intestine, the organ that may sense energy availability through its nutrient‐absorbing function, creating the internal metabolic state (fed vs starved). Using a pan‐neuronal gene promoter (rab‐3p) and an intestinal gene promoter (vha‐6p) to drive mtOFF expression, we found that neuronal mtOFF activation was sufficient to trigger increased locomotion (Figure 3D), but intestinal mtOFF activation was not (Figure 3E). In these experiments, light exposure alone resulted in small increases in locomotion; however, under conditions of active mtOFF (light plus ATR) neuronal mtOFF increased locomotion compared to all controls. These results indicate that mitochondrial function and energy sensing through AMPK are tightly linked and especially important in neurons. This tight spatial control of mitochondria and subsequent control of behavior shows that communication throughout the cell can be traced back to PMF changes in mitochondria.
FIGURE 3.
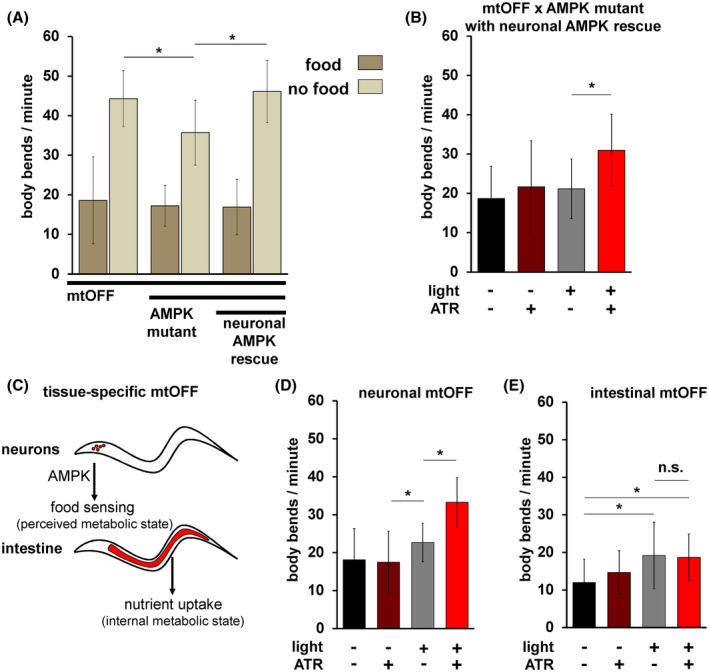
mtOFF triggers neuronal AMPK to control locomotion. A, Locomotion was scored by counting body bends per minute. Animals were scored either on food or immediately after being transferred off of food. All animals are expressing mtOFF, the center pair of bars are AMPK mutant animals, and the last pair of bars are AMPK mutant animals with functional AMPK re‐expressed in neurons alone. AMPK mutant animals have a blunted response to starvation, and neuronal AMPK is sufficient to restore the response. One‐way ANOVA with Tukey's test for multiple comparisons was performed, mtOFF off of food vs mtOFF × AMPK mutant off of food *P < .0001, mtOFF x AMPK mutant off of food vs neuronal AMPK rescue *P < .0001. n.s. is not significant, P = .9910. Data are means ± standard deviation, n = 30‐60 animals each condition. Data were collected on at least two different experimental days for each condition. B, Locomotion in AMPK mutant animals expressing mtOFF with functional AMPK expressed only in neurons. Illumination was throughout measurement where indicated. mtOFF activation increased locomotion with functional AMPK expressed in neurons. One‐way ANOVA with Tukey's test for multiple comparisons, ‐ATR + light vs + ATR +light, *P < .0001. Data are means ± standard deviation, n = 30‐60 animals each condition from at least two experimental days. C, Schematic showing tissue‐specific mtOFF expression in neurons alone or in intestine alone. Neurons are responsible for locomotion response to food sensation in an AMPK dependent manner. mtOFF was expressed in neurons to test if PMF loss in neurons alone could mediate an increased locomotion response. Intestine is the organ that absorbs nutrients, and mtOFF was expressed here to rule out the role of intestinal control of locomotion in response to PMF loss. D, Locomotion in animals expressing mtOFF only in neurons. Illumination was throughout body bends measurement where indicated. mtOFF activation in neurons increased locomotion compared to controls. Light alone also increased locomotion. One‐way ANOVA with Tukey's test for multiple comparisons was performed, ‐ATR vs ‐ATR + light *P = .0251, +ATR ‐light vs ‐ATR + light *P < .0083, ‐ATR + light vs + ATR +light *P < .0001. Data are means ± standard deviation, n = 30‐60 animals each condition from at least two experimental days. E, Locomotion in animals expressing mtOFF only in the intestine. Illumination was throughout body bends measurement where indicated. mtOFF activation in the intestine did not increase locomotion compared to controls. Light alone also increased locomotion, similar to panel D. One‐way ANOVA with Tukey's test for multiple comparisons was performed, ‐ATR ‐light vs ‐ATR + light *P = .0007, ‐ATR ‐light vs + ATR +light *P = .0019. n.s. is not significant, P = .9910. Data are means ± standard deviation, n = 30‐60 animals each condition from at least two experimental days
3.4. mtOFF protects against hypoxia through neuronal AMPK
Based on the link between energy availability and stress resistance, we next tested how changes in the mitochondrial function elicit stress resistance in vivo. An animal's perceived or internal energetic state can influence responses to hypoxia through many mechanisms, one example being AMPK signaling in fed vs starved nutritional states. 29 AMPK activity in neurons alone is a model of perceived metabolic state to elicit a fast response in whole C. elegans. 32 Low nutrition or starvation causes stress resistance and specifically hypoxia resistance. 63 , 64 It follows that AMPK is required in many models of hypoxia resistance 29 , 65 , 66 , 67 as AMPK is a sensor of metabolic state. Because our optogenetic approach allows for spatiotemporal control of mitochondrial function, we tested the ability of prophylactic PMF dissipation to protect against hypoxia (Figure 4A) and asked if neuronal AMPK could be specifically involved. Chronic PMF dissipation through pharmacology and genetics protects against hypoxia 24 , 25 , 26 , 27 , 28 ; however, PMF dissipation may only be required before hypoxia exposure for some mechanisms of resistance. 22 Therefore, we tested if mtOFF activation could protect C. elegans against impending hypoxia. Consistent with mammalian cell models, mtOFF activation to dissipate the PMF was also protective in our C. elegans model (Figure 4B) when we measured the percent of increased survival after hypoxia and light treatment, either with or without ATR. PMF dissipation during oxidative stress is protective in many models. 68 Therefore, to expand the physiologic implications of mtOFF activity, we tested if chronic mtOFF activation during oxidative stress could improve survival. Paraquat causes oxidative damage and death in C. elegans, 69 mimicking oxidative stress that occurs upon reoxygenation after hypoxia. When exposed to a toxic dose of paraquat, mtOFF activation resulted in increased survival over time, as expected (Figure S5). This result shows how mtOFF activity impacts a general physiologic paradigm of oxidant mediated damage at the whole animal level.
FIGURE 4.
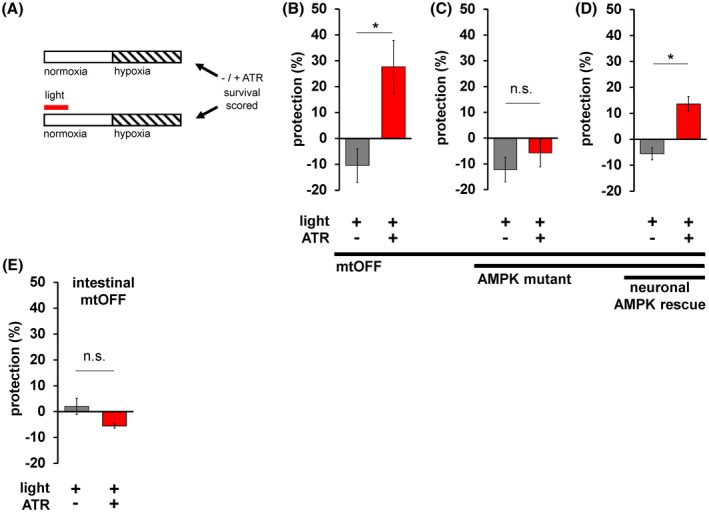
mtOFF protects against hypoxia through neuronal AMPK. A, Schematic showing protocol to activate mtOFF before hypoxia exposure to test the prophylactic effects of PMF dissipation on hypoxia resistance. Control conditions with and without ATR were either treated with light or left in the dark before hypoxia exposure. Normoxia is denoted with an open bar, and hypoxia is denoted by a striped bar. Timeline not drawn to scale (see methods). To assess protection against hypoxia, the percent survival under ‐light conditions was subtracted from percent survival under + light conditions with and without ATR (top bar subtracted from the bottom bar). The resulting protection percent (%) would be negative for damaging interventions after hypoxia exposure, and positive for interventions protective against hypoxia. Experiments are paired by concurrent hypoxia exposure. B, mtOFF activation prior to hypoxia conferred protection. Two‐tailed paired t test, *P = .0082. Data are means ± SEM, n = 5, where one n is an average of three technical replicates of plates containing 15‐50 animals. C, AMPK mutant animals expressing mtOFF were not protected against hypoxia, suggesting the protection observed in panel B requires AMPK signaling. Two‐tailed paired t test was performed, n.s. is not significant, P = .176. Data are means ± SEM, n = 4‐5, where one n is an average of three technical replicates of plates containing 15‐50 animals. D, AMPK mutant animals expressing mtOFF with functional AMPK expressed in neurons alone conferred protection against hypoxia, suggesting AMPK activity in neurons alone is sufficient for the hypoxia resistance triggered by decreased PMF. Two‐tailed paired t test was performed, *P = .0069. Data are means ± SEM, n = 3, where one n is an average of three technical replicates of plates containing 15‐50 animals. E, Intestinal mtOFF activation prior to hypoxia conferred protection. Two‐tailed paired t test was performed, n.s. is not significant, P = .645. Data are means ± SEM, n = 3, where one n is an average of three technical replicates of plates containing 15‐50 animals
In addition, AMPK was required for prophylactic hypoxia protection, as mtOFF activation in AMPK mutant animals was not protective (Figure 4C). We then tested if neuron‐specific AMPK rescue by extrachromosomal array expression could restore protection, and found that the mtOFF activation was again protective (Figure 4D). The apparent partial rescue may be attributed to the heterologous promoter expression (rab‐3p) of AMPK. These data indicated that neuronal AMPK activity was sufficient for hypoxia resistance. This supports a model in which perceived metabolic state (through neuronal AMPK) can act to trigger organism‐wide protection.
In lifespan studies, and in the context of mitochondrial proteostatic stress, intestinal mitochondria mediate robust stress resistance 70 which can act in the absence of neuronal mitochondrial dysfunction. 71 We, therefore, sought to test if direct intestinal PMF dissipation could result in resistance against hypoxia. In animals expressing mtOFF only in the intestine, mtOFF activation did not confer protection against hypoxia (Figure 4E). These data show that acute PMF loss in the intestine specifically is not sufficient for hypoxia resistance. While proteostatic maintenance in mitochondria mediates stress resistance within the intestine, 14 , 70 , 71 direct PMF changes do not play a role in this tissue. This result suggests that in the absence of perceived energy crisis through neuronal AMPK activity, there is also the absence of organism‐wide stress resistance. In summary, our data suggest that PMF dissipation is a trigger for AMPK‐mediated hypoxia resistance and that neuronal AMPK is a driver of whole organism protection.
4. DISCUSSION
In line with what is known about trans‐tissue signaling in mitochondrial stress resistance, 14 , 70 , 71 the neuronal activation of AMPK conferred stress resistance (Figure 4B‐D). We found that direct PMF loss in the the intestine is not sufficient for protection (Figure 4E). In other words, intestine‐triggered protection requires an external signal; acute PMF loss in intestine is not sufficient. This is consistent with studies on the proteostatic mechanisms of hypoxia resistance. 13 , 14 , 70 , 71 Activation of mitochondrial unfolded protein responses in the intestine drives protection, not necessarily acute mitochondrial PMF loss in the intestine. Hypoxia‐protective unfolded protein responses in the intestine require specific neuronal signals, 14 , 71 and here we show that neuronal AMPK signaling is also sufficient for organismal stress resistance (Figure 4B‐D). We also show that the neuronal AMPK signaling can be activated directly by PMF dissipation in living organisms.
AMPK activity controls hypoxia resistance differently depending on nutritional quality, 29 linking energy sensing with hypoxia resistance. AMPK activity in neurons is sufficient for behavioral responses to energy availability as well (Figure 3A) 32 ; we add to these findings by showing neuronal AMPK control of behavior can be achieved through PMF dissipation in neurons (Figure 3D). AMPK activity in neurons alone models animal perception of metabolic state and this signal alone can alter physiologic responses. 32 Our findings, therefore, suggest that mitochondrial energetics in neurons can result in these organismal responses as well, through AMPK. This again highlights the importance of neuronal signaling throughout organisms to respond to environmental stress.
It is well‐established that changes in mitochondrial function can signal throughout organisms to extend C. elegans lifespan. 70 In addition, neuronal AMPK mediates longevity in C. elegans and is interconnected with other metabolic pathways that affect mitochondrial morphology. 72 Our results complement each of these findings and suggest that the PMF may be the source change that leads to signaling downstream to affect physiology. We have shown that cellular energy sensing and responses to oxygen availability are both influenced by changes in the PMF. Together, our study and the data of others combine to say that fundamental changes in mitochondrial PMF trigger cellular signaling that can act throughout organisms to prepare for impending stress. This coordinated signaling likely occurs in a network of parallel and related pathways that fundamentally regulate and fine‐tune metabolism to adapt to environmental changes. One example of note may be through autophagy, which is controlled by AMPK signaling in some circumstances. 73 Mitochondrial uncoupling can induce autophagy and changes in mitochondrial morphology. 74 , 75 , 76 The mechanisms of mitochondrial fission and fusion downstream of dissipated PMF are under investigation in many contexts, and deeper understanding in these areas could further solidify the link between energy metabolism and AMPK‐mediated cell signaling.
Our approach to link energy sensing, hypoxia resistance, and mitochondrial function was precise in space and time due to the application of optogenetics. Restricting light activation of mtOFF to before hypoxia alone, conferred temporal control that allowed testing PMF dissipation as a preventive intervention. Expressing mtOFF tissue specifically conferred spatial control over mitochondrial function. We were able to isolate the PMF as an independent variable in a living organism to link neuronal AMPK signaling to both behavior changes and hypoxia resistance. We show these known signaling responses are linked through the PMF. This new link between phenomena demonstrates how mitochondria can integrate different aspects of cellular metabolism to signal adaptively, similar to our previous findings with mtON. 22 Changes in PMF have been correlated to different metabolic states and phenotypes, and here we move from correlation to causation through specific PMF control.
Using optogenetics to modulate PMF specifically has been recently applied in cellular models of disease to implicate other signaling pathways that are under mitochondrial PMF control, such as mitochondrial autophagy, 23 glucose‐stimulated ATP production in beta cells, 48 muscle contraction through calcium signaling, 48 and pathways of neurodegeneration. 77 These results show that cellular activities under diverse metabolic control can each be manipulated by upstream intervention at one point, the PMF. Our development of mtOFF applied this optogenetic control in animals to begin to understand the signaling abilities of mitochondria in vivo. Fundamentally, these studies suggest that targeting mitochondria directly could be a more powerful intervention than targeting single proteins or pathways therapeutically; targeting mitochondria directly may modulate many signaling pathways concurrently for more powerful physiologic results. Our data also suggest that simply altering perceived metabolic state (through neuronal AMPK) should be characterized in other stress‐resistance models. Overall, we show how mitochondrial PMF coordinates the stimuli of perceived energy availability and O2 levels, fundamental requirements for metazoan life, to prepare organisms to respond to stress.
CONFLICT OF INTEREST
The authors declare there are no competing interests to disclose.
AUTHOR CONTRIBUTIONS
BB and APW designed the research, BB performed the research, analyzed the data, and wrote the paper, AB performed the research, and TON performed the research and analyzed the data.
Supporting information
Fig S1‐S6
Table S1
ACKNOWLEDGMENTS
APW is supported by grants from the National Institutes of Health (R01 NS092558, R01 NS115906). BJB is supported by an American Heart Association Predoctoral Fellowship (18PRE33990054). We thank Dr Richard Roy (McGill University) for providing plasmid pMR729. We also thank the Mitochondrial Research & Innovation Group at the University of Rochester Medical Center for helpful discussions and guidance. Some strains were provided by the CGC, which is funded by the NIH Office of Research Infrastructure Programs (P40 OD010440).
Berry BJ, Baldzizhar A, Nieves TO, Wojtovich AP. Neuronal AMPK coordinates mitochondrial energy sensing and hypoxia resistance in C elegans . The FASEB Journal. 2020;34:16333–16347. 10.1096/fj.202001150RR
REFERENCES
- 1. To TL, Cuadros AM, Shah H, et al. A compendium of genetic modifiers of mitochondrial dysfunction reveals intra‐organelle buffering. Cell. 2019;179(1222–1238):e1217. [DOI] [PMC free article] [PubMed] [Google Scholar]
- 2. McElroy GS, Chandel NS. Mitochondria control acute and chronic responses to hypoxia. Exp Cell Res. 2017;356:217‐222. [DOI] [PMC free article] [PubMed] [Google Scholar]
- 3. Meisner H, Palmieri F, Quagliariello E. Effect of cations and protons on the kinetics of substrate uptake in rat liver mitochondria. Biochemistry. 1972;11:949‐955. [DOI] [PubMed] [Google Scholar]
- 4. Pfanner N, Geissler A. Versatility of the mitochondrial protein import machinery. Nat Rev Mol Cell Biol. 2001;2:339‐349. [DOI] [PubMed] [Google Scholar]
- 5. Lim Y, Rubio‐Pena K, Sobraske PJ, et al. Fndc‐1 contributes to paternal mitochondria elimination in C elegans . Dev Biol. 2019;454:15‐20. [DOI] [PMC free article] [PubMed] [Google Scholar]
- 6. Palikaras K, Lionaki E, Tavernarakis N. Mechanisms of mitophagy in cellular homeostasis, physiology and pathology. Nat Cell Biol. 2018;20:1013‐1022. [DOI] [PubMed] [Google Scholar]
- 7. Li PA, Hou X, Hao S. Mitochondrial biogenesis in neurodegeneration. J Neurosci Res. 2017;95:2025‐2029. [DOI] [PubMed] [Google Scholar]
- 8. Rolland SG, Schneid S, Schwarz M, et al. Compromised mitochondrial protein import acts as a signal for UPR(mt). Cell Rep. 2019;28(1659–1669):e1655. [DOI] [PubMed] [Google Scholar]
- 9. Tello D, Balsa E, Acosta‐Iborra B, et al. Induction of the mitochondrial NDUFA4L2 protein by HIF‐1alpha decreases oxygen consumption by inhibiting Complex I activity. Cell Metab. 2011;14:768‐779. [DOI] [PubMed] [Google Scholar]
- 10. Weinberg JM, Venkatachalam MA, Roeser NF, Nissim I. Mitochondrial dysfunction during hypoxia/reoxygenation and its correction by anaerobic metabolism of citric acid cycle intermediates. Proc Natl Acad Sci U S A. 2000;97:2826‐2831. [DOI] [PMC free article] [PubMed] [Google Scholar]
- 11. Yin S, Xue J, Sun H, et al. Quantitative evaluation of the mitochondrial proteomes of Drosophila melanogaster adapted to extreme oxygen conditions. PLoS One. 2013;8:e74011. [DOI] [PMC free article] [PubMed] [Google Scholar]
- 12. Kim JW, Tchernyshyov I, Semenza GL, Dang CV. HIF‐1‐mediated expression of pyruvate dehydrogenase kinase: a metabolic switch required for cellular adaptation to hypoxia. Cell Metab. 2006;3:177‐185. [DOI] [PubMed] [Google Scholar]
- 13. Kaufman DM, Crowder CM. Mitochondrial proteostatic collapse leads to hypoxic Injury. Curr Biol. 2015;25:2171‐2176. [DOI] [PMC free article] [PubMed] [Google Scholar]
- 14. Pena S, Sherman T, Brookes PS, Nehrke K. The mitochondrial unfolded protein response protects against anoxia in Caenorhabditis elegans . PLoS One. 2016;11:e0159989. [DOI] [PMC free article] [PubMed] [Google Scholar]
- 15. Onukwufor JO, Berry BJ, Wojtovich AP. Physiologic implications of reactive oxygen species production by mitochondrial complex i reverse electron transport. Antioxidants. 2019;8(8):285 10.3390/antiox8080285 [DOI] [PMC free article] [PubMed] [Google Scholar]
- 16. Chouchani ET, Pell VR, Gaude E, et al. Ischaemic accumulation of succinate controls reperfusion injury through mitochondrial ROS. Nature. 2014;515:431‐435. [DOI] [PMC free article] [PubMed] [Google Scholar]
- 17. Lambert AJ, Brand MD. Superoxide production by NADH:ubiquinone oxidoreductase (complex I) depends on the pH gradient across the mitochondrial inner membrane. Biochem J. 2004;382:511‐517. [DOI] [PMC free article] [PubMed] [Google Scholar]
- 18. Komlodi T, Geibl FF, Sassani M, Ambrus A, Tretter L. Membrane potential and delta pH dependency of reverse electron transport‐associated hydrogen peroxide production in brain and heart mitochondria. J Bioenerg Biomembr. 2018;50:355‐365. [DOI] [PMC free article] [PubMed] [Google Scholar]
- 19. Dufayet L, Gorgiard C, Vayssette F, Barbet JP, Hoizey G, Ludes B. Death of an apprentice bodybuilder following 2,4‐dinitrophenol and clenbuterol intake. Int J Legal Med. 2020;134(3):1003‐1006. 10.1007/s00414-020-02268-2 [DOI] [PubMed] [Google Scholar]
- 20. Goedeke L, Peng L, Montalvo‐Romeral V, et al. Controlled‐release mitochondrial protonophore (CRMP) reverses dyslipidemia and hepatic steatosis in dysmetabolic nonhuman primates. Sci Transl Med. 2019;11(512):eaay0284 10.1126/scitranslmed.aay0284 [DOI] [PMC free article] [PubMed] [Google Scholar]
- 21. Bleasdale EE, Thrower SN, Petroczi A. Would you use it with a seal of approval? Important attributes of 2,4‐dinitrophenol (2,4‐DNP) as a hypothetical pharmaceutical product. Front Psychiatry. 2018;9:124. [DOI] [PMC free article] [PubMed] [Google Scholar]
- 22. Berry BJ, Trewin AJ, Milliken AS, et al. Optogenetic control of mitochondrial protonmotive force to impact cellular stress resistance. EMBO Rep. 2020;e49113. [DOI] [PMC free article] [PubMed] [Google Scholar]
- 23. Ernst P, Xu N, Qu J, et al. Precisely control mitochondria with light to manipulate cell fate decision. Biophys J. 2019;117:631‐645. [DOI] [PMC free article] [PubMed] [Google Scholar]
- 24. Otani H. Reactive oxygen species as mediators of signal transduction in ischemic preconditioning. Antioxid Redox Signal. 2004;6:449‐469. [DOI] [PubMed] [Google Scholar]
- 25. Ozcan C, Palmeri M, Horvath TL, Russell KS, Russell RR 3rd. Role of uncoupling protein 3 in ischemia‐reperfusion injury, arrhythmias, and preconditioning. Am J Physiol Heart Circ Physiol. 2013;304:H1192‐1200. [DOI] [PMC free article] [PubMed] [Google Scholar]
- 26. Hoerter J, Gonzalez‐Barroso MD, Couplan E, et al. Mitochondrial uncoupling protein 1 expressed in the heart of transgenic mice protects against ischemic‐reperfusion damage. Circulation. 2004;110:528‐533. [DOI] [PubMed] [Google Scholar]
- 27. Sack MN. Mitochondrial depolarization and the role of uncoupling proteins in ischemia tolerance. Cardiovasc Res. 2006;72:210‐219. [DOI] [PubMed] [Google Scholar]
- 28. Korde AS, Pettigrew LC, Craddock SD, Maragos WF. The mitochondrial uncoupler 2,4‐dinitrophenol attenuates tissue damage and improves mitochondrial homeostasis following transient focal cerebral ischemia. J Neurochem. 2005;94:1676‐1684. [DOI] [PubMed] [Google Scholar]
- 29. LaRue BL, Padilla PA. Environmental and genetic preconditioning for long‐term anoxia responses requires AMPK in Caenorhabditis elegans. PLoS One. 2011;6:e16790. [DOI] [PMC free article] [PubMed] [Google Scholar]
- 30. Wang X, Yang L, Kang L, et al. Metformin attenuates myocardial ischemia‐reperfusion injury via up‐regulation of antioxidant enzymes. PLoS One. 2017;12:e0182777. [DOI] [PMC free article] [PubMed] [Google Scholar]
- 31. Kim AS, Miller EJ, Wright TM, et al. A small molecule AMPK activator protects the heart against ischemia‐reperfusion injury. J Mol Cell Cardiol. 2011;51:24‐32. [DOI] [PMC free article] [PubMed] [Google Scholar]
- 32. Ahmadi M, Roy R. AMPK acts as a molecular trigger to coordinate glutamatergic signals and adaptive behaviours during acute starvation. Elife. 2016;5 10.7554/eLife.16349 [DOI] [PMC free article] [PubMed] [Google Scholar]
- 33. Yurgel ME, Kakad P, Zandawala M, Nassel DR, Godenschwege TA, Keene AC. A single pair of leucokinin neurons are modulated by feeding state and regulate sleep‐metabolism interactions. PLoS Biol. 2019;17:e2006409. [DOI] [PMC free article] [PubMed] [Google Scholar]
- 34. Philip NS, Escobedo F, Bahr LL, Berry BJ, Wojtovich AP. Mos1 element‐mediated CRISPR integration of transgenes in Caenorhabditis elegans . G3 (Bethesda). 2019;9:2629‐2635. [DOI] [PMC free article] [PubMed] [Google Scholar]
- 35. Chow BY, Han X, Dobry AS, et al. High‐performance genetically targetable optical neural silencing by light‐driven proton pumps. Nature. 2010;463:98‐102. [DOI] [PMC free article] [PubMed] [Google Scholar]
- 36. Brenner S. The genetics of Caenorhabditis elegans . Genetics. 1974;77:71‐94. [DOI] [PMC free article] [PubMed] [Google Scholar]
- 37. Mello C, Fire A. DNA transformation. Methods Cell Biol. 1995;48:451‐482. [PubMed] [Google Scholar]
- 38. Trewin AJ, Bahr LL, Almast A, et al. Mitochondrial reactive oxygen species generated at the complex‐II matrix or intermembrane space microdomain have distinct effects on redox signaling and stress sensitivity in Caenorhabditis elegans . Antioxid Redox Signal. 2019;31:594‐607. [DOI] [PMC free article] [PubMed] [Google Scholar]
- 39. John GB, Shang Y, Li L, et al. The mitochondrial inner membrane protein mitofilin controls cristae morphology. Mol Biol Cell. 2005;16:1543‐1554. [DOI] [PMC free article] [PubMed] [Google Scholar]
- 40. Wojtovich AP, Sherman TA, Nadtochiy SM, Urciuoli WR, Brookes PS, Nehrke K. SLO‐2 is cytoprotective and contributes to mitochondrial potassium transport. PLoS One. 2011;6:e28287. [DOI] [PMC free article] [PubMed] [Google Scholar]
- 41. Jung DW, Davis MH, Brierley GP. Estimation of matrix pH in isolated heart mitochondria using a fluorescent probe. Anal Biochem. 1989;178:348‐354. [DOI] [PubMed] [Google Scholar]
- 42. Aldakkak M, Stowe DF, Cheng Q, Kwok WM, Camara AK. Mitochondrial matrix K+ flux independent of large‐conductance Ca2+‐activated K+ channel opening. Am J Physiol Cell Physiol. 2010;298:C530‐C541. [DOI] [PMC free article] [PubMed] [Google Scholar]
- 43. Lowry OH, Rosebrough NJ, Farr AL, Randall RJ. Protein measurement with the Folin phenol reagent. J Biol Chem. 1951;193:265‐275. [PubMed] [Google Scholar]
- 44. O'Rourke EJ, Soukas AA, Carr CE, Ruvkun G. C elegans major fats are stored in vesicles distinct from lysosome‐related organelles. Cell Metab. 2009;10:430‐435. [DOI] [PMC free article] [PubMed] [Google Scholar]
- 45. Escorcia W, Ruter DL, Nhan J, Curran SP. Quantification of lipid abundance and evaluation of lipid distribution in Caenorhabditis elegans by nile red and oil red O staining. J Vis Exp. 2018;133:e57352. [DOI] [PMC free article] [PubMed] [Google Scholar]
- 46. Sawin ER, Ranganathan R, Horvitz HR. C elegans locomotory rate is modulated by the environment through a dopaminergic pathway and by experience through a serotonergic pathway. Neuron. 2000;26:619‐631. [DOI] [PubMed] [Google Scholar]
- 47. Tsalik EL, Hobert O. Functional mapping of neurons that control locomotory behavior in Caenorhabditis elegans . J Neurobiol. 2003;56:178‐197. [DOI] [PubMed] [Google Scholar]
- 48. Tkatch T, Greotti E, Baranauskas G, et al. Optogenetic control of mitochondrial metabolism and Ca(2+) signaling by mitochondria‐targeted opsins. Proc Natl Acad Sci USA. 2017;114:E5167‐E5176. [DOI] [PMC free article] [PubMed] [Google Scholar]
- 49. De Magalhaes Filho CD, Henriquez B, Seah NE, Evans RM, Lapierre LR, Dillin A. Visible light reduces C elegans longevity. Nat Commun. 2018;9:927. [DOI] [PMC free article] [PubMed] [Google Scholar]
- 50. Yang MY, Chang CJ, Chen LY. Blue light induced reactive oxygen species from flavin mononucleotide and flavin adenine dinucleotide on lethality of HeLa cells. J Photochem Photobiol B. 2017;173:325‐332. [DOI] [PubMed] [Google Scholar]
- 51. Trewin AJ, Berry BJ, Wei AY, Bahr LL, Foster TH, Wojtovich AP. Light‐induced oxidant production by fluorescent proteins. Free Radic Biol Med. 2018;128:157‐164. [DOI] [PMC free article] [PubMed] [Google Scholar]
- 52. Waschuk SA, Bezerra AG Jr, Shi L, Brown LS. Leptosphaeria rhodopsin: bacteriorhodopsin‐like proton pump from a eukaryote. Proc Natl Acad Sci USA. 2005;102:6879‐6883. [DOI] [PMC free article] [PubMed] [Google Scholar]
- 53. Schneider F, Gradmann D, Hegemann P. Ion selectivity and competition in channelrhodopsins. Biophys J. 2013;105:91‐100. [DOI] [PMC free article] [PubMed] [Google Scholar]
- 54. Nagel G, Szellas T, Huhn W, et al. Channelrhodopsin‐2, a directly light‐gated cation‐selective membrane channel. Proc Natl Acad Sci USA. 2003;100:13940‐13945. [DOI] [PMC free article] [PubMed] [Google Scholar]
- 55. Bartok A, Weaver D, Golenar T, et al. IP3 receptor isoforms differently regulate ER‐mitochondrial contacts and local calcium transfer. Nat Commun. 2019;10:3726. [DOI] [PMC free article] [PubMed] [Google Scholar]
- 56. Paggio A, Checchetto V, Campo A, et al. Identification of an ATP‐sensitive potassium channel in mitochondria. Nature. 2019;572:609‐613. [DOI] [PMC free article] [PubMed] [Google Scholar]
- 57. Husson SJ, Liewald JF, Schultheis C, Stirman JN, Lu H, Gottschalk A. Microbial light‐activatable proton pumps as neuronal inhibitors to functionally dissect neuronal networks in C elegans . PLoS One. 2012;7:e40937. [DOI] [PMC free article] [PubMed] [Google Scholar]
- 58. Nicholls DG. The effective proton conductance of the inner membrane of mitochondria from brown adipose tissue. Dependency on proton electrochemical potential gradient. Eur J Biochem. 1977;77:349‐356. [DOI] [PubMed] [Google Scholar]
- 59. Mitchell P. Chemiosmotic coupling in oxidative and photosynthetic phosphorylation. 1966. Biochim Biophys Acta. 2011;1807:1507‐1538. [DOI] [PubMed] [Google Scholar]
- 60. Fagan KA, Luo J, Lagoy RC, Schroeder FC, Albrecht DR, Portman DS. A single‐neuron chemosensory switch determines the valence of a sexually dimorphic sensory behavior. Curr Biol. 2018;28(902–914):e905. [DOI] [PMC free article] [PubMed] [Google Scholar]
- 61. Ryan DA, Miller RM, Lee K, et al. Sex, age, and hunger regulate behavioral prioritization through dynamic modulation of chemoreceptor expression. Curr Biol. 2014;24:2509‐2517. [DOI] [PMC free article] [PubMed] [Google Scholar]
- 62. Lee H, Cho JS, Lambacher N, et al. The Caenorhabditis elegans AMP‐activated protein kinase AAK‐2 is phosphorylated by LKB1 and is required for resistance to oxidative stress and for normal motility and foraging behavior. J Biol Chem. 2008;283:14988‐14993. [DOI] [PMC free article] [PubMed] [Google Scholar]
- 63. Iranon NN, Jochim BE, Miller DL. Fasting prevents hypoxia‐induced defects of proteostasis in C elegans . PLoS Genet. 2019;15:e1008242. [DOI] [PMC free article] [PubMed] [Google Scholar]
- 64. Scott BA, Avidan MS, Crowder CM. Regulation of hypoxic death in C elegans by the insulin/IGF receptor homolog DAF‐2. Science. 2002;296:2388‐2391. [DOI] [PubMed] [Google Scholar]
- 65. Nishino Y, Miura T, Miki T, et al. Ischemic preconditioning activates AMPK in a PKC‐dependent manner and induces GLUT4 up‐regulation in the late phase of cardioprotection. Cardiovasc Res. 2004;61:610‐619. [DOI] [PubMed] [Google Scholar]
- 66. Chen X, Li X, Zhang W, et al. Activation of AMPK inhibits inflammatory response during hypoxia and reoxygenation through modulating JNK‐mediated NF‐kappaB pathway. Metabolism. 2018;83:256‐270. [DOI] [PMC free article] [PubMed] [Google Scholar]
- 67. Emerling BM, Weinberg F, Snyder C, et al. Hypoxic activation of AMPK is dependent on mitochondrial ROS but independent of an increase in AMP/ATP ratio. Free Radic Biol Med. 2009;46:1386‐1391. [DOI] [PMC free article] [PubMed] [Google Scholar]
- 68. Berry BJ, Trewin AJ, Amitrano AM, Kim M, Wojtovich AP. Use the protonmotive force: mitochondrial uncoupling and reactive oxygen species. J Mol Biol. 2018;430:3873‐3891. [DOI] [PMC free article] [PubMed] [Google Scholar]
- 69. Xie X, Shang L, Ye S, Chen C. The protective effect of adenosine‐preconditioning on paraquat‐induced damage in Caenorhabditis elegans . Dose Response. 2020;18:1559325820935329. [DOI] [PMC free article] [PubMed] [Google Scholar]
- 70. Durieux J, Wolff S, Dillin A. The cell‐non‐autonomous nature of electron transport chain‐mediated longevity. Cell. 2011;144:79‐91. [DOI] [PMC free article] [PubMed] [Google Scholar]
- 71. Zhang Q, Wu X, Chen P, et al. The mitochondrial unfolded protein response is mediated cell‐non‐autonomously by retromer‐dependent Wnt signaling. Cell. 2018;174(870–883):e817. [DOI] [PMC free article] [PubMed] [Google Scholar]
- 72. Zhang Y, Lanjuin A, Chowdhury SR, et al. Neuronal TORC1 modulates longevity via AMPK and cell nonautonomous regulation of mitochondrial dynamics in C elegans . Elife. 2019;8 10.7554/eLife.49158 [DOI] [PMC free article] [PubMed] [Google Scholar]
- 73. Corona Velazquez AF, Jackson WT. So many roads: the multifaceted regulation of autophagy induction. Mol Cell Biol. 2018;38 10.1128/MCB.00303-18 [DOI] [PMC free article] [PubMed] [Google Scholar]
- 74. Westermann B. Mitochondrial dynamics in model organisms: what yeasts, worms and flies have taught us about fusion and fission of mitochondria. Semin Cell Dev Biol. 2010;21:542‐549. [DOI] [PubMed] [Google Scholar]
- 75. Wolf C, Lopez Del Amo V, Arndt S, et al. Redox modifications of proteins of the mitochondrial fusion and fission machinery. Cells. 2020;9:815 10.3390/cells9040815 [DOI] [PMC free article] [PubMed] [Google Scholar]
- 76. Seager R, Lee L, Henley JM, Wilkinson KA. Mechanisms and roles of mitochondrial localisation and dynamics in neuronal function. Neuronal Signal. 2020;4:NS20200008. [DOI] [PMC free article] [PubMed] [Google Scholar]
- 77. Imai Y, Inoshita T, Meng H, et al. Light‐driven activation of mitochondrial proton‐motive force improves motor behaviors in a Drosophila model of Parkinson's disease. Commun Biol. 2019;2:424 10.1038/s42003-019-0674-1 [DOI] [PMC free article] [PubMed] [Google Scholar]
Associated Data
This section collects any data citations, data availability statements, or supplementary materials included in this article.
Supplementary Materials
Fig S1‐S6
Table S1